| Param | Original file | Final file |
|---|---|---|
| Filename | modeM0/AS1T05_048T01_9000005318_37384cztM0_level2.evt | modeM0/AS1T05_048T01_9000005318_37384cztM0_level2_quad_clean.evt |
| Size (bytes) | 260,714,880 | 41,734,080 |
| Size | 248.6 MB | 39.8 MB |
| Events in quadrant A | 1,278,003 | 281,090 |
| Events in quadrant B | 1,184,337 | 284,593 |
| Events in quadrant C | 1,285,295 | 285,441 |
| Events in quadrant D | 3,988,370 | 244,097 |
| Mode M0 | |||
|---|---|---|---|
| Quadrant | BADHDUFLAG | Total packets | Discarded packets |
| A | 0 | 5314 | 1 |
| B | 0 | 5062 | 1 |
| C | 0 | 5311 | 4 |
| D | 0 | 13472 | 1 |
| Mode SS | |||
|---|---|---|---|
| Quadrant | BADHDUFLAG | Total packets | Discarded packets |
| A | 0 | 46 | 0 |
| B | 0 | 46 | 0 |
| C | 0 | 46 | 0 |
| D | 0 | 46 | 0 |
| Mode M9 | |||
|---|---|---|---|
| Quadrant | BADHDUFLAG | Total packets | Discarded packets |
| A | 0 | 8 | 0 |
| B | 0 | 8 | 0 |
| C | 0 | 8 | 0 |
| D | 0 | 9 | 0 |
| Quadrant | Total seconds | Saturated seconds | Saturation percentage |
|---|---|---|---|
| A | 2336 | 10 | 0.428082% |
| B | 2336 | 22 | 0.941781% |
| C | 2334 | 31 | 1.328192% |
| D | 2336 | 569 | 24.357877% |
Noise dominated data is calculated using 1-second bins in cleaned event files. If a bin has >2000 counts, and if more than 50% of those come from <1% of pixels, then it is considered to be noise-dominated and hence unusable.
| Quadrant | # 1 sec bins | Bins with >0 counts | Bins with >2000 counts | High rate bins dominated by noise | Noise dominated (total time) | Noise dominated (detector-on time) | Marked lightcurve |
|---|---|---|---|---|---|---|---|
| A | 2336 | 2336 | 8 | 8 | 0.34% | 0.34% | 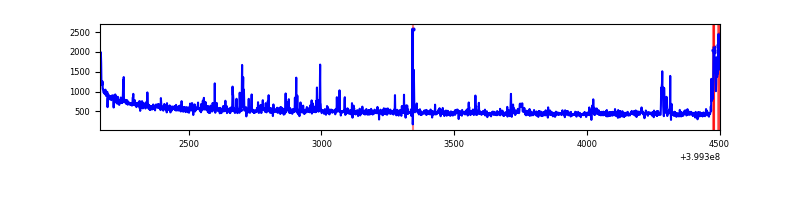 |
| B | 2336 | 2336 | 12 | 12 | 0.51% | 0.51% | 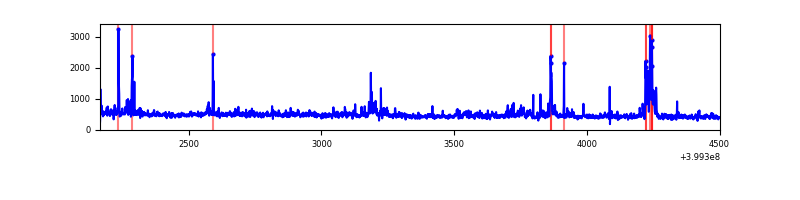 |
| C | 2336 | 2335 | 30 | 30 | 1.28% | 1.28% | 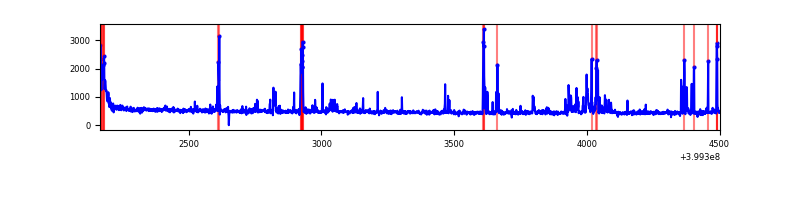 |
| D | 2336 | 2336 | 743 | 743 | 31.81% | 31.81% | 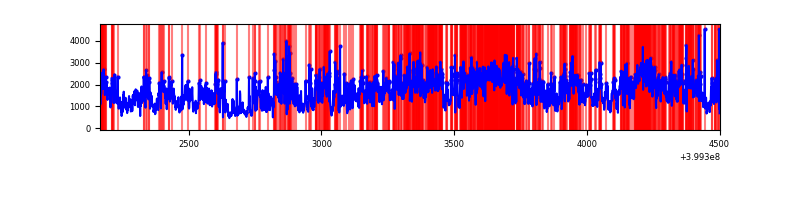 |
Top three noisy pixels from each quadrant. If the there are fewer than three noisy pixels in the level2.evt file, extra rows are filled as -1
| Pixel properties | Quadrant properties | ||||||
|---|---|---|---|---|---|---|---|
| Quadrant | DetID | PixID | Counts | Sigma | Mean | Median | Sigma |
| A | 10 | 83 | 144271 | 2631.84 | 261 | 255 | 54.7 |
| A | 13 | 248 | 61161 | 1113.03 | 261 | 255 | 54.7 |
| A | 9 | 143 | 37137 | 674.0 | 261 | 255 | 54.7 |
| B | 0 | 190 | 66144 | 1284.15 | 256 | 250 | 51.3 |
| B | 15 | 85 | 57342 | 1112.61 | 256 | 250 | 51.3 |
| B | 5 | 172 | 20588 | 396.35 | 256 | 250 | 51.3 |
| C | 15 | 214 | 101625 | 1711.02 | 248 | 249 | 59.2 |
| C | 14 | 254 | 95043 | 1599.93 | 248 | 249 | 59.2 |
| C | 0 | 10 | 39474 | 662.04 | 248 | 249 | 59.2 |
| D | 12 | 235 | 2227142 | 36915.27 | 238 | 231 | 60.3 |
| D | 12 | 227 | 575714 | 9539.72 | 238 | 231 | 60.3 |
| D | 10 | 199 | 77126 | 1274.68 | 238 | 231 | 60.3 |
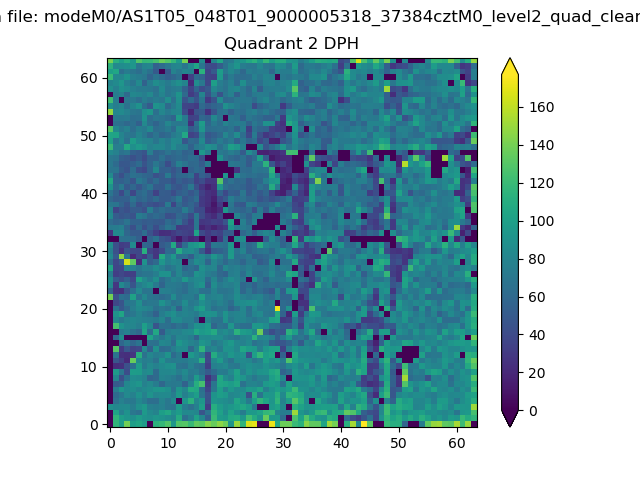
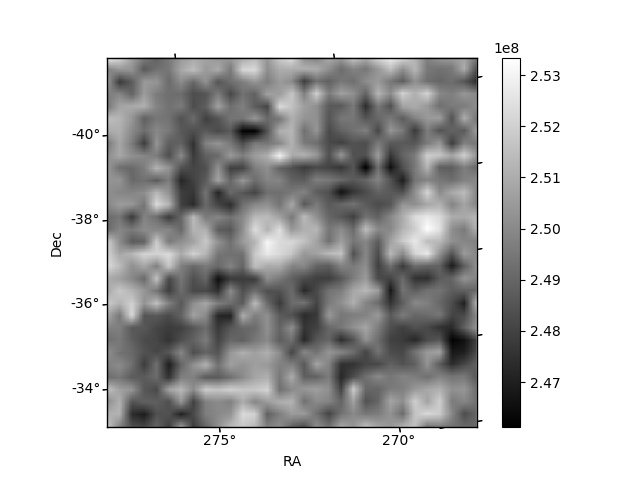
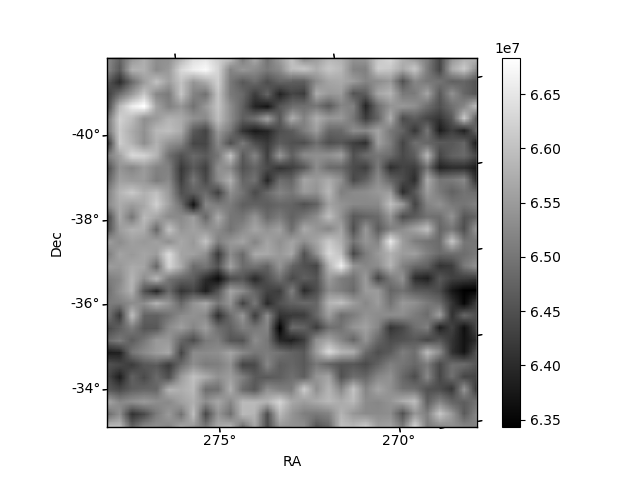
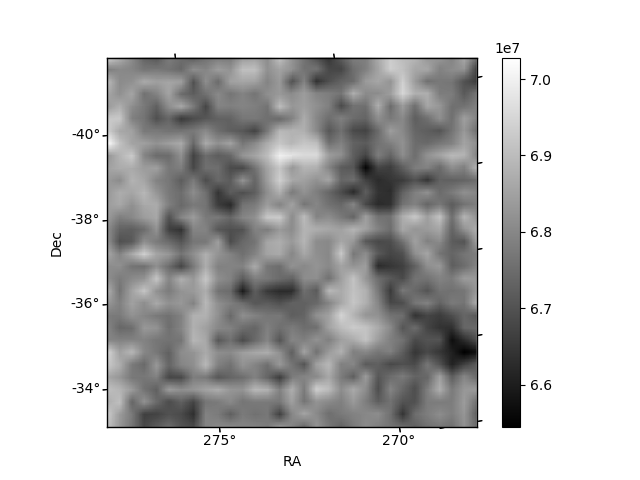
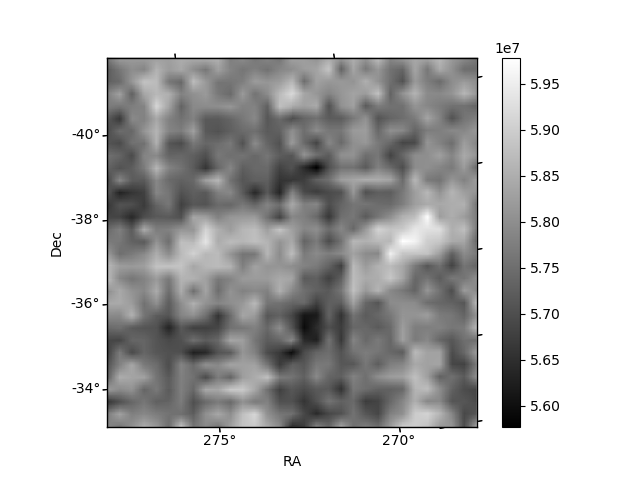
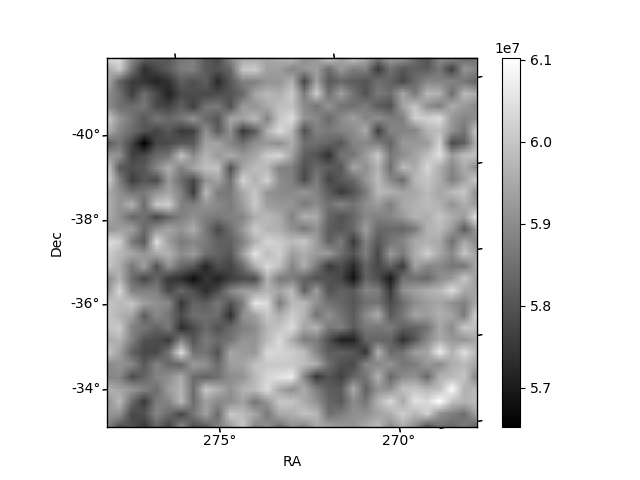
Histogram calculated using DETX and DETY for each event in the final _common_clean file
| Quadrant A | 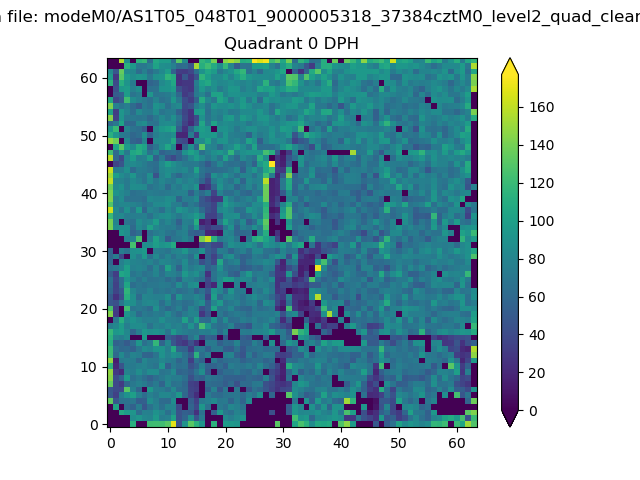 |
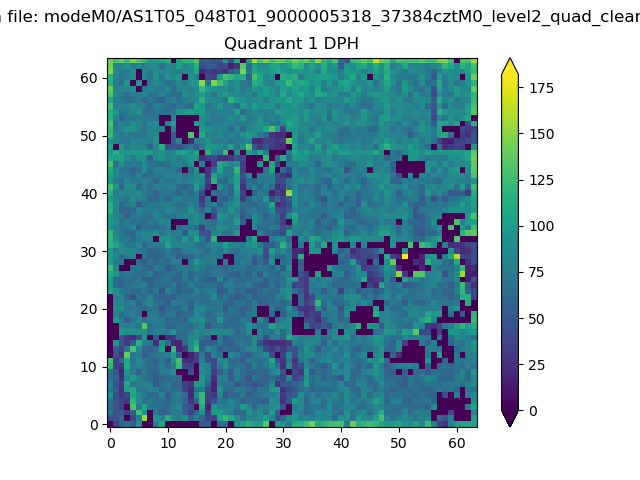 |
Quadrant B |
|---|---|---|---|
| Quadrant D | 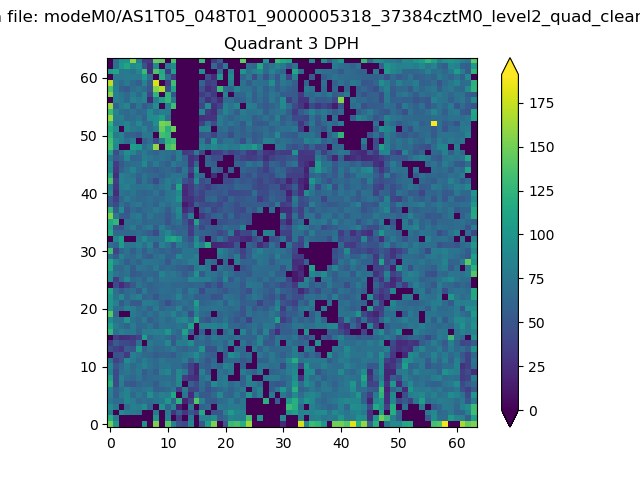 |
 |
Quadrant C |
| Plot type | Count rate plots | Images |
|---|---|---|
| Comparison with Poisson distribution Blue bars denote a histogram of data divided into 1 sec bins. Red curve is a Poisson curve with rate = median count rate of data. |
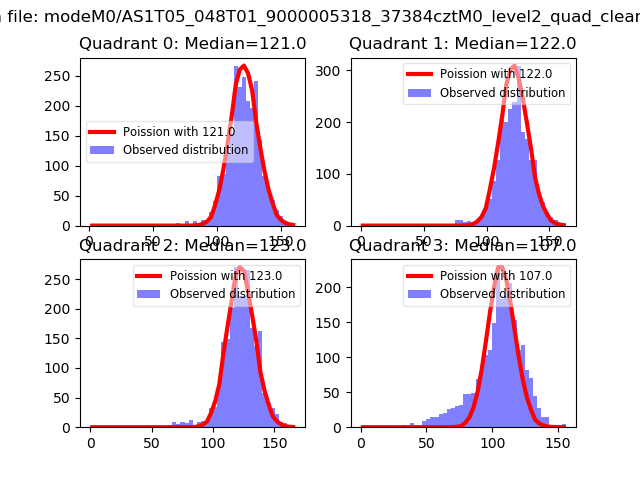 |
 |
| Quadrant-wise count rates Data is divided into 100 sec bins |
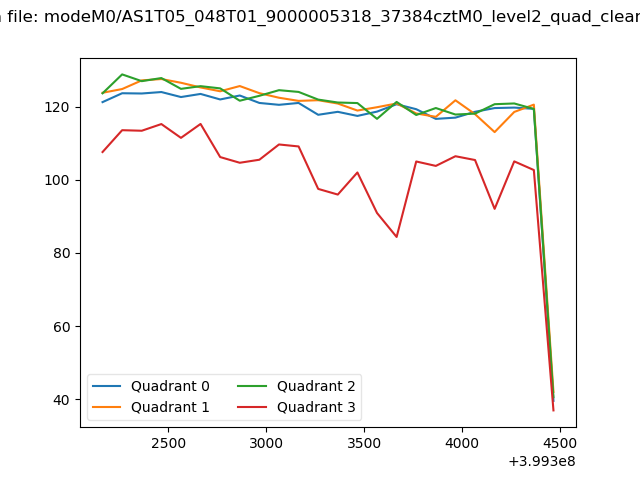 |
|
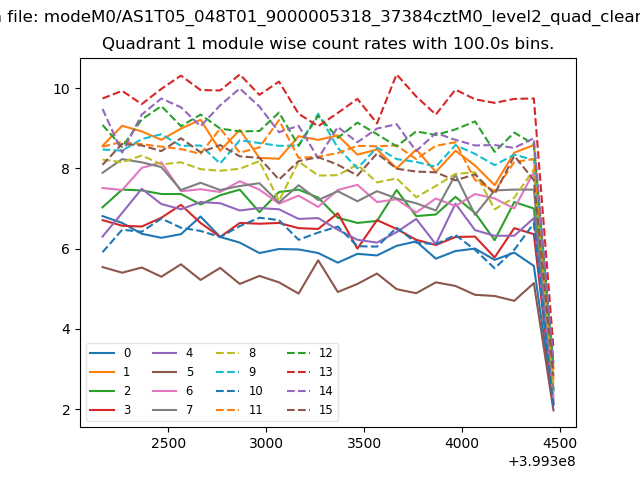
| Module-wise count rates for Quadrant A Data is divided into 100 sec bins |
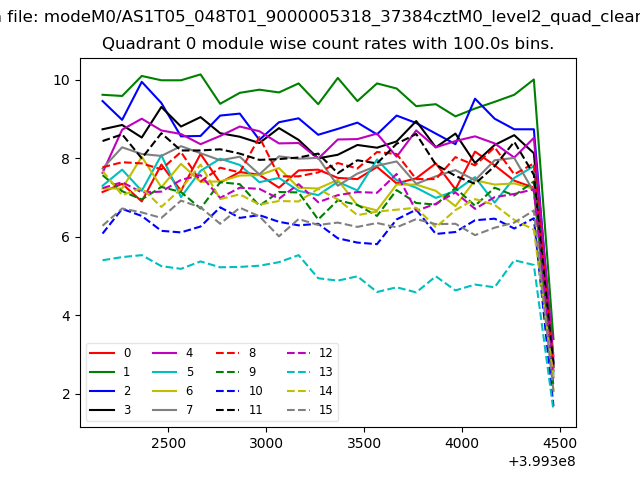 |
 |
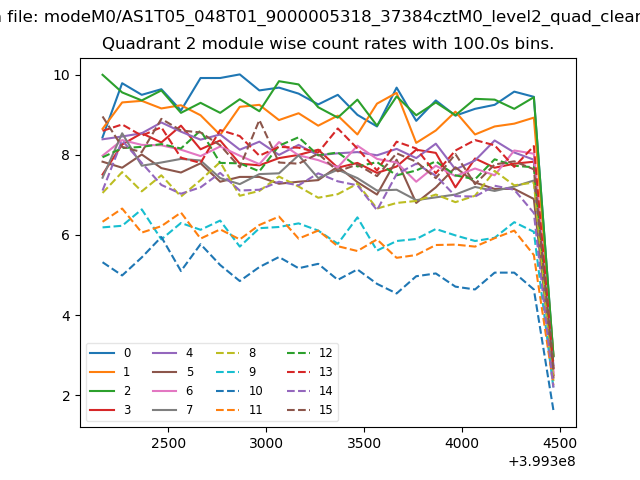
| Module-wise count rates for Quadrant B Data is divided into 100 sec bins |
 |
 |
| Module-wise count rates for Quadrant C Data is divided into 100 sec bins |
 |
 |
| Module-wise count rates for Quadrant D Data is divided into 100 sec bins |
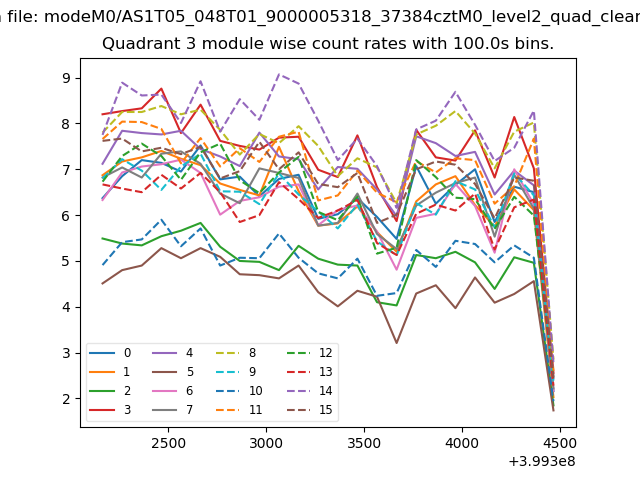 |
 |
| Parameter | Plot |
|---|---|
| CZT HV Monitor | 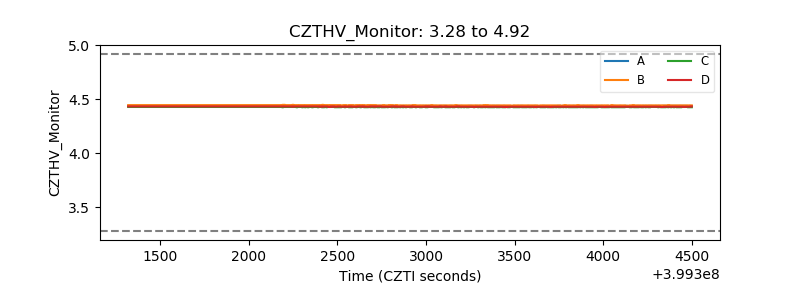 |
| D_VDD | 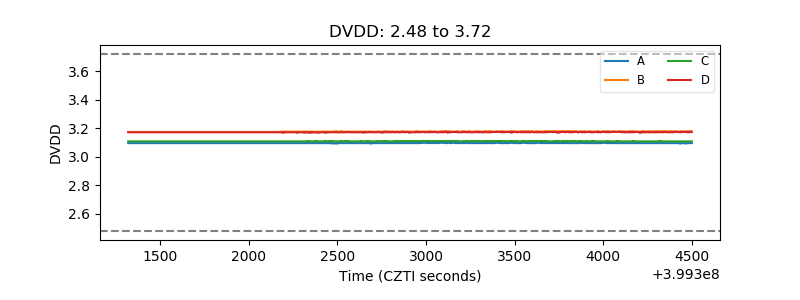 |
| Temperature 1 | 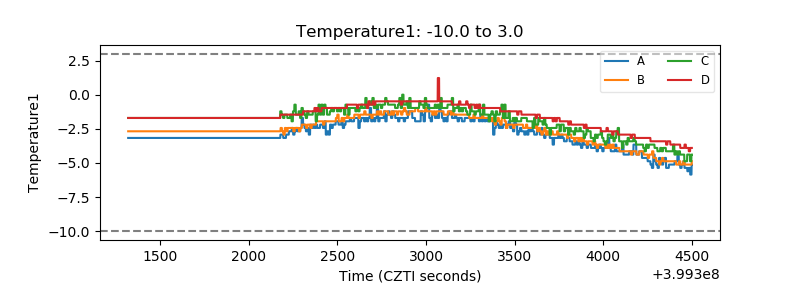 |
| Veto HV Monitor | 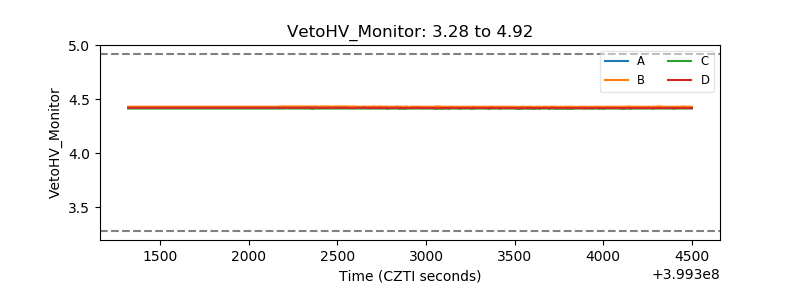 |
| Veto LLD | 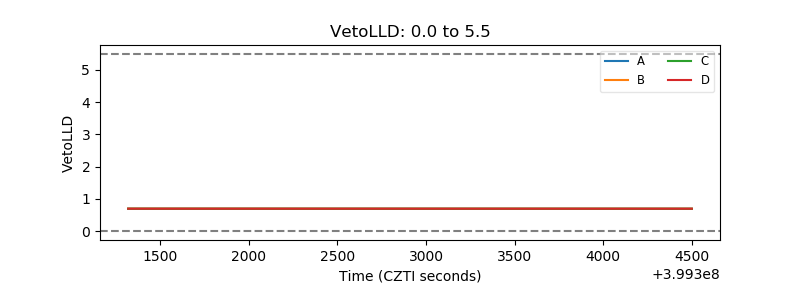 |
| Alpha Counter | 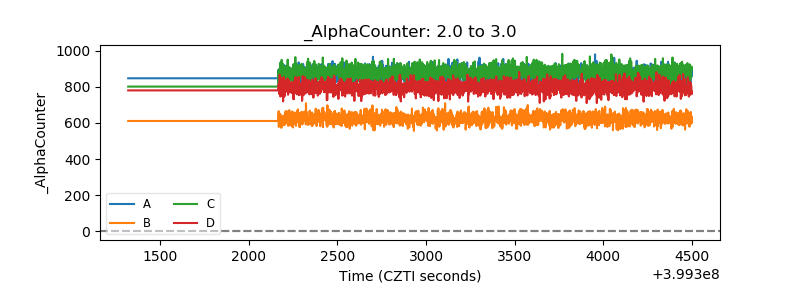 |
| _CPM_Rate | 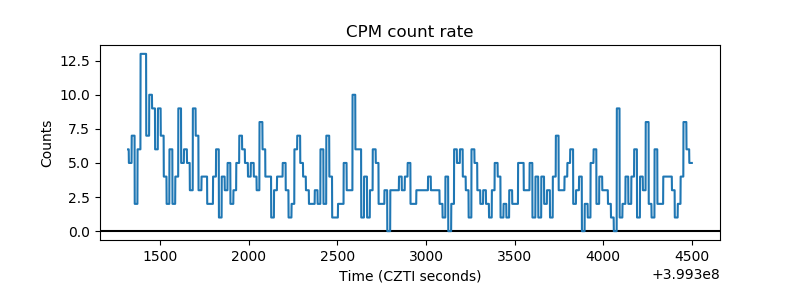 |
| CZT Counter | 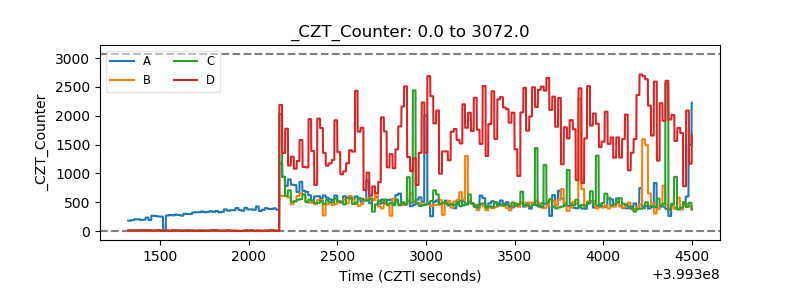 |
| +2.5 Volts monitor | 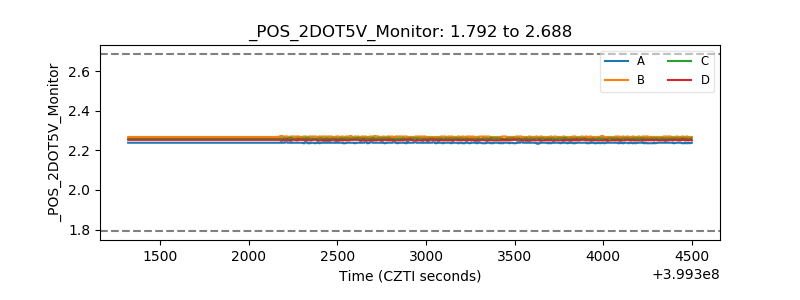 |
| +5 Volts monitor | 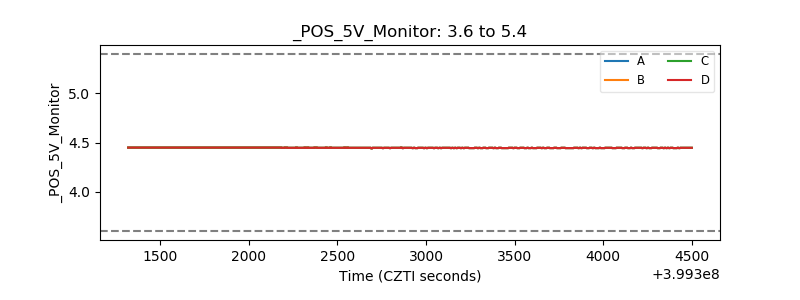 |
| _ROLL_ROT | 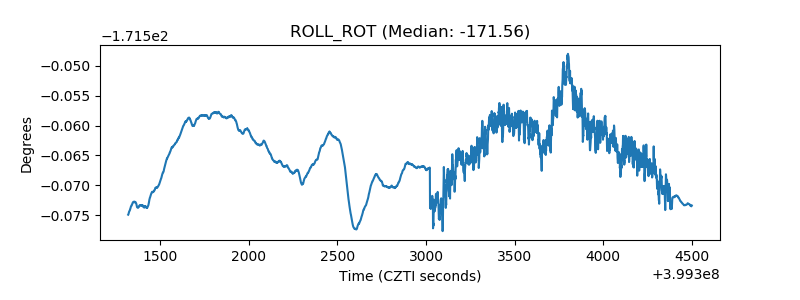 |
| _Roll_DEC | 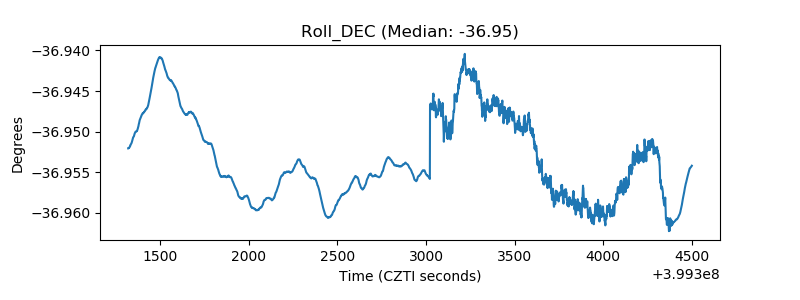 |
| _Roll_RA | 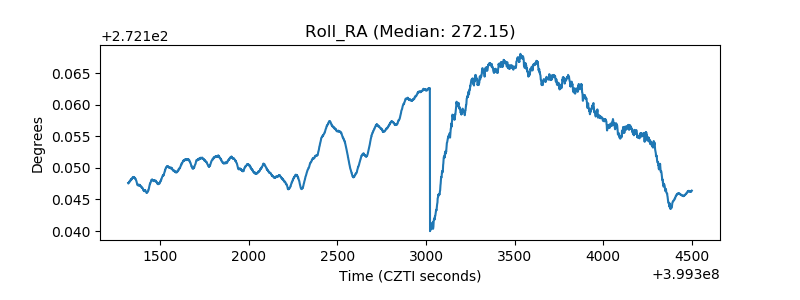 |
| Veto Counter | 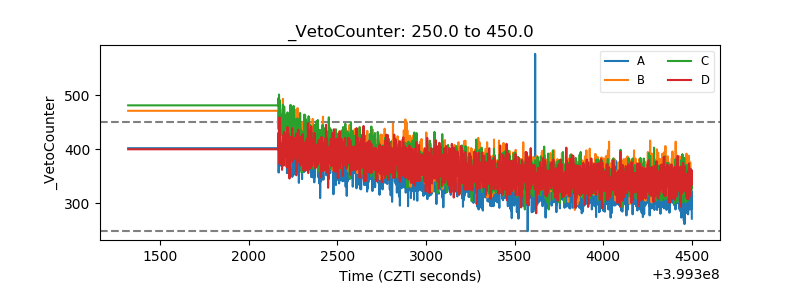 |