| Param | Original file | Final file |
|---|---|---|
| Filename | modeM0/AS1C07_001T01_9000005320_37384cztM0_level2.evt | modeM0/AS1C07_001T01_9000005320_37384cztM0_level2_quad_clean.evt |
| Size (bytes) | 1,249,994,880 | 212,385,600 |
| Size | 1.2 GB | 202.5 MB |
| Events in quadrant A | 6,208,662 | 1,455,682 |
| Events in quadrant B | 6,073,995 | 1,462,088 |
| Events in quadrant C | 6,168,597 | 1,451,836 |
| Events in quadrant D | 18,591,011 | 1,226,336 |
| Mode SS | |||
|---|---|---|---|
| Quadrant | BADHDUFLAG | Total packets | Discarded packets |
| A | 0 | 248 | 0 |
| B | 0 | 248 | 0 |
| C | 0 | 248 | 0 |
| D | 0 | 248 | 0 |
| Mode M0 | |||
|---|---|---|---|
| Quadrant | BADHDUFLAG | Total packets | Discarded packets |
| A | 0 | 26180 | 4 |
| B | 0 | 25996 | 6 |
| C | 0 | 25989 | 3 |
| D | 0 | 63629 | 3 |
| Mode M9 | |||
|---|---|---|---|
| Quadrant | BADHDUFLAG | Total packets | Discarded packets |
| A | 0 | 41 | 0 |
| B | 0 | 41 | 0 |
| C | 0 | 41 | 0 |
| D | 0 | 41 | 0 |
| Quadrant | Total seconds | Saturated seconds | Saturation percentage |
|---|---|---|---|
| A | 12083 | 44 | 0.364148% |
| B | 12081 | 93 | 0.769804% |
| C | 12083 | 97 | 0.802781% |
| D | 12083 | 3603 | 29.818754% |
Noise dominated data is calculated using 1-second bins in cleaned event files. If a bin has >2000 counts, and if more than 50% of those come from <1% of pixels, then it is considered to be noise-dominated and hence unusable.
| Quadrant | # 1 sec bins | Bins with >0 counts | Bins with >2000 counts | High rate bins dominated by noise | Noise dominated (total time) | Noise dominated (detector-on time) | Marked lightcurve |
|---|---|---|---|---|---|---|---|
| A | 16263 | 12086 | 17 | 17 | 0.10% | 0.14% | 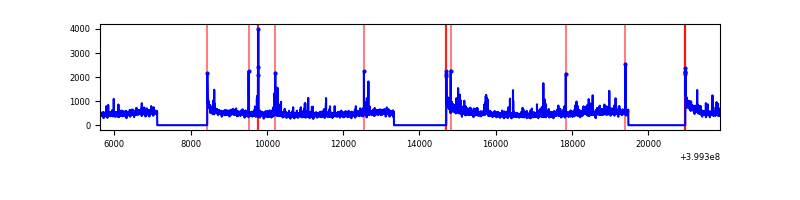 |
| B | 16263 | 12085 | 49 | 49 | 0.30% | 0.41% | 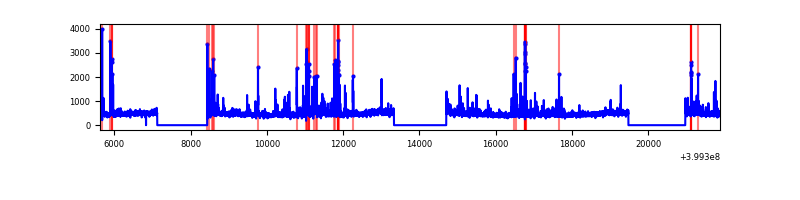 |
| C | 16263 | 12086 | 60 | 60 | 0.37% | 0.50% | 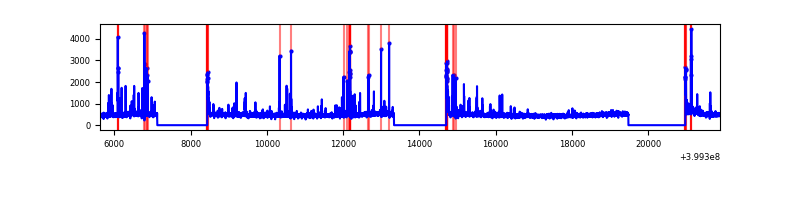 |
| D | 16263 | 12086 | 3432 | 3432 | 21.10% | 28.40% | 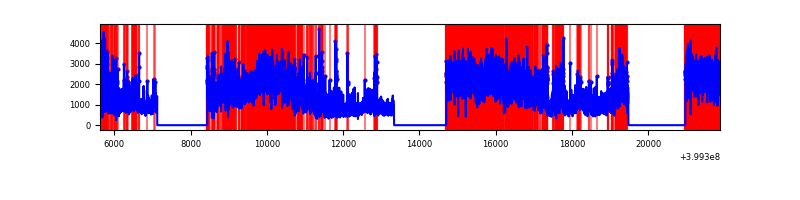 |
Top three noisy pixels from each quadrant. If the there are fewer than three noisy pixels in the level2.evt file, extra rows are filled as -1
| Pixel properties | Quadrant properties | ||||||
|---|---|---|---|---|---|---|---|
| Quadrant | DetID | PixID | Counts | Sigma | Mean | Median | Sigma |
| A | 10 | 83 | 561630 | 2093.08 | 1340 | 1313 | 267.7 |
| A | 6 | 10 | 199083 | 738.77 | 1340 | 1313 | 267.7 |
| A | 9 | 143 | 52212 | 190.13 | 1340 | 1313 | 267.7 |
| B | 0 | 229 | 174318 | 676.74 | 1334 | 1295 | 255.7 |
| B | 0 | 190 | 153309 | 594.57 | 1334 | 1295 | 255.7 |
| B | 5 | 172 | 143611 | 556.64 | 1334 | 1295 | 255.7 |
| C | 15 | 214 | 504513 | 1652.87 | 1308 | 1319 | 304.4 |
| C | 14 | 254 | 187373 | 611.14 | 1308 | 1319 | 304.4 |
| C | 0 | 10 | 138538 | 450.73 | 1308 | 1319 | 304.4 |
| D | 12 | 235 | 11365191 | 39114.89 | 1191 | 1156 | 290.5 |
| D | 2 | 249 | 869378 | 2988.41 | 1191 | 1156 | 290.5 |
| D | 13 | 249 | 640982 | 2202.27 | 1191 | 1156 | 290.5 |
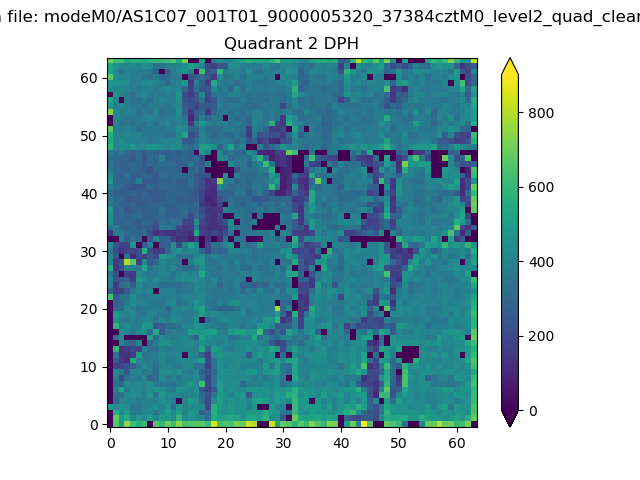
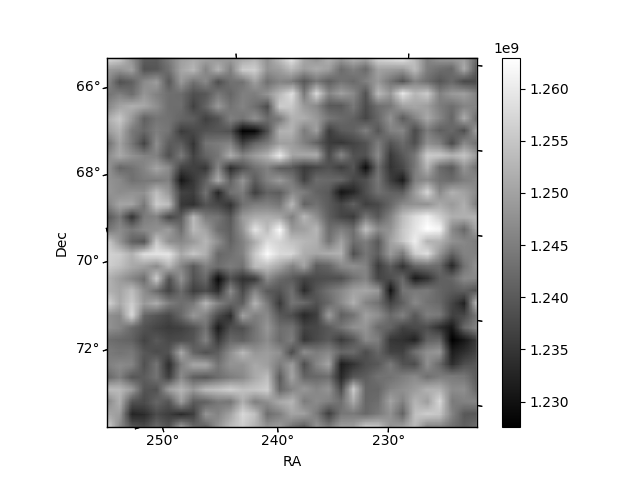
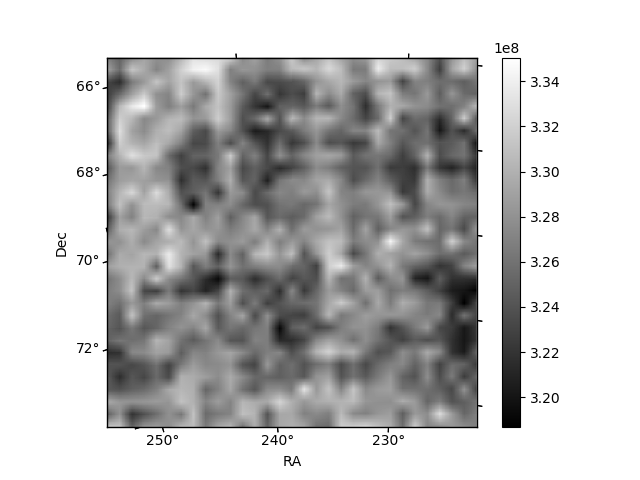
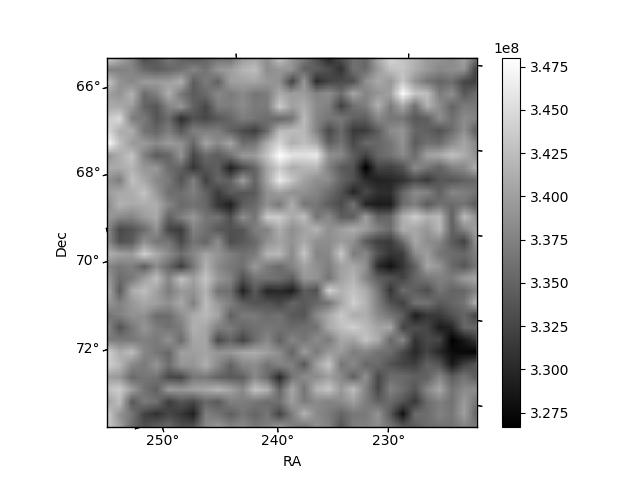
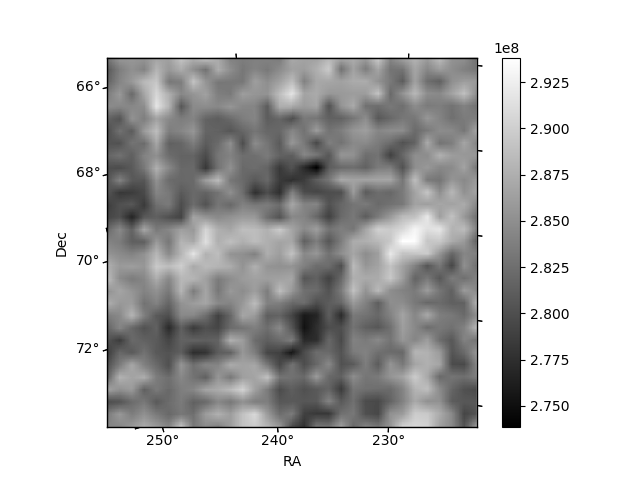
Histogram calculated using DETX and DETY for each event in the final _common_clean file
| Quadrant A | 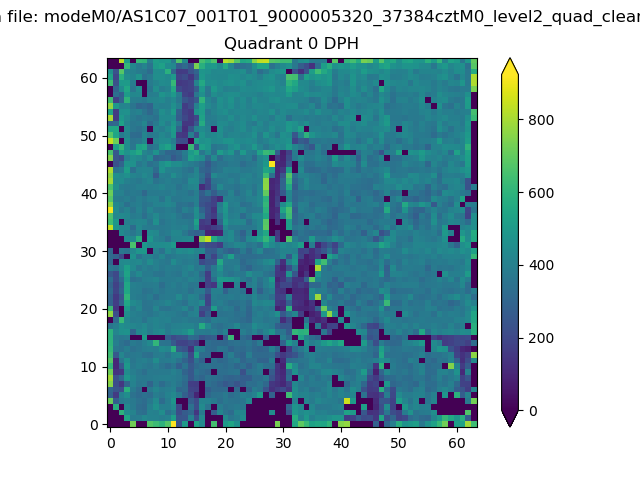 |
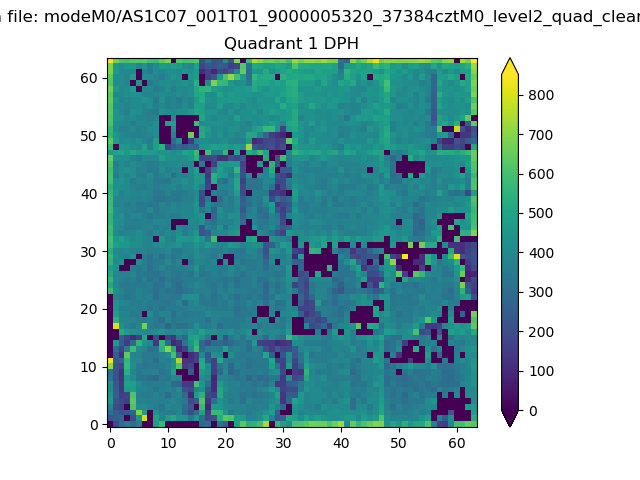 |
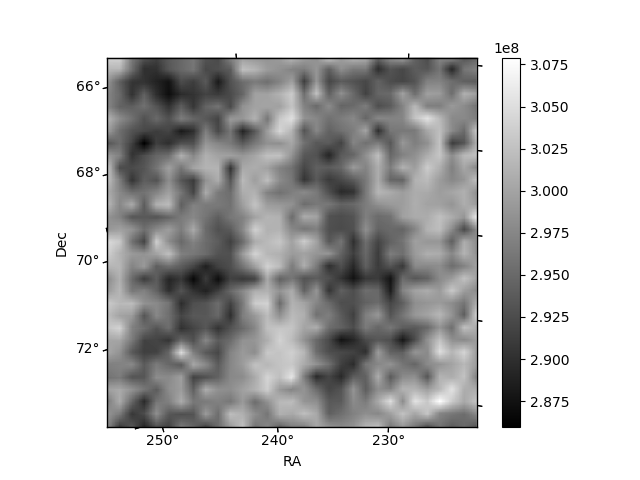
Quadrant B |
|---|---|---|---|
| Quadrant D | 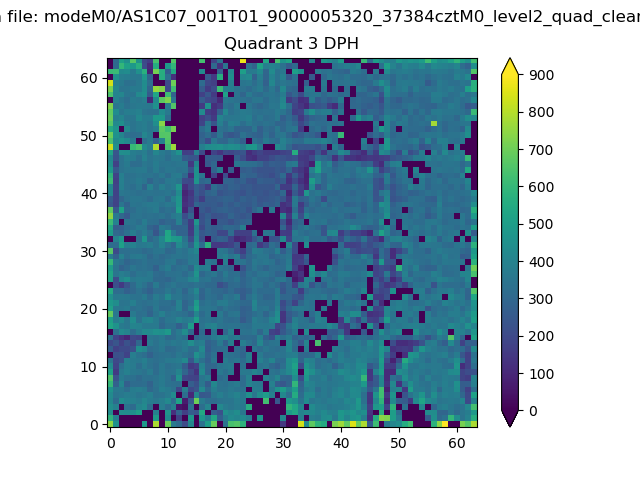 |
 |
Quadrant C |
| Plot type | Count rate plots | Images |
|---|---|---|
| Comparison with Poisson distribution Blue bars denote a histogram of data divided into 1 sec bins. Red curve is a Poisson curve with rate = median count rate of data. |
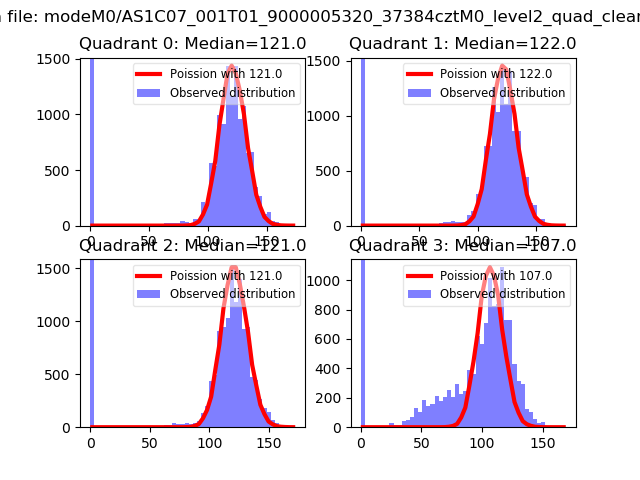 |
 |
| Quadrant-wise count rates Data is divided into 100 sec bins |
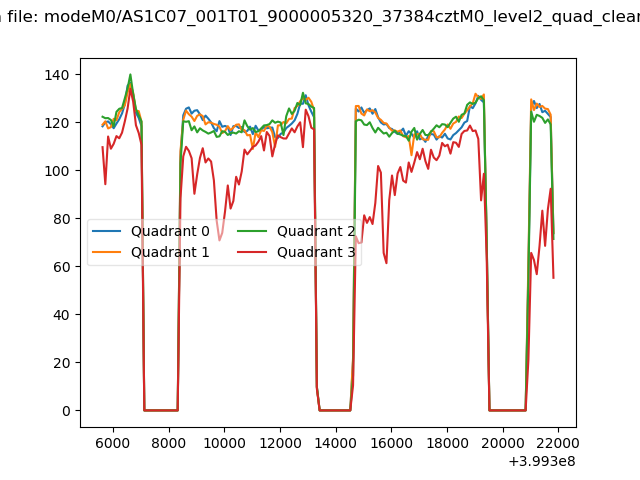 |
|
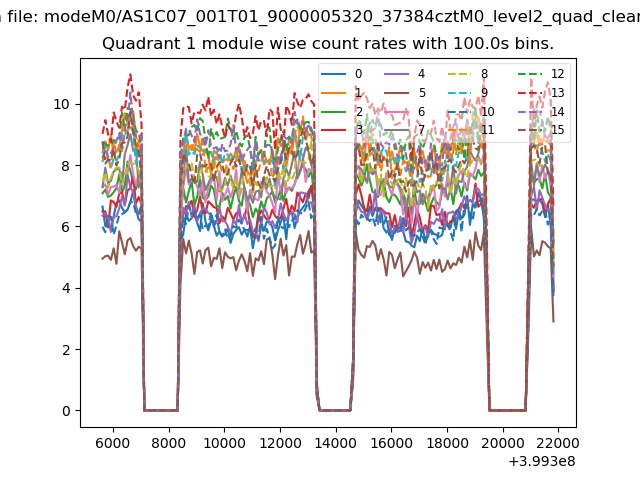
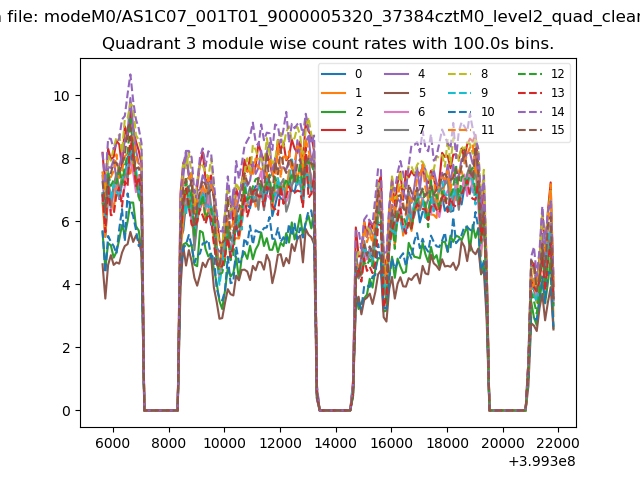
| Module-wise count rates for Quadrant A Data is divided into 100 sec bins |
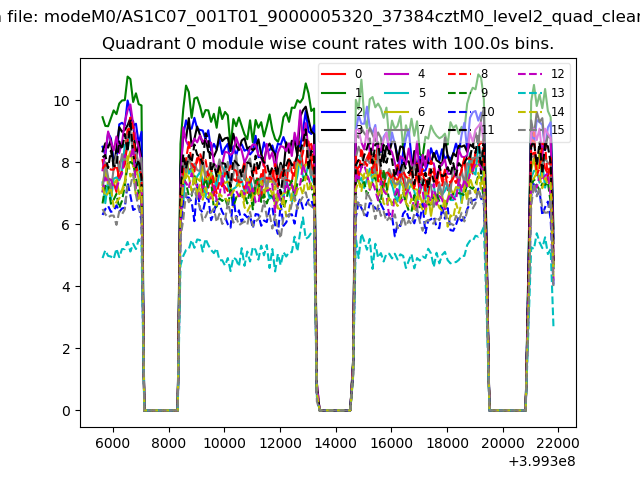 |
 |
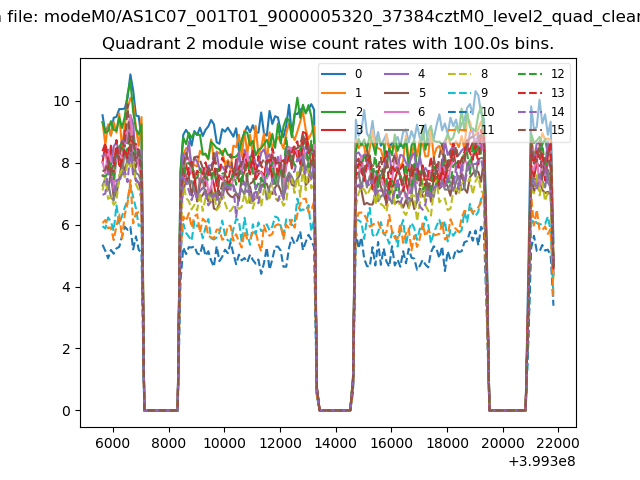
| Module-wise count rates for Quadrant B Data is divided into 100 sec bins |
 |
 |
| Module-wise count rates for Quadrant C Data is divided into 100 sec bins |
 |
 |
| Module-wise count rates for Quadrant D Data is divided into 100 sec bins |
 |
 |
| Parameter | Plot |
|---|---|
| CZT HV Monitor | 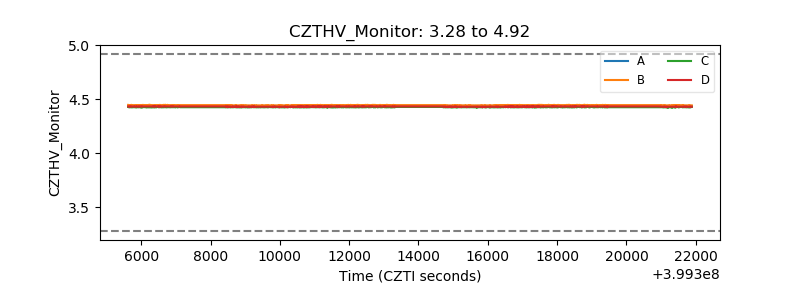 |
| D_VDD | 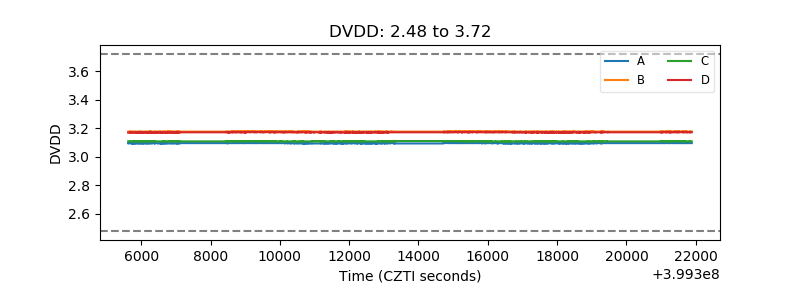 |
| Temperature 1 | 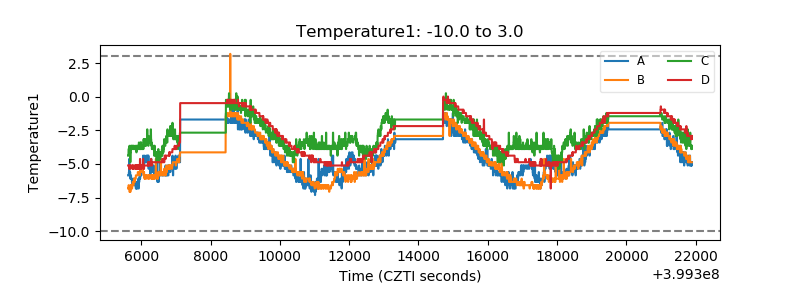 |
| Veto HV Monitor | 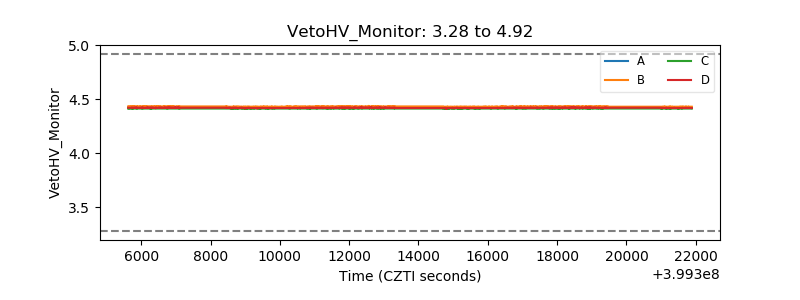 |
| Veto LLD | 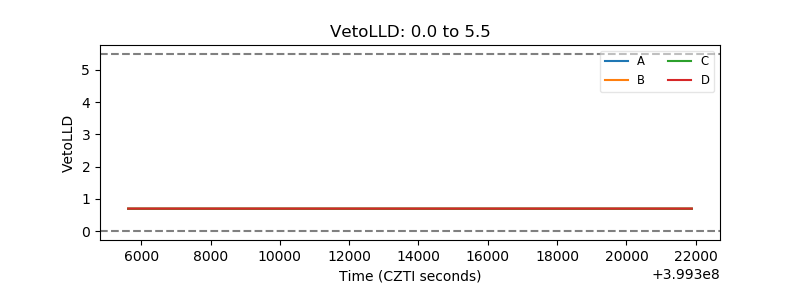 |
| Alpha Counter | 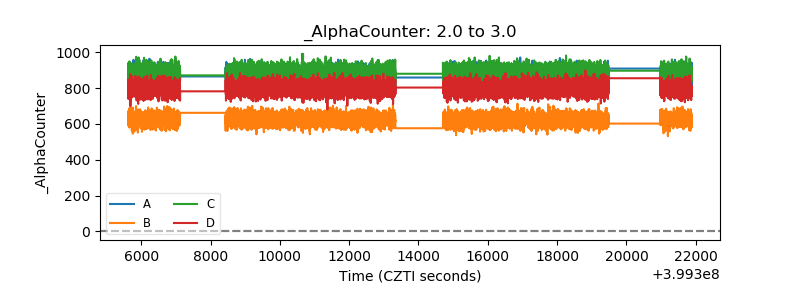 |
| _CPM_Rate | 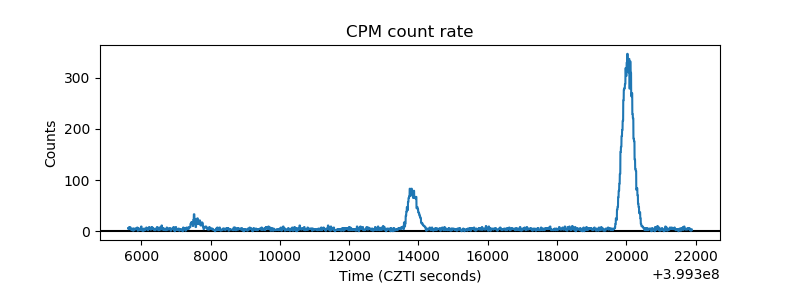 |
| CZT Counter | 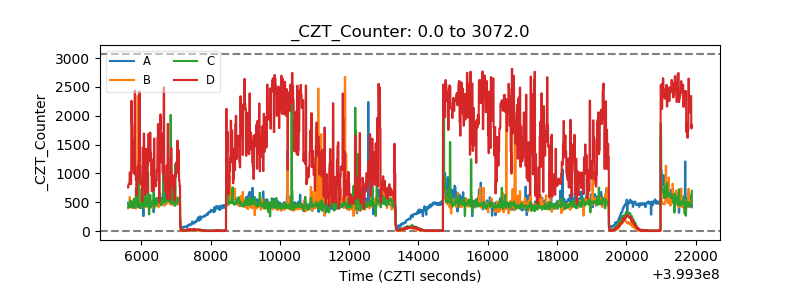 |
| +2.5 Volts monitor | 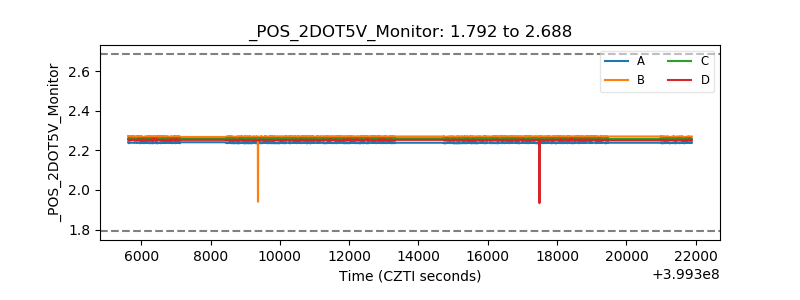 |
| +5 Volts monitor | 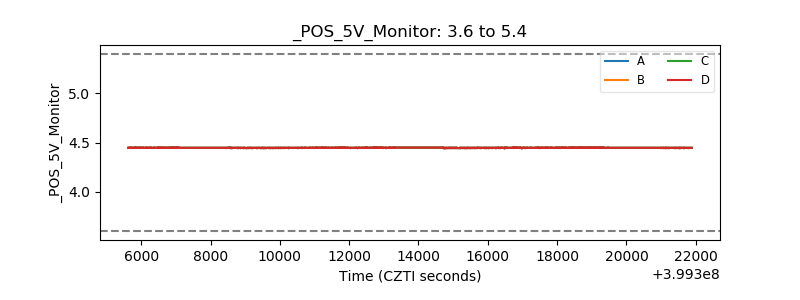 |
| _ROLL_ROT | 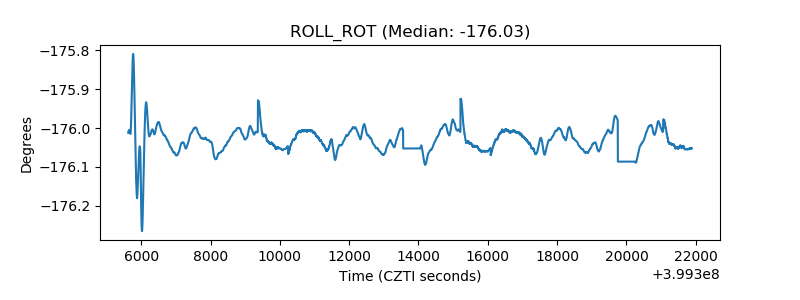 |
| _Roll_DEC | 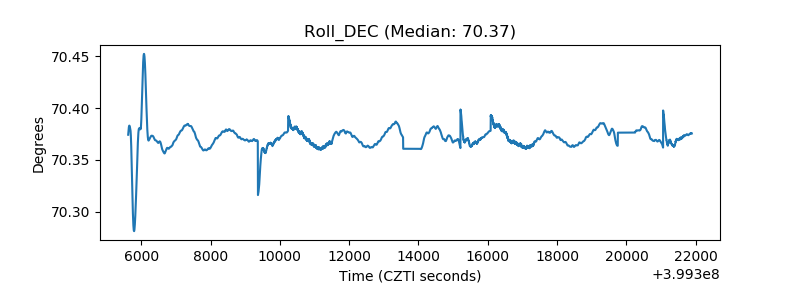 |
| _Roll_RA | 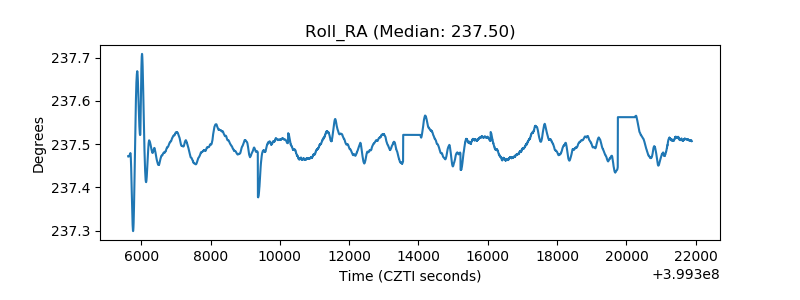 |
| Veto Counter | 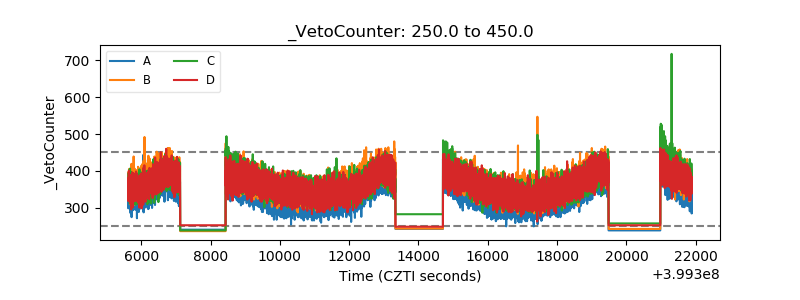 |