| Param | Original file | Final file |
|---|---|---|
| Filename | modeM0/AS1C07_001T01_9000005320_37385cztM0_level2.evt | modeM0/AS1C07_001T01_9000005320_37385cztM0_level2_quad_clean.evt |
| Size (bytes) | 623,266,560 | 94,622,400 |
| Size | 594.4 MB | 90.2 MB |
| Events in quadrant A | 2,910,531 | 659,384 |
| Events in quadrant B | 2,727,735 | 667,839 |
| Events in quadrant C | 2,831,219 | 662,096 |
| Events in quadrant D | 10,035,804 | 492,343 |
| Mode SS | |||
|---|---|---|---|
| Quadrant | BADHDUFLAG | Total packets | Discarded packets |
| A | 0 | 112 | 0 |
| B | 0 | 112 | 0 |
| C | 0 | 112 | 0 |
| D | 0 | 112 | 0 |
| Mode M0 | |||
|---|---|---|---|
| Quadrant | BADHDUFLAG | Total packets | Discarded packets |
| A | 0 | 12287 | 3 |
| B | 0 | 11840 | 2 |
| C | 0 | 11975 | 2 |
| D | 0 | 33584 | 2 |
| Mode M9 | |||
|---|---|---|---|
| Quadrant | BADHDUFLAG | Total packets | Discarded packets |
| A | 0 | 22 | 0 |
| B | 0 | 22 | 0 |
| C | 0 | 22 | 0 |
| D | 0 | 23 | 0 |
| Quadrant | Total seconds | Saturated seconds | Saturation percentage |
|---|---|---|---|
| A | 5466 | 33 | 0.603732% |
| B | 5466 | 28 | 0.512258% |
| C | 5466 | 42 | 0.768386% |
| D | 5466 | 2694 | 49.286498% |
Noise dominated data is calculated using 1-second bins in cleaned event files. If a bin has >2000 counts, and if more than 50% of those come from <1% of pixels, then it is considered to be noise-dominated and hence unusable.
| Quadrant | # 1 sec bins | Bins with >0 counts | Bins with >2000 counts | High rate bins dominated by noise | Noise dominated (total time) | Noise dominated (detector-on time) | Marked lightcurve |
|---|---|---|---|---|---|---|---|
| A | 7080 | 5467 | 16 | 16 | 0.23% | 0.29% | 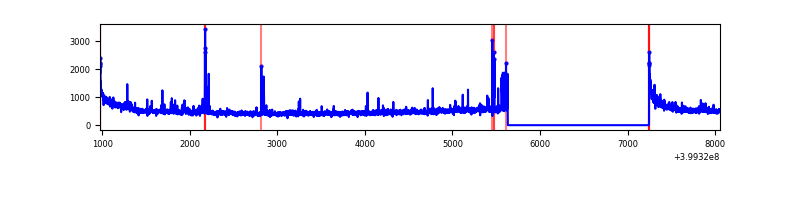 |
| B | 7080 | 5467 | 16 | 16 | 0.23% | 0.29% | 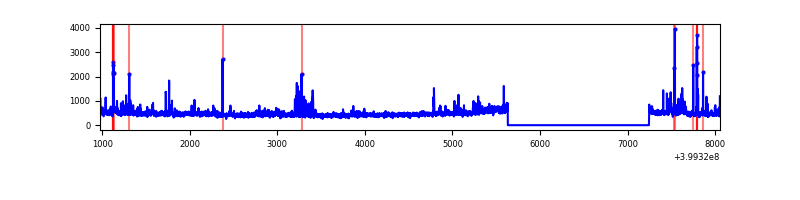 |
| C | 7080 | 5467 | 29 | 29 | 0.41% | 0.53% | 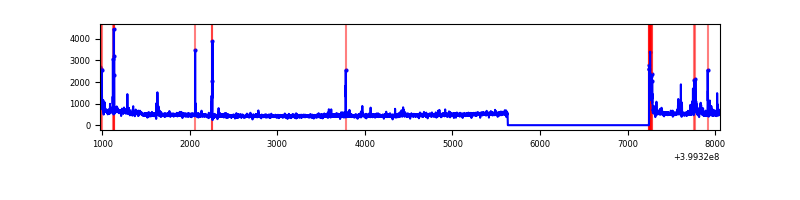 |
| D | 7080 | 5467 | 2473 | 2473 | 34.93% | 45.24% | 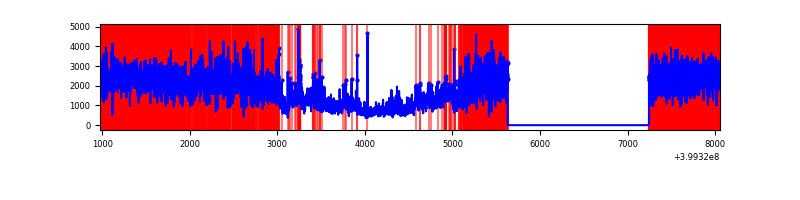 |
Top three noisy pixels from each quadrant. If the there are fewer than three noisy pixels in the level2.evt file, extra rows are filled as -1
| Pixel properties | Quadrant properties | ||||||
|---|---|---|---|---|---|---|---|
| Quadrant | DetID | PixID | Counts | Sigma | Mean | Median | Sigma |
| A | 10 | 83 | 294367 | 2396.03 | 603 | 591 | 122.6 |
| A | 6 | 10 | 151641 | 1231.96 | 603 | 591 | 122.6 |
| A | 13 | 28 | 33312 | 266.87 | 603 | 591 | 122.6 |
| B | 5 | 172 | 82735 | 712.76 | 601 | 585 | 115.3 |
| B | 4 | 232 | 65909 | 566.78 | 601 | 585 | 115.3 |
| B | 0 | 229 | 44022 | 376.88 | 601 | 585 | 115.3 |
| C | 15 | 214 | 232504 | 1687.68 | 590 | 594 | 137.4 |
| C | 0 | 10 | 88286 | 638.16 | 590 | 594 | 137.4 |
| C | 15 | 159 | 78470 | 566.73 | 590 | 594 | 137.4 |
| D | 12 | 235 | 6483973 | 54193.43 | 481 | 466 | 119.6 |
| D | 1 | 47 | 605727 | 5059.17 | 481 | 466 | 119.6 |
| D | 12 | 227 | 383306 | 3200.03 | 481 | 466 | 119.6 |
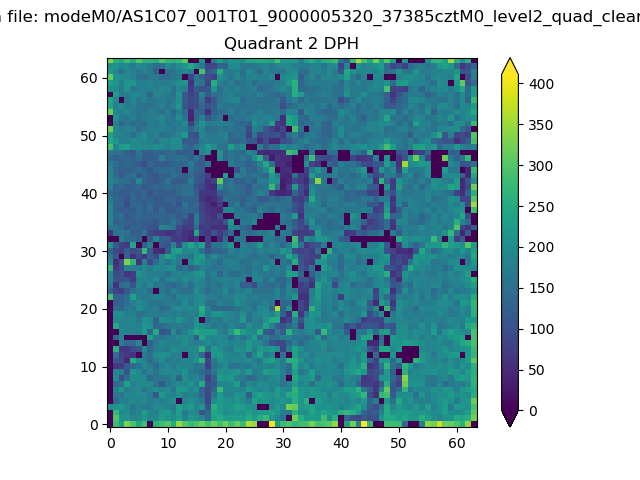
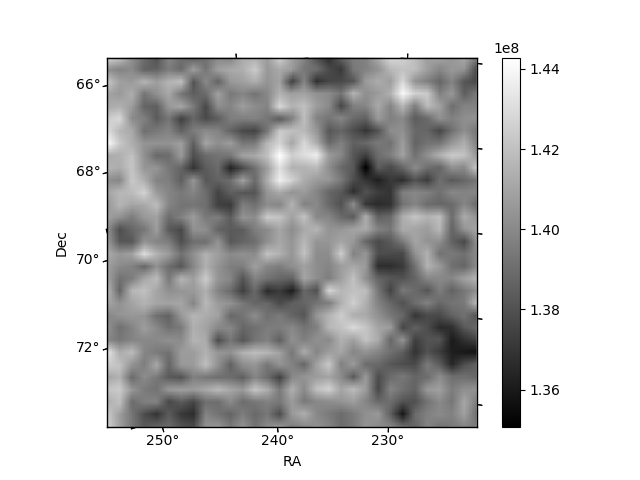
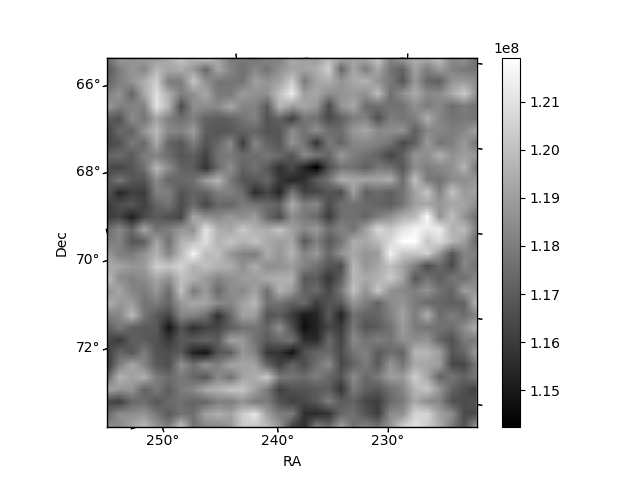
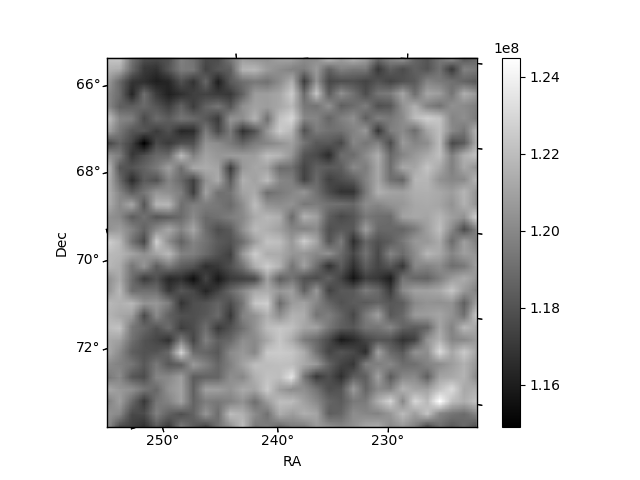
Histogram calculated using DETX and DETY for each event in the final _common_clean file
| Quadrant A | 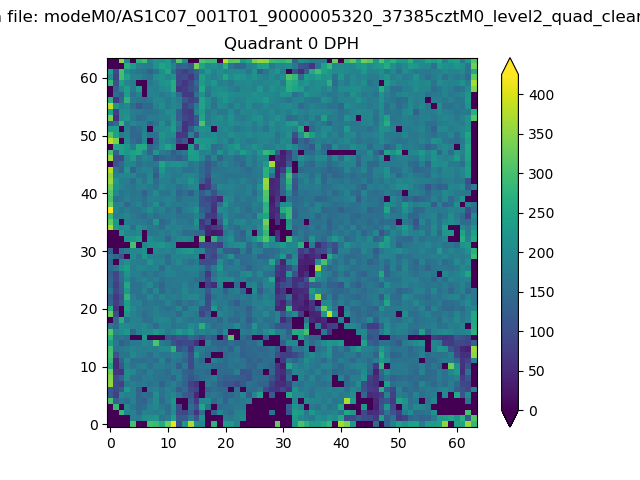 |
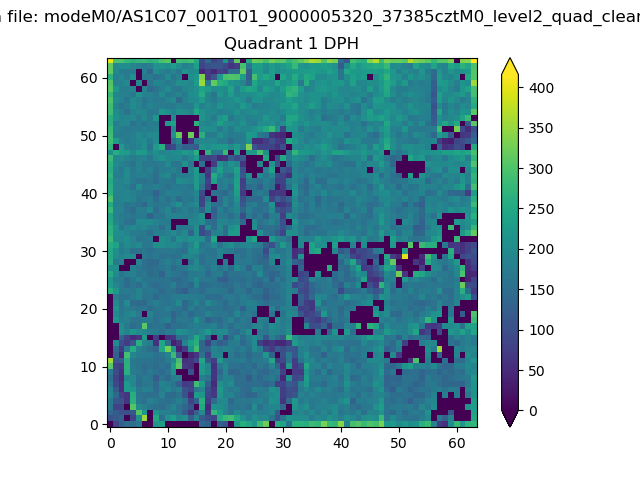 |
Quadrant B |
|---|---|---|---|
| Quadrant D | 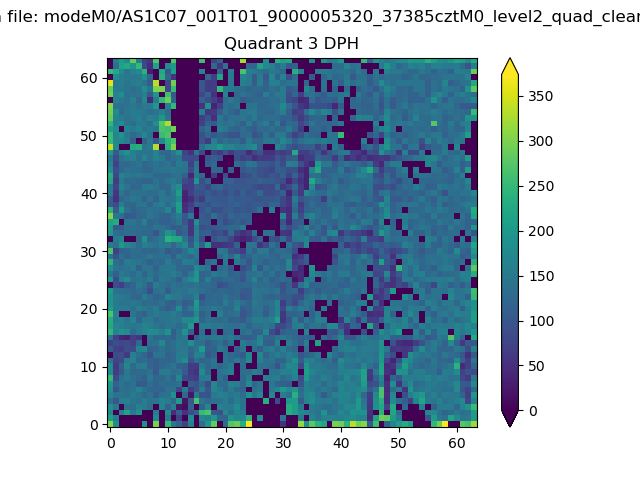 |
 |
Quadrant C |
| Plot type | Count rate plots | Images |
|---|---|---|
| Comparison with Poisson distribution Blue bars denote a histogram of data divided into 1 sec bins. Red curve is a Poisson curve with rate = median count rate of data. |
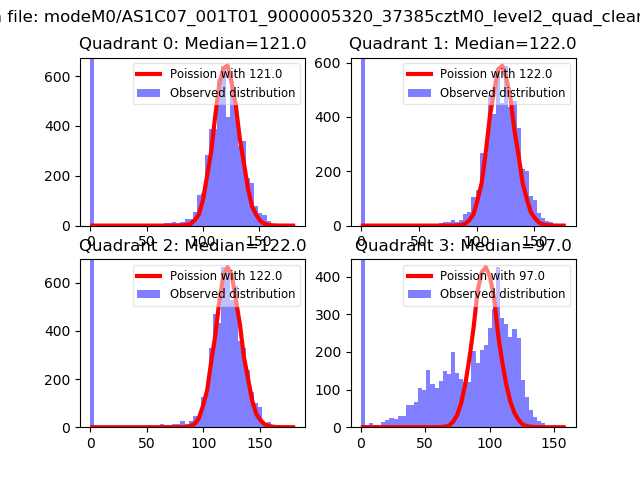 |
 |
| Quadrant-wise count rates Data is divided into 100 sec bins |
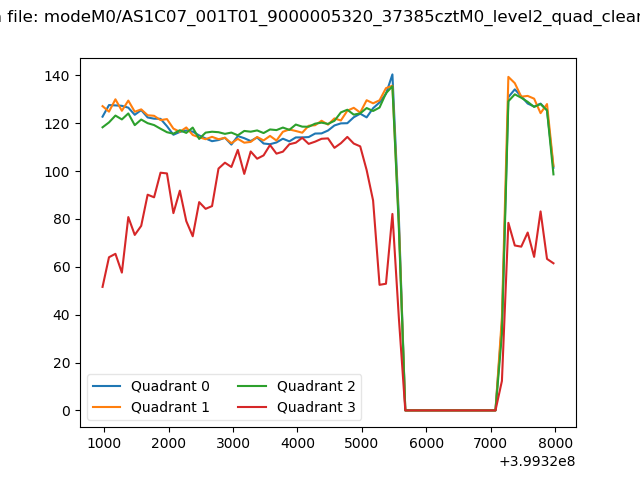 |
|
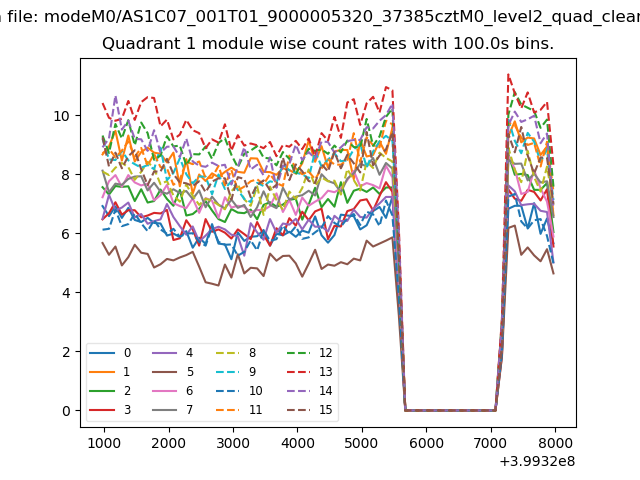
| Module-wise count rates for Quadrant A Data is divided into 100 sec bins |
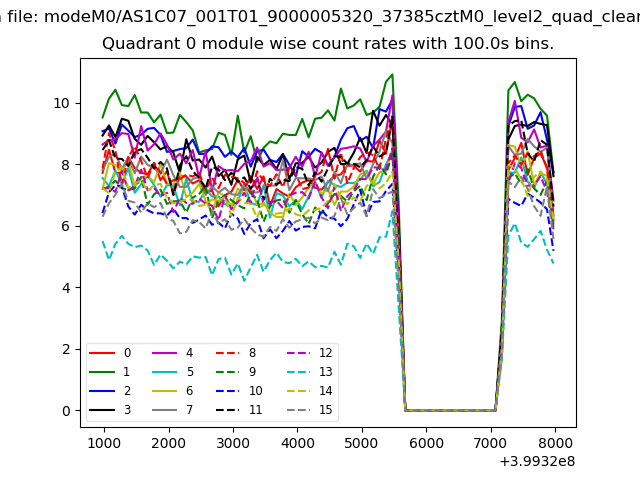 |
 |
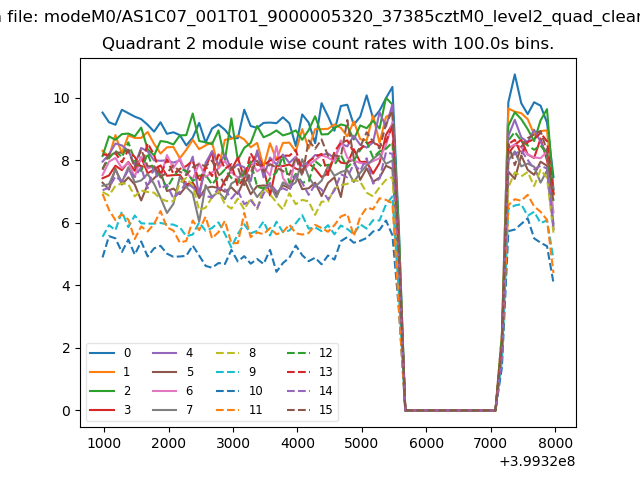
| Module-wise count rates for Quadrant B Data is divided into 100 sec bins |
 |
 |
| Module-wise count rates for Quadrant C Data is divided into 100 sec bins |
 |
 |
| Module-wise count rates for Quadrant D Data is divided into 100 sec bins |
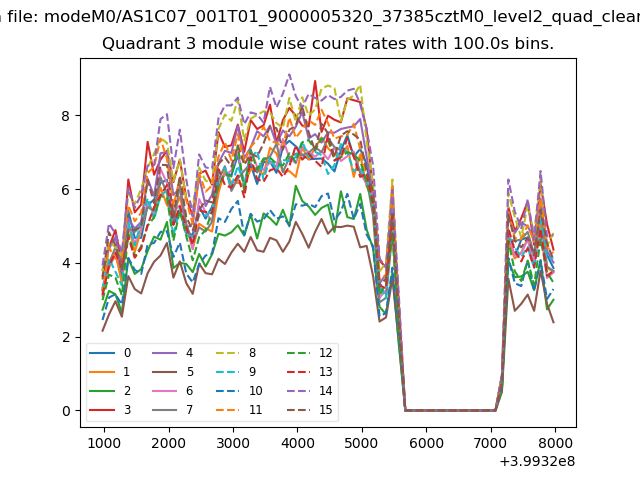 |
 |
| Parameter | Plot |
|---|---|
| CZT HV Monitor | 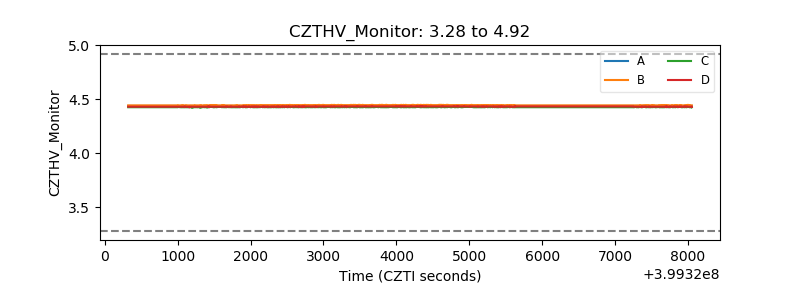 |
| D_VDD | 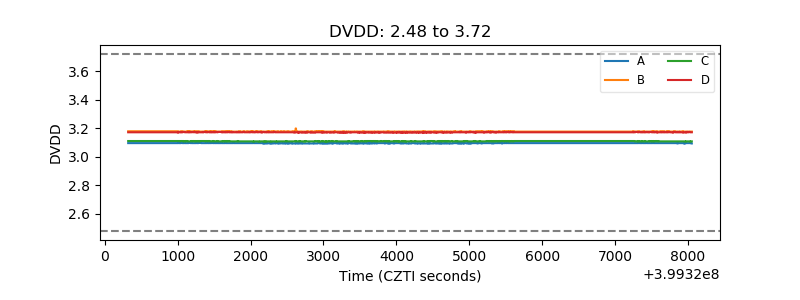 |
| Temperature 1 | 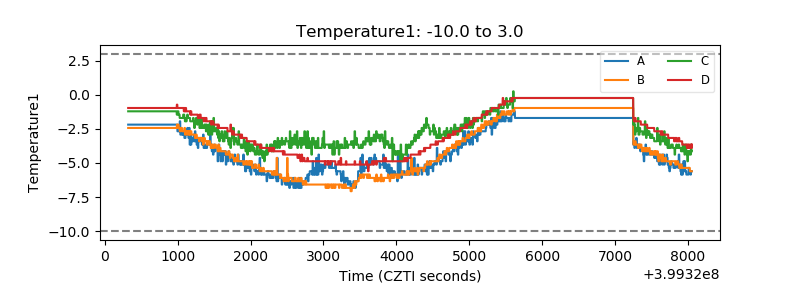 |
| Veto HV Monitor | 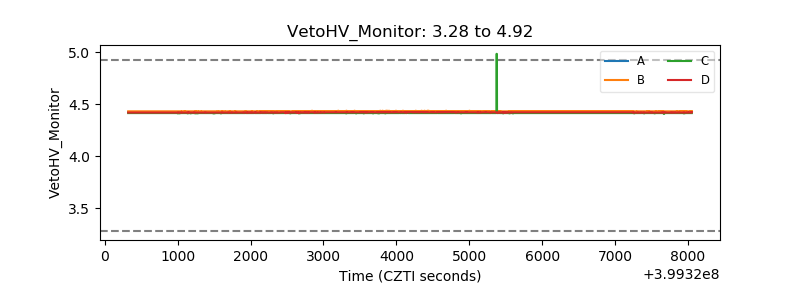 |
| Veto LLD | 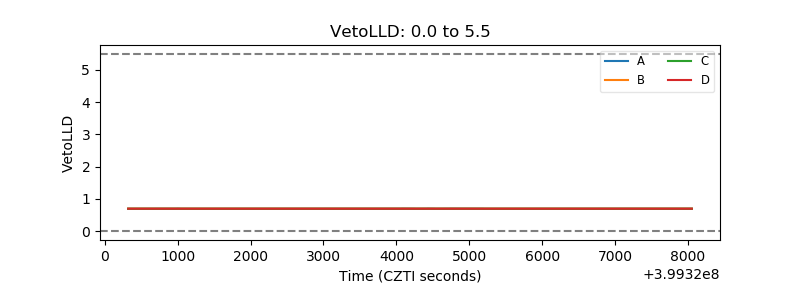 |
| Alpha Counter | 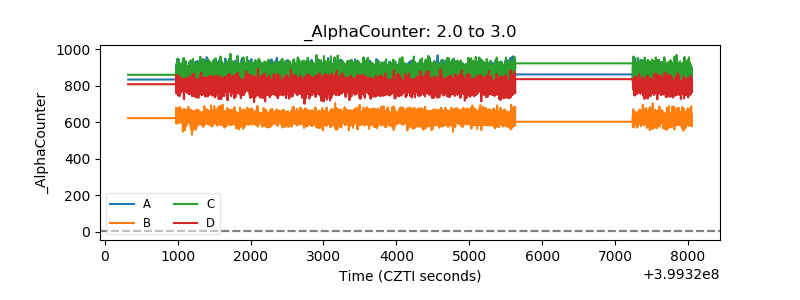 |
| _CPM_Rate | 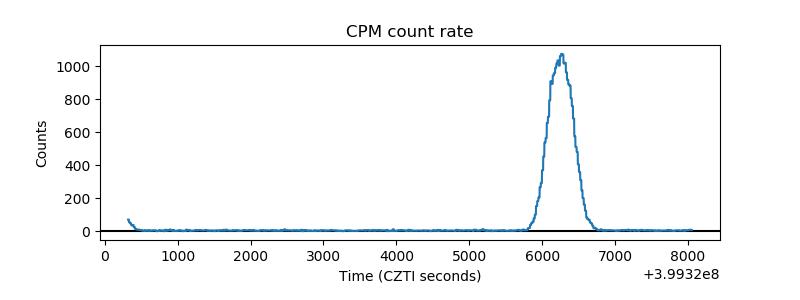 |
| CZT Counter | 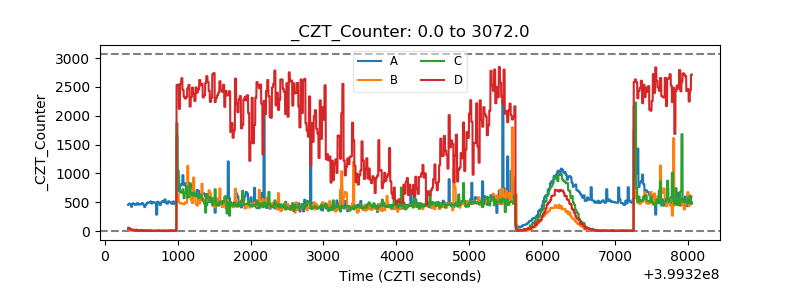 |
| +2.5 Volts monitor | 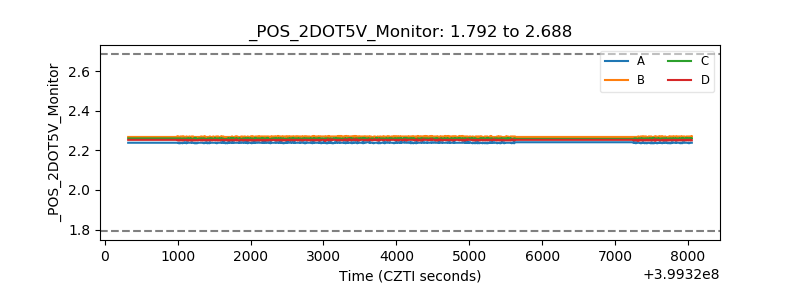 |
| +5 Volts monitor | 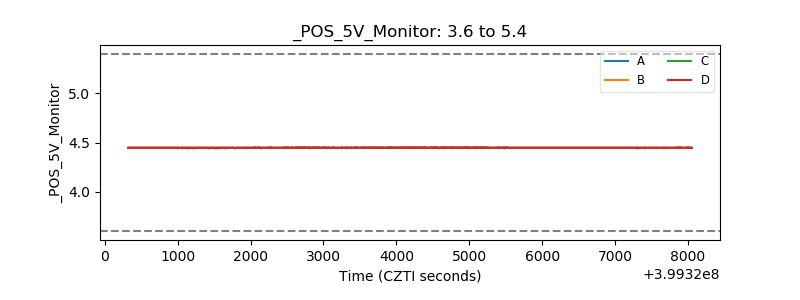 |
| _ROLL_ROT | 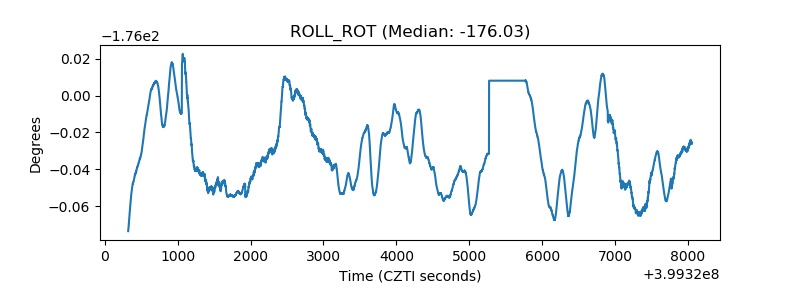 |
| _Roll_DEC | 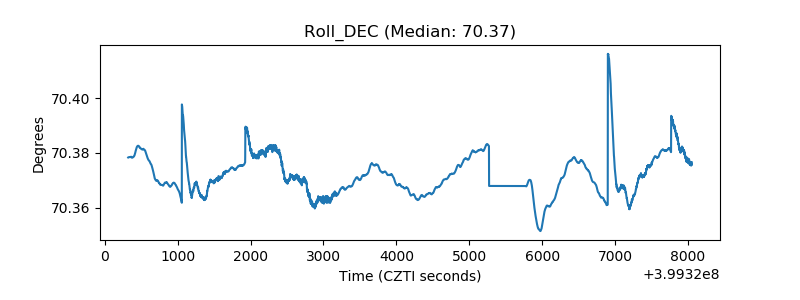 |
| _Roll_RA |  |
| Veto Counter | 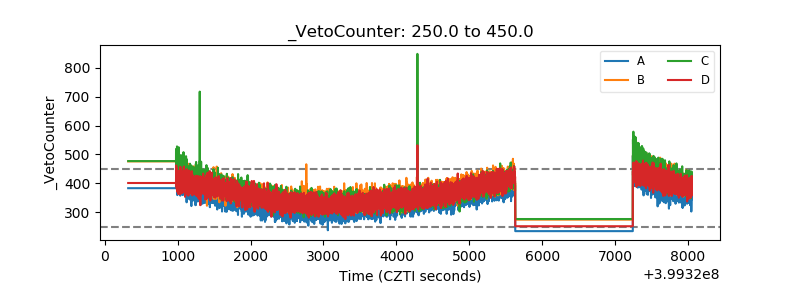 |