| Param | Original file | Final file |
|---|---|---|
| Filename | modeM0/AS1C07_001T01_9000005320_37387cztM0_level2.evt | modeM0/AS1C07_001T01_9000005320_37387cztM0_level2_quad_clean.evt |
| Size (bytes) | 572,112,000 | 95,181,120 |
| Size | 545.6 MB | 90.8 MB |
| Events in quadrant A | 2,772,031 | 658,162 |
| Events in quadrant B | 2,773,815 | 664,461 |
| Events in quadrant C | 2,822,374 | 660,491 |
| Events in quadrant D | 8,598,963 | 526,984 |
| Mode SS | |||
|---|---|---|---|
| Quadrant | BADHDUFLAG | Total packets | Discarded packets |
| A | 0 | 108 | 0 |
| B | 0 | 108 | 0 |
| C | 0 | 108 | 0 |
| D | 0 | 108 | 0 |
| Mode M0 | |||
|---|---|---|---|
| Quadrant | BADHDUFLAG | Total packets | Discarded packets |
| A | 0 | 11751 | 4 |
| B | 0 | 11824 | 2 |
| C | 0 | 11844 | 2 |
| D | 0 | 29285 | 2 |
| Mode M9 | |||
|---|---|---|---|
| Quadrant | BADHDUFLAG | Total packets | Discarded packets |
| A | 0 | 31 | 0 |
| B | 0 | 31 | 0 |
| C | 0 | 31 | 0 |
| D | 0 | 31 | 0 |
| Quadrant | Total seconds | Saturated seconds | Saturation percentage |
|---|---|---|---|
| A | 5309 | 21 | 0.395555% |
| B | 5309 | 62 | 1.167828% |
| C | 5309 | 56 | 1.054813% |
| D | 5309 | 1741 | 32.793370% |
Noise dominated data is calculated using 1-second bins in cleaned event files. If a bin has >2000 counts, and if more than 50% of those come from <1% of pixels, then it is considered to be noise-dominated and hence unusable.
| Quadrant | # 1 sec bins | Bins with >0 counts | Bins with >2000 counts | High rate bins dominated by noise | Noise dominated (total time) | Noise dominated (detector-on time) | Marked lightcurve |
|---|---|---|---|---|---|---|---|
| A | 7044 | 5311 | 13 | 13 | 0.18% | 0.24% | 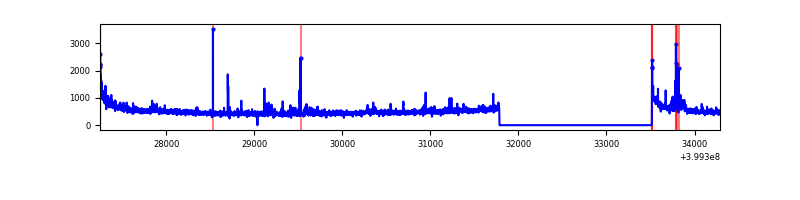 |
| B | 7044 | 5311 | 31 | 31 | 0.44% | 0.58% | 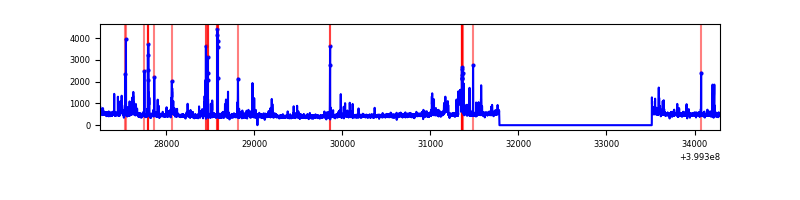 |
| C | 7044 | 5311 | 40 | 40 | 0.57% | 0.75% | 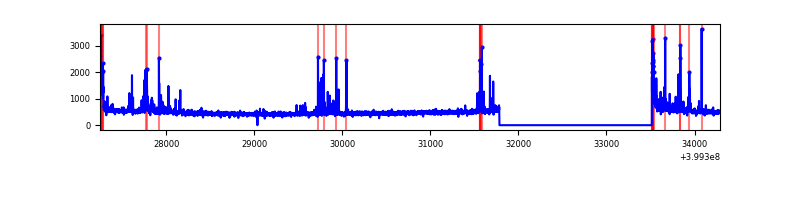 |
| D | 7044 | 5311 | 1583 | 1583 | 22.47% | 29.81% | 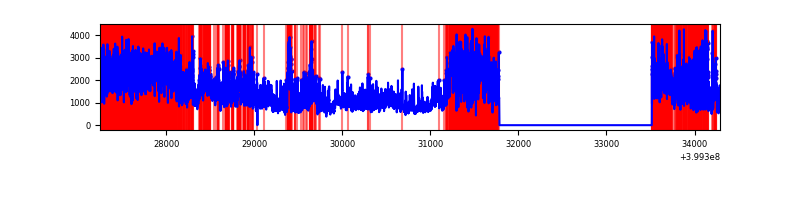 |
Top three noisy pixels from each quadrant. If the there are fewer than three noisy pixels in the level2.evt file, extra rows are filled as -1
| Pixel properties | Quadrant properties | ||||||
|---|---|---|---|---|---|---|---|
| Quadrant | DetID | PixID | Counts | Sigma | Mean | Median | Sigma |
| A | 10 | 83 | 282277 | 2359.55 | 588 | 577 | 119.4 |
| A | 6 | 10 | 61753 | 512.42 | 588 | 577 | 119.4 |
| A | 13 | 248 | 44292 | 366.16 | 588 | 577 | 119.4 |
| B | 5 | 172 | 150011 | 1337.26 | 586 | 570 | 111.8 |
| B | 5 | 200 | 141400 | 1260.2 | 586 | 570 | 111.8 |
| B | 0 | 190 | 34367 | 302.43 | 586 | 570 | 111.8 |
| C | 15 | 214 | 225525 | 1678.46 | 577 | 580 | 134.0 |
| C | 14 | 254 | 169446 | 1260.02 | 577 | 580 | 134.0 |
| C | 0 | 10 | 90930 | 674.16 | 577 | 580 | 134.0 |
| D | 12 | 235 | 4522104 | 37251.28 | 496 | 481 | 121.4 |
| D | 12 | 227 | 590406 | 4860.08 | 496 | 481 | 121.4 |
| D | 1 | 47 | 534442 | 4399.02 | 496 | 481 | 121.4 |
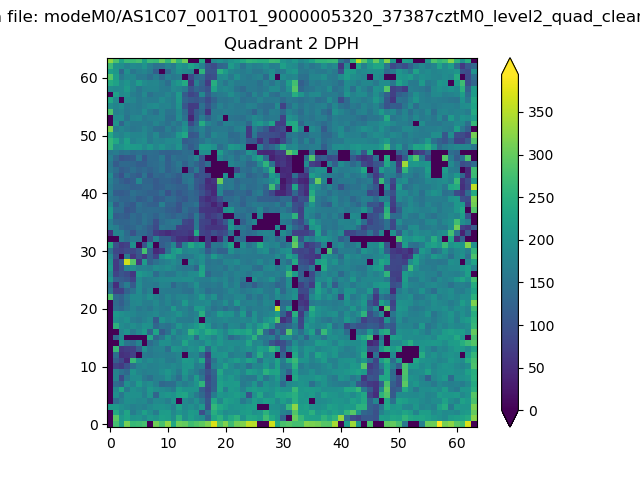
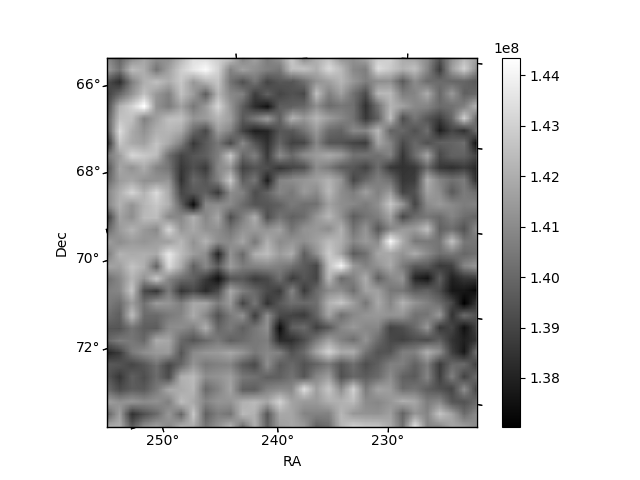
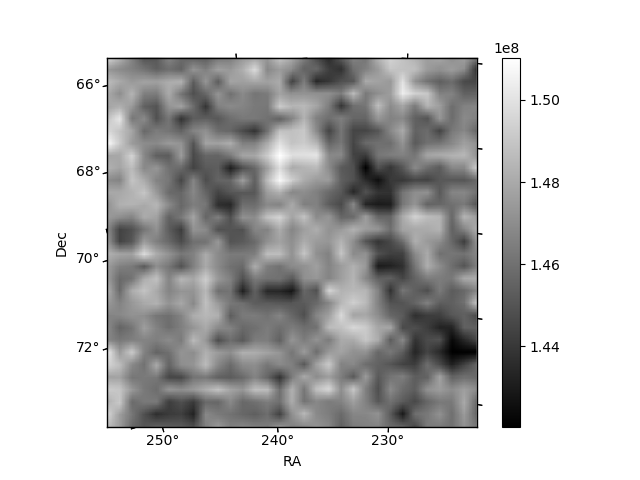
Histogram calculated using DETX and DETY for each event in the final _common_clean file
| Quadrant A | 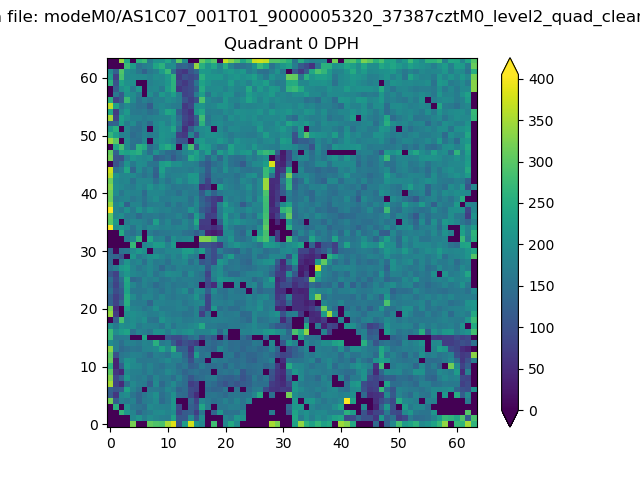 |
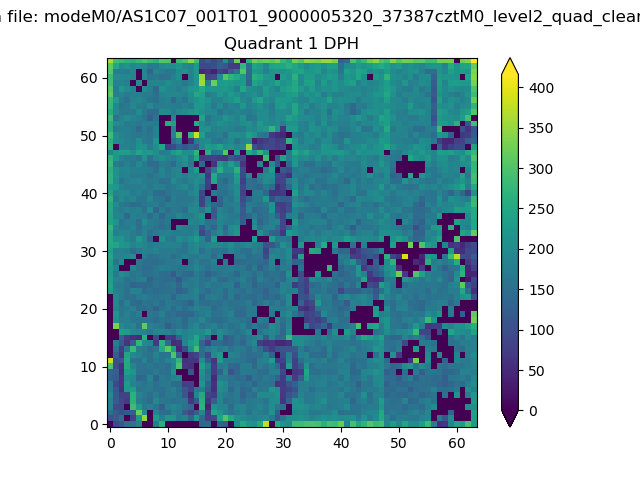 |
Quadrant B |
|---|---|---|---|
| Quadrant D | 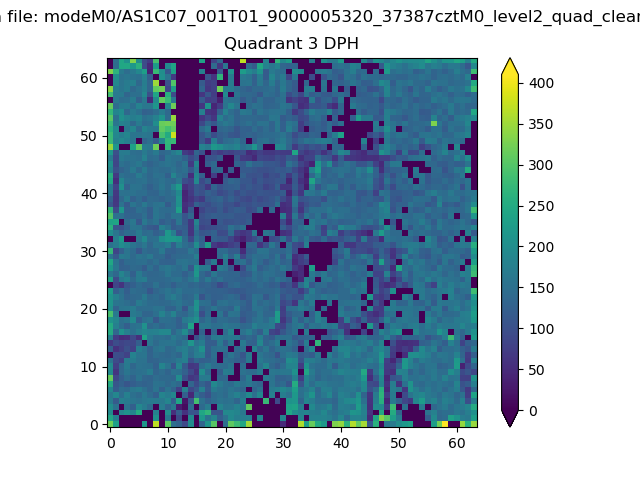 |
 |
Quadrant C |
| Plot type | Count rate plots | Images |
|---|---|---|
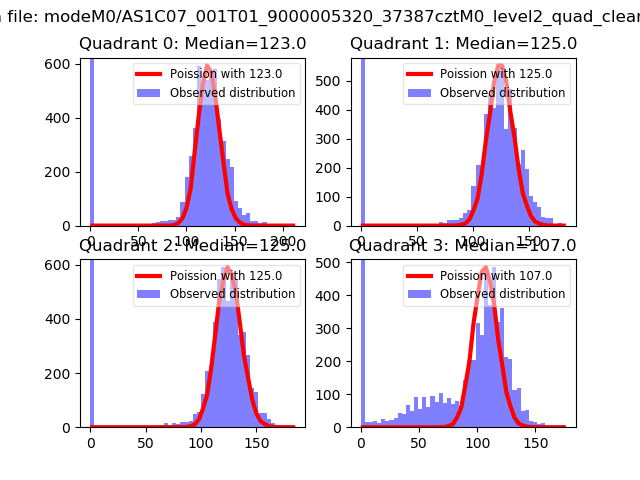
| Comparison with Poisson distribution Blue bars denote a histogram of data divided into 1 sec bins. Red curve is a Poisson curve with rate = median count rate of data. |
 |
 |
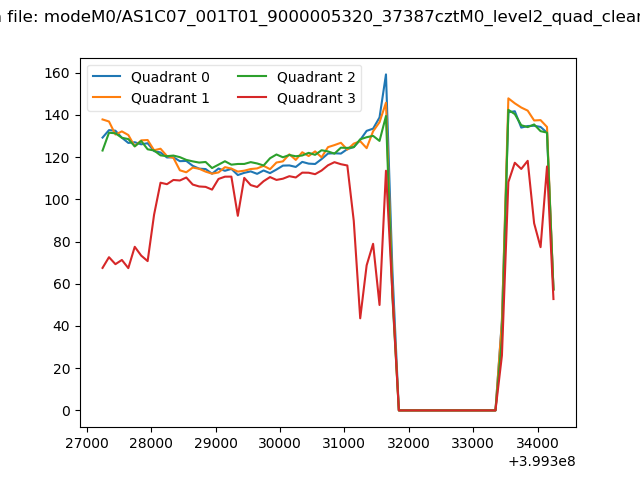
| Quadrant-wise count rates Data is divided into 100 sec bins |
 |
|
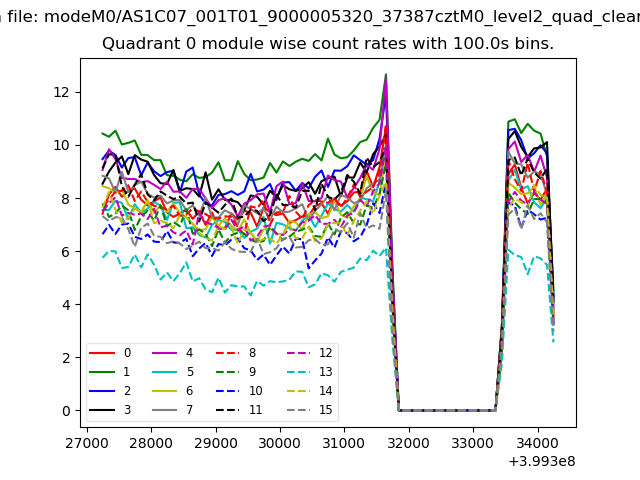
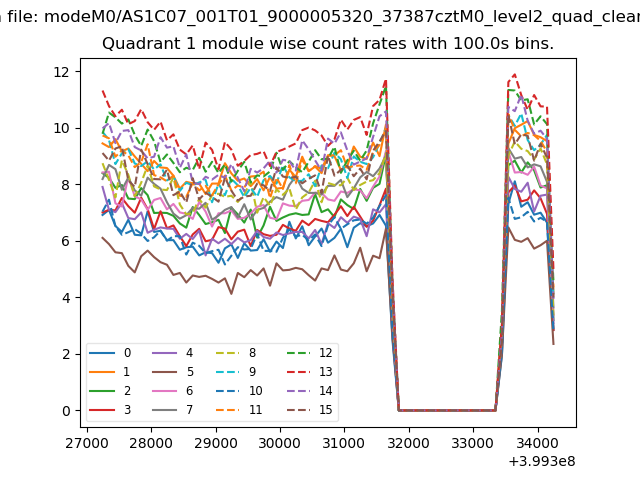
| Module-wise count rates for Quadrant A Data is divided into 100 sec bins |
 |
 |
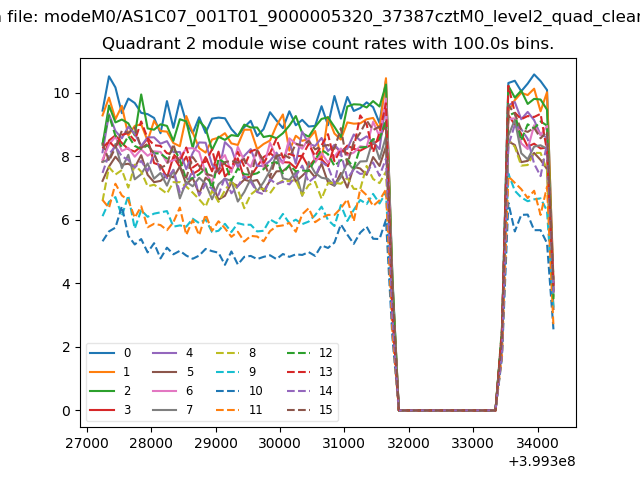
| Module-wise count rates for Quadrant B Data is divided into 100 sec bins |
 |
 |
| Module-wise count rates for Quadrant C Data is divided into 100 sec bins |
 |
 |
| Module-wise count rates for Quadrant D Data is divided into 100 sec bins |
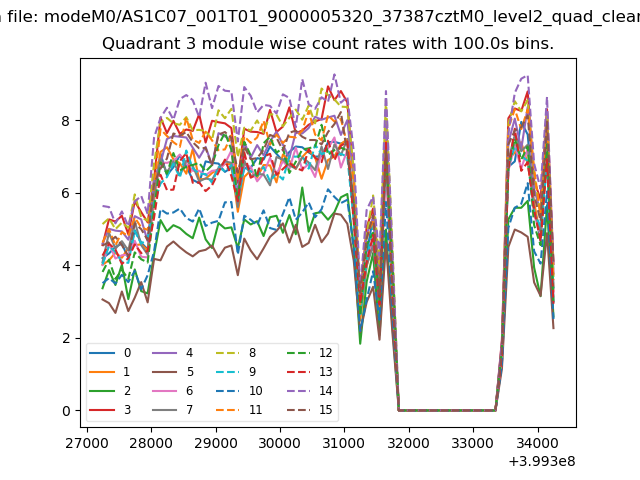 |
 |
| Parameter | Plot |
|---|---|
| CZT HV Monitor | 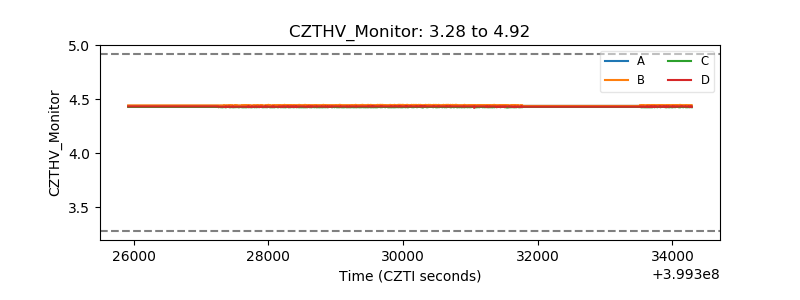 |
| D_VDD | 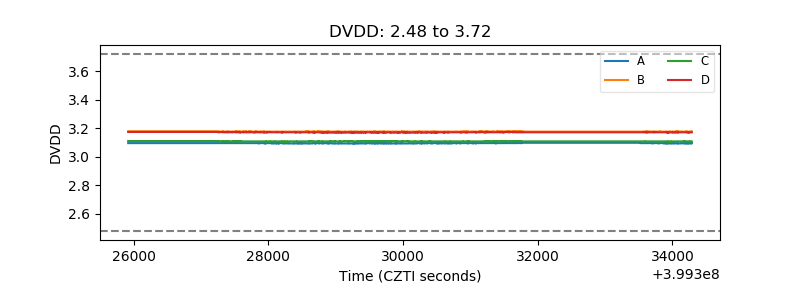 |
| Temperature 1 | 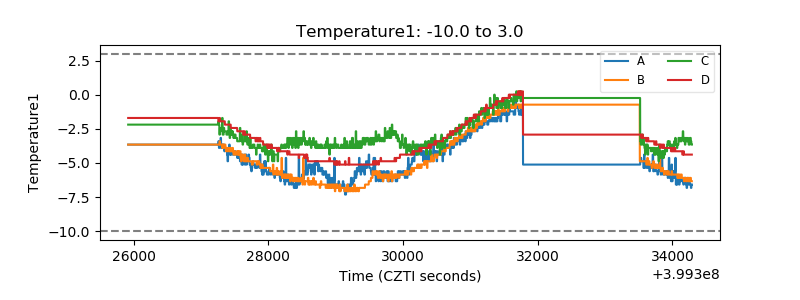 |
| Veto HV Monitor |  |
| Veto LLD | 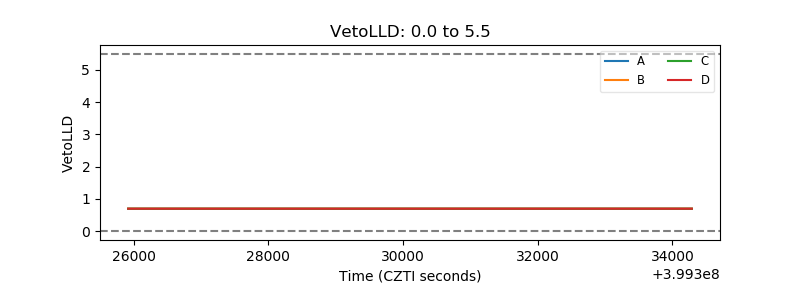 |
| Alpha Counter | 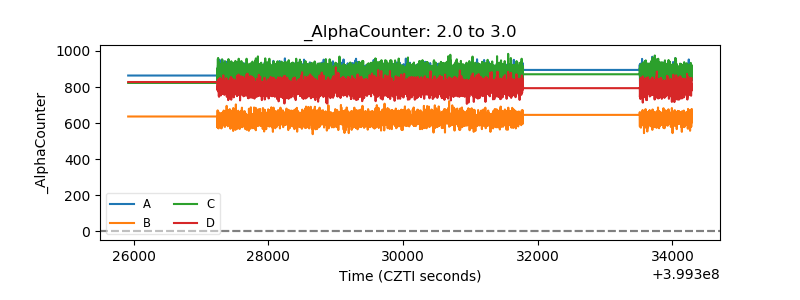 |
| _CPM_Rate | 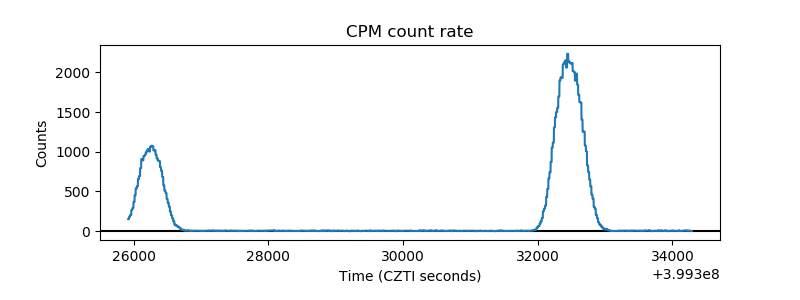 |
| CZT Counter | 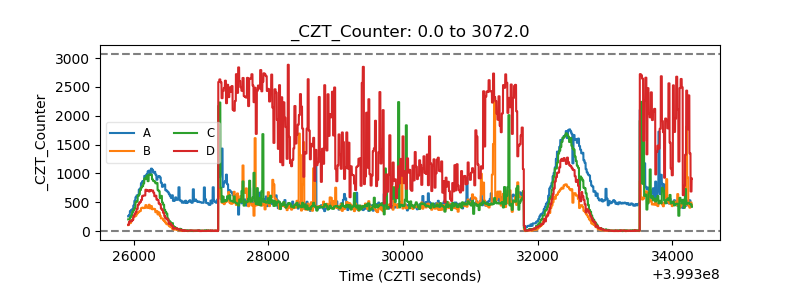 |
| +2.5 Volts monitor | 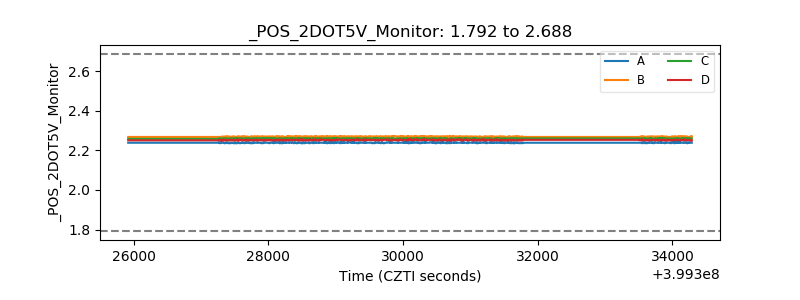 |
| +5 Volts monitor | 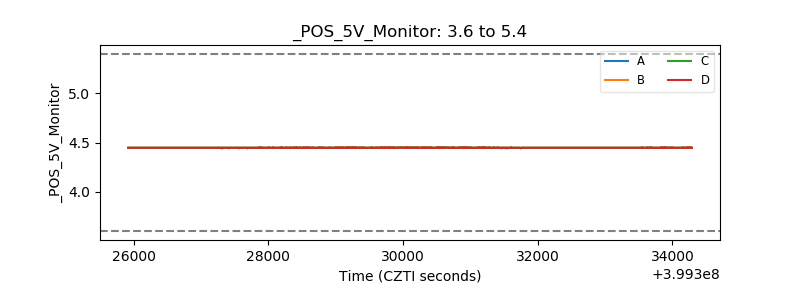 |
| _ROLL_ROT | 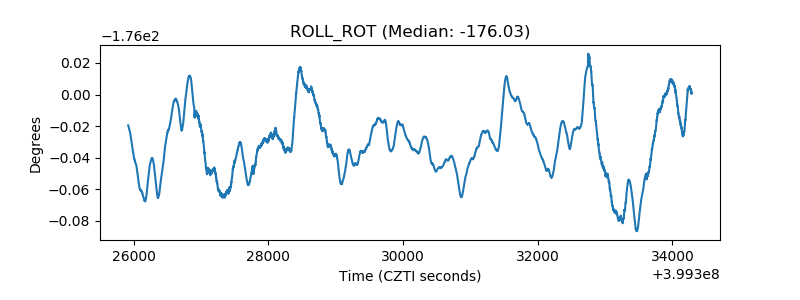 |
| _Roll_DEC | 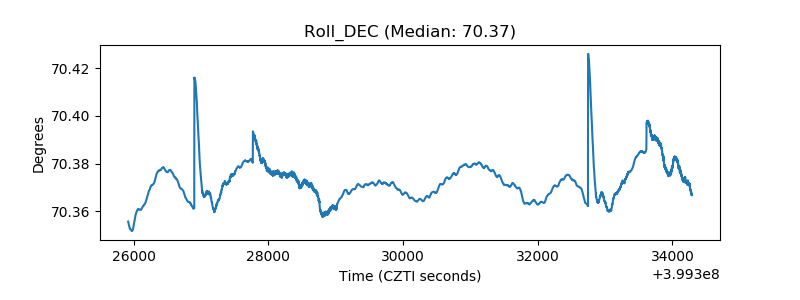 |
| _Roll_RA | 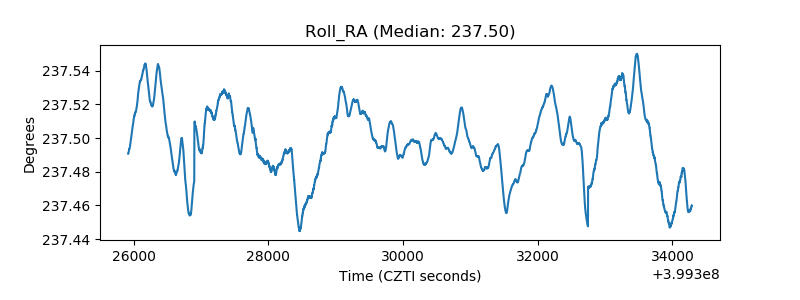 |
| Veto Counter | 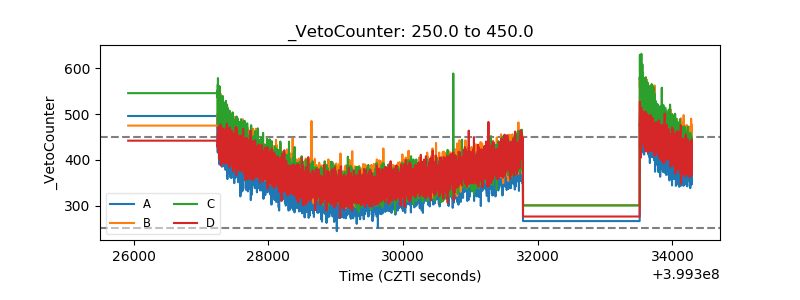 |