| Param | Original file | Final file |
|---|---|---|
| Filename | modeM0/AS1C07_001T01_9000005320_37389cztM0_level2.evt | modeM0/AS1C07_001T01_9000005320_37389cztM0_level2_quad_clean.evt |
| Size (bytes) | 950,431,680 | 182,986,560 |
| Size | 906.4 MB | 174.5 MB |
| Events in quadrant A | 4,934,934 | 1,256,981 |
| Events in quadrant B | 5,130,958 | 1,286,748 |
| Events in quadrant C | 5,040,751 | 1,267,293 |
| Events in quadrant D | 13,021,928 | 1,057,444 |
| Mode SS | |||
|---|---|---|---|
| Quadrant | BADHDUFLAG | Total packets | Discarded packets |
| A | 0 | 198 | 0 |
| B | 0 | 198 | 0 |
| C | 0 | 198 | 0 |
| D | 0 | 198 | 0 |
| Mode M0 | |||
|---|---|---|---|
| Quadrant | BADHDUFLAG | Total packets | Discarded packets |
| A | 0 | 20918 | 4 |
| B | 0 | 21604 | 3 |
| C | 0 | 21003 | 3 |
| D | 0 | 45512 | 3 |
| Mode M9 | |||
|---|---|---|---|
| Quadrant | BADHDUFLAG | Total packets | Discarded packets |
| A | 0 | 49 | 0 |
| B | 0 | 49 | 0 |
| C | 0 | 49 | 0 |
| D | 0 | 50 | 0 |
| Quadrant | Total seconds | Saturated seconds | Saturation percentage |
|---|---|---|---|
| A | 9714 | 37 | 0.380894% |
| B | 9714 | 66 | 0.679432% |
| C | 9714 | 85 | 0.875026% |
| D | 9714 | 2252 | 23.183035% |
Noise dominated data is calculated using 1-second bins in cleaned event files. If a bin has >2000 counts, and if more than 50% of those come from <1% of pixels, then it is considered to be noise-dominated and hence unusable.
| Quadrant | # 1 sec bins | Bins with >0 counts | Bins with >2000 counts | High rate bins dominated by noise | Noise dominated (total time) | Noise dominated (detector-on time) | Marked lightcurve |
|---|---|---|---|---|---|---|---|
| A | 13572 | 9716 | 30 | 30 | 0.22% | 0.31% | 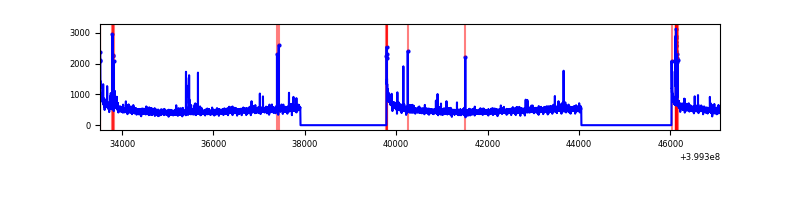 |
| B | 13572 | 9716 | 29 | 29 | 0.21% | 0.30% | 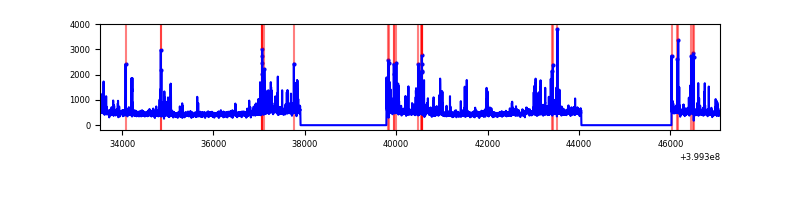 |
| C | 13572 | 9716 | 53 | 53 | 0.39% | 0.55% | 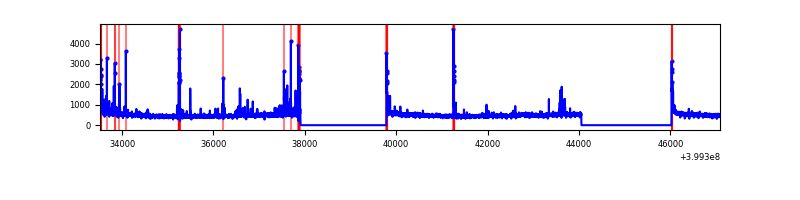 |
| D | 13572 | 9716 | 1868 | 1868 | 13.76% | 19.23% | 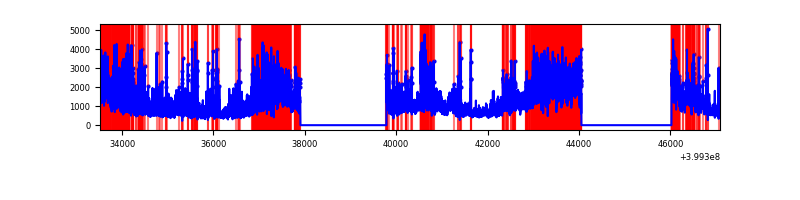 |
Top three noisy pixels from each quadrant. If the there are fewer than three noisy pixels in the level2.evt file, extra rows are filled as -1
| Pixel properties | Quadrant properties | ||||||
|---|---|---|---|---|---|---|---|
| Quadrant | DetID | PixID | Counts | Sigma | Mean | Median | Sigma |
| A | 10 | 83 | 469235 | 2132.48 | 1099 | 1080 | 219.5 |
| A | 13 | 248 | 56923 | 254.37 | 1099 | 1080 | 219.5 |
| A | 15 | 174 | 52020 | 232.04 | 1099 | 1080 | 219.5 |
| B | 5 | 172 | 168450 | 808.11 | 1104 | 1077 | 207.1 |
| B | 5 | 200 | 92896 | 443.32 | 1104 | 1077 | 207.1 |
| B | 0 | 190 | 81060 | 386.17 | 1104 | 1077 | 207.1 |
| C | 15 | 214 | 410550 | 1657.62 | 1074 | 1080 | 247.0 |
| C | 14 | 254 | 229807 | 925.93 | 1074 | 1080 | 247.0 |
| C | 0 | 10 | 119117 | 477.84 | 1074 | 1080 | 247.0 |
| D | 12 | 235 | 5434935 | 23452.5 | 962 | 936 | 231.7 |
| D | 1 | 47 | 1561566 | 6735.49 | 962 | 936 | 231.7 |
| D | 12 | 227 | 765187 | 3298.42 | 962 | 936 | 231.7 |
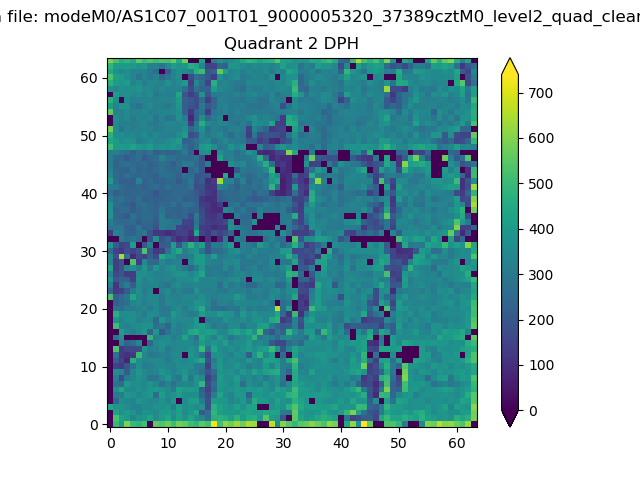
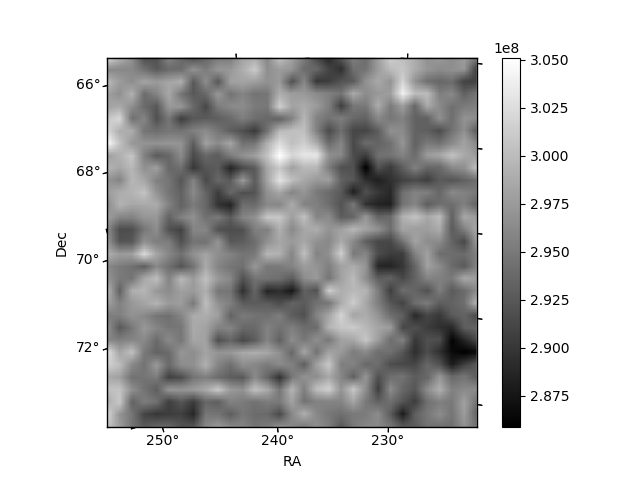
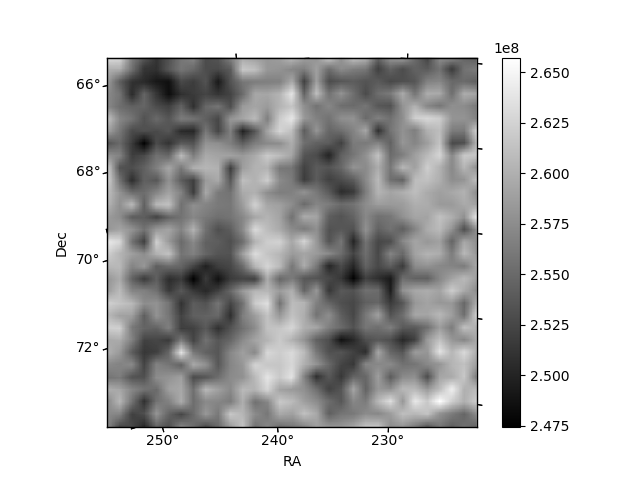
Histogram calculated using DETX and DETY for each event in the final _common_clean file
| Quadrant A | 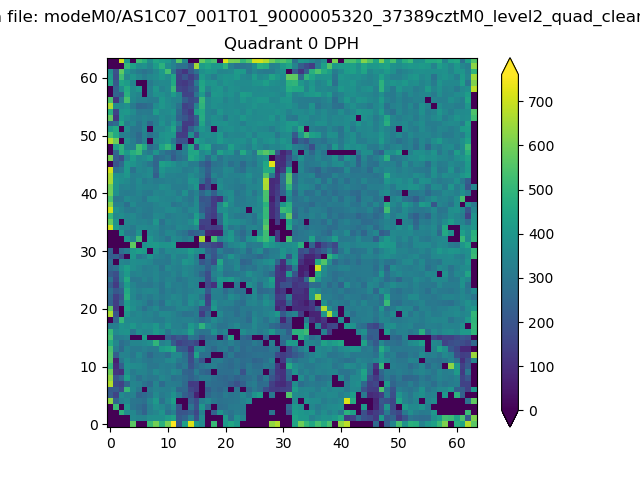 |
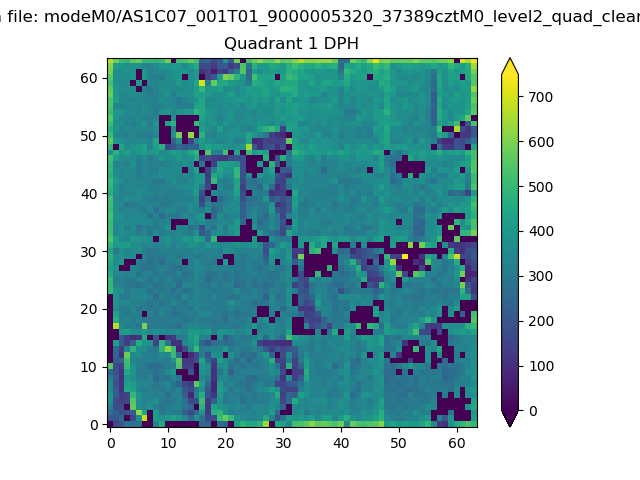 |
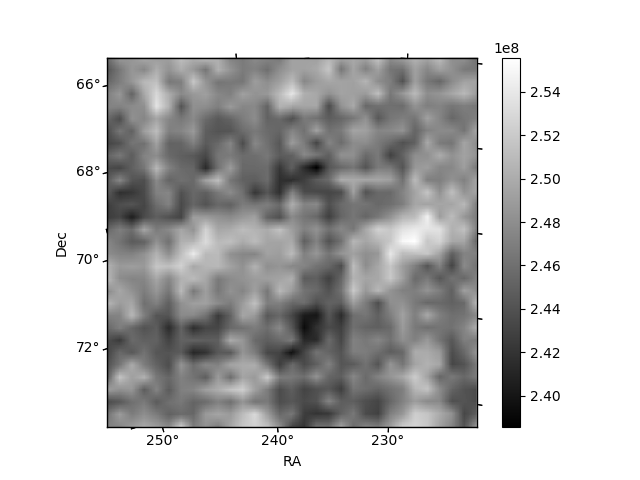
Quadrant B |
|---|---|---|---|
| Quadrant D | 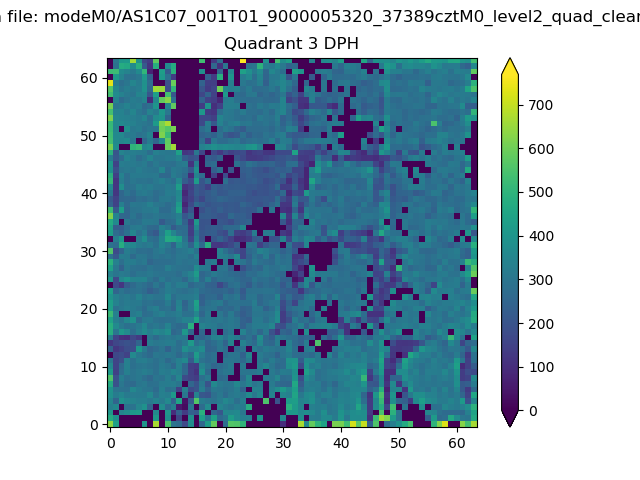 |
 |
Quadrant C |
| Plot type | Count rate plots | Images |
|---|---|---|
| Comparison with Poisson distribution Blue bars denote a histogram of data divided into 1 sec bins. Red curve is a Poisson curve with rate = median count rate of data. |
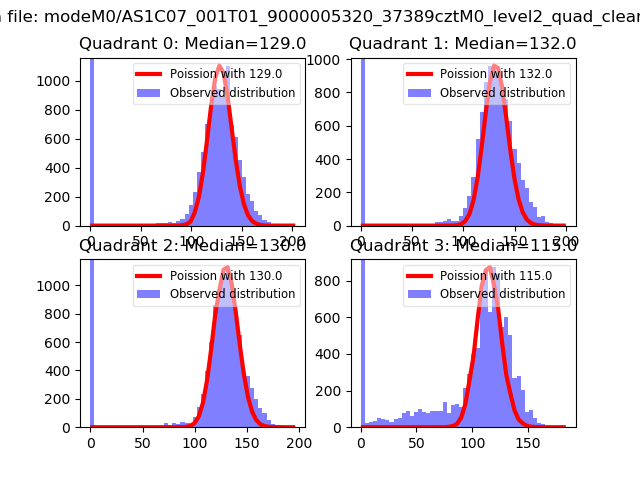 |
 |
| Quadrant-wise count rates Data is divided into 100 sec bins |
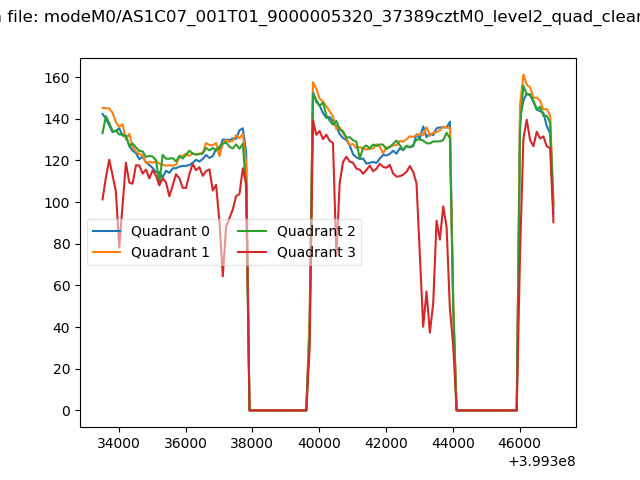 |
|
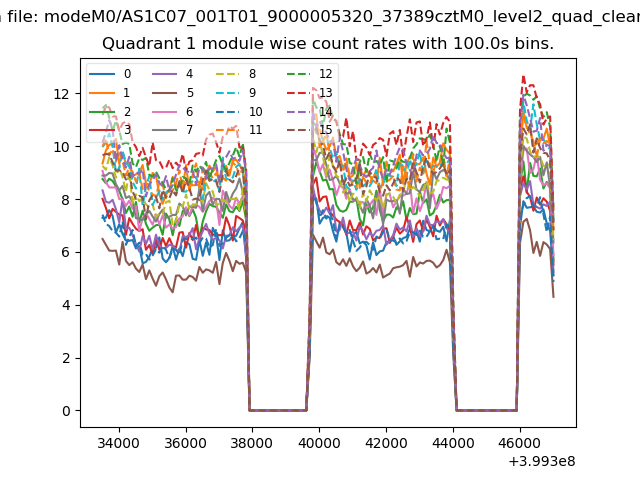
| Module-wise count rates for Quadrant A Data is divided into 100 sec bins |
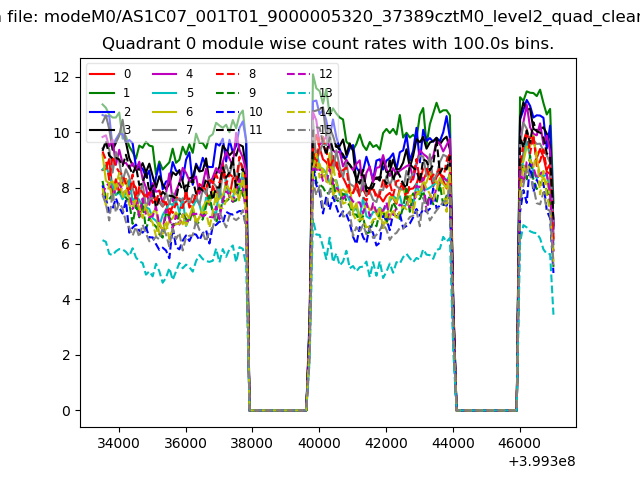 |
 |
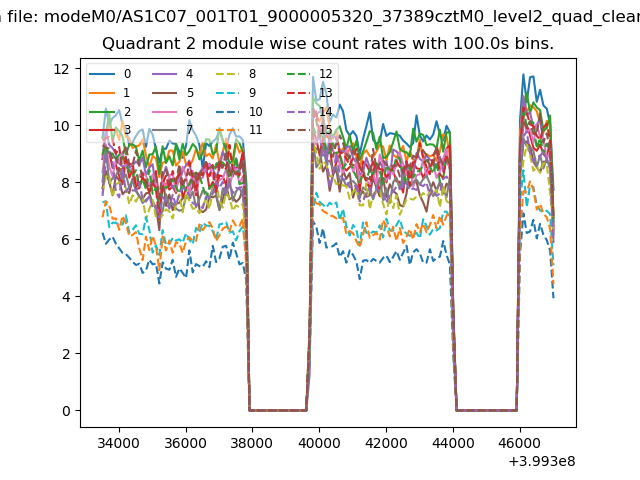
| Module-wise count rates for Quadrant B Data is divided into 100 sec bins |
 |
 |
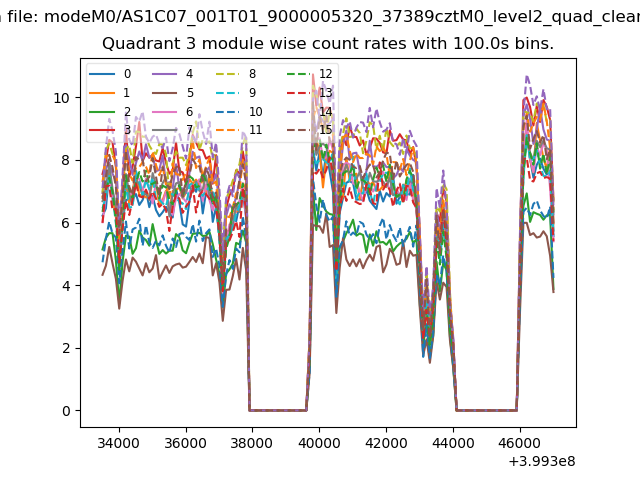
| Module-wise count rates for Quadrant C Data is divided into 100 sec bins |
 |
 |
| Module-wise count rates for Quadrant D Data is divided into 100 sec bins |
 |
 |
| Parameter | Plot |
|---|---|
| CZT HV Monitor | 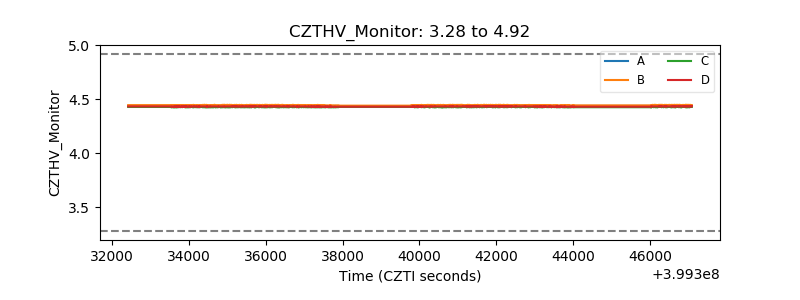 |
| D_VDD | 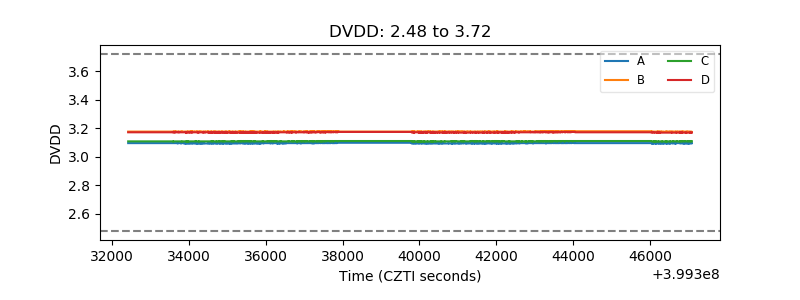 |
| Temperature 1 | 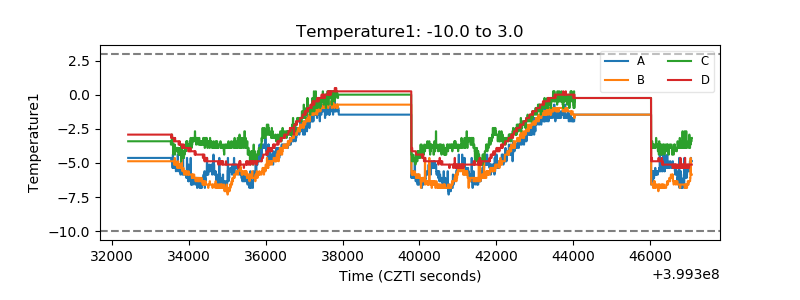 |
| Veto HV Monitor |  |
| Veto LLD | 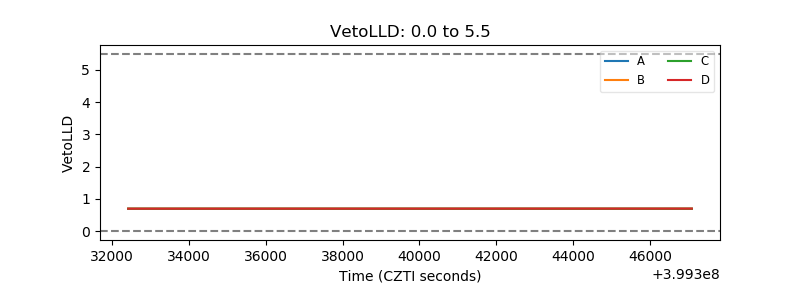 |
| Alpha Counter | 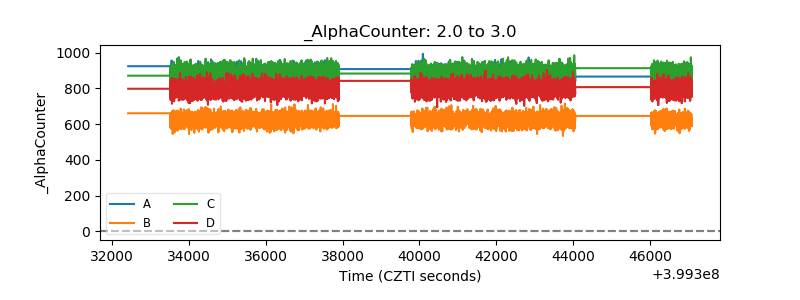 |
| _CPM_Rate | 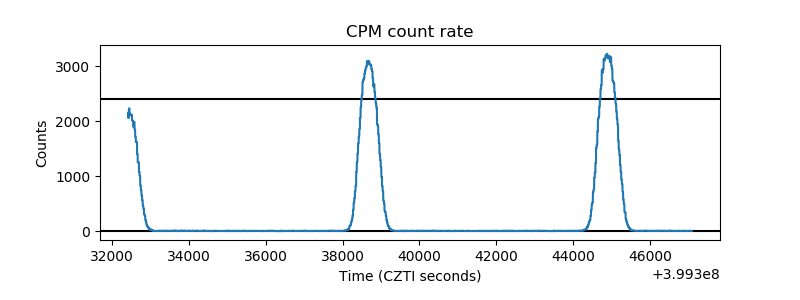 |
| CZT Counter | 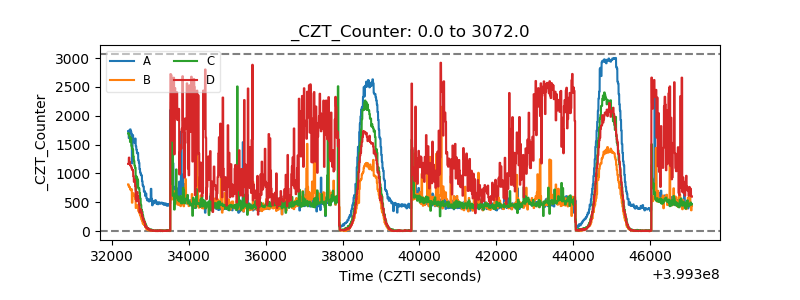 |
| +2.5 Volts monitor | 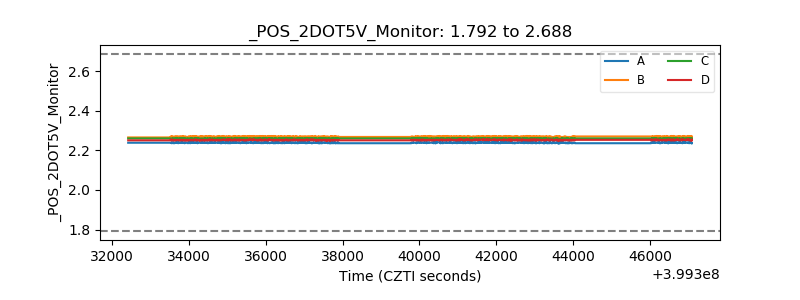 |
| +5 Volts monitor | 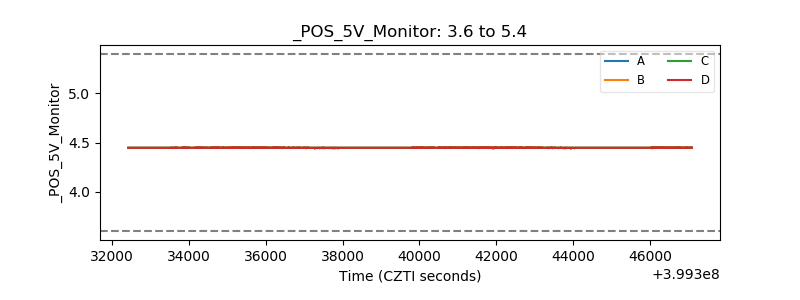 |
| _ROLL_ROT | 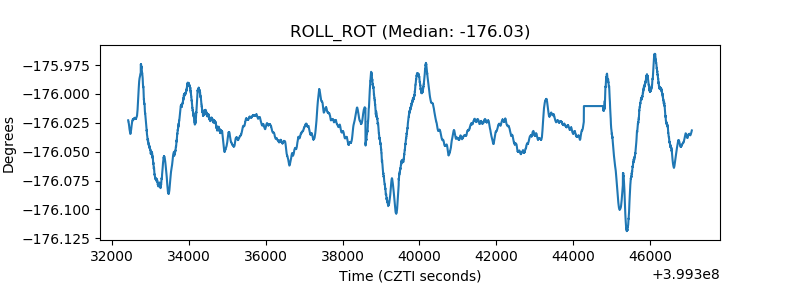 |
| _Roll_DEC | 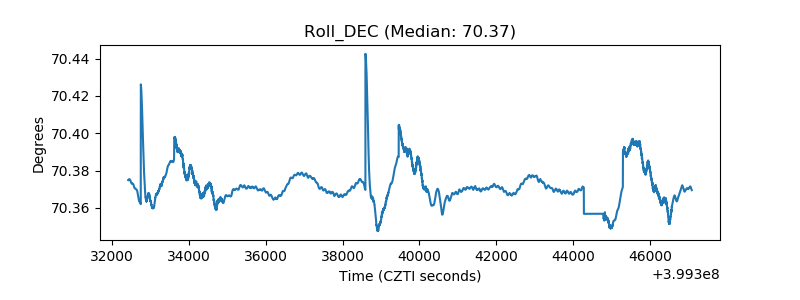 |
| _Roll_RA |  |
| Veto Counter | 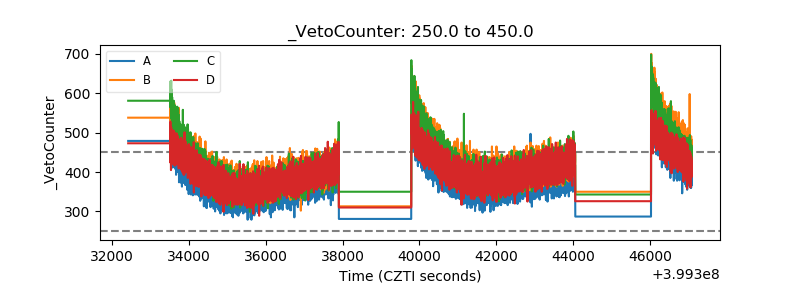 |