| Param | Original file | Final file |
|---|---|---|
| Filename | modeM0/AS1C07_001T01_9000005320_37391cztM0_level2.evt | modeM0/AS1C07_001T01_9000005320_37391cztM0_level2_quad_clean.evt |
| Size (bytes) | 579,490,560 | 95,529,600 |
| Size | 552.6 MB | 91.1 MB |
| Events in quadrant A | 2,632,751 | 680,124 |
| Events in quadrant B | 2,551,402 | 692,122 |
| Events in quadrant C | 3,932,396 | 647,155 |
| Events in quadrant D | 8,095,780 | 522,869 |
| Mode SS | |||
|---|---|---|---|
| Quadrant | BADHDUFLAG | Total packets | Discarded packets |
| A | 0 | 102 | 0 |
| B | 0 | 102 | 0 |
| C | 0 | 102 | 0 |
| D | 0 | 102 | 0 |
| Mode M0 | |||
|---|---|---|---|
| Quadrant | BADHDUFLAG | Total packets | Discarded packets |
| A | 0 | 10770 | 3 |
| B | 0 | 10631 | 2 |
| C | 0 | 14786 | 2 |
| D | 0 | 27540 | 2 |
| Mode M9 | |||
|---|---|---|---|
| Quadrant | BADHDUFLAG | Total packets | Discarded packets |
| A | 0 | 31 | 0 |
| B | 0 | 31 | 0 |
| C | 0 | 31 | 0 |
| D | 0 | 32 | 0 |
| Quadrant | Total seconds | Saturated seconds | Saturation percentage |
|---|---|---|---|
| A | 4988 | 14 | 0.280674% |
| B | 4988 | 26 | 0.521251% |
| C | 4988 | 319 | 6.395349% |
| D | 4988 | 1867 | 37.429832% |
Noise dominated data is calculated using 1-second bins in cleaned event files. If a bin has >2000 counts, and if more than 50% of those come from <1% of pixels, then it is considered to be noise-dominated and hence unusable.
| Quadrant | # 1 sec bins | Bins with >0 counts | Bins with >2000 counts | High rate bins dominated by noise | Noise dominated (total time) | Noise dominated (detector-on time) | Marked lightcurve |
|---|---|---|---|---|---|---|---|
| A | 7141 | 4989 | 5 | 5 | 0.07% | 0.10% | 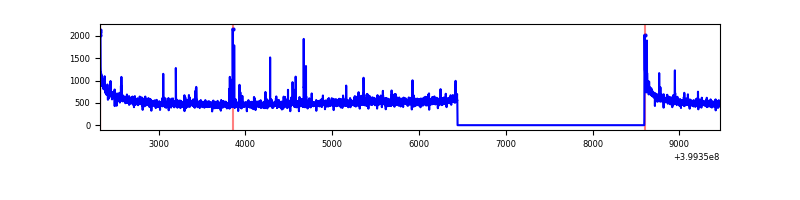 |
| B | 7141 | 4989 | 16 | 16 | 0.22% | 0.32% | 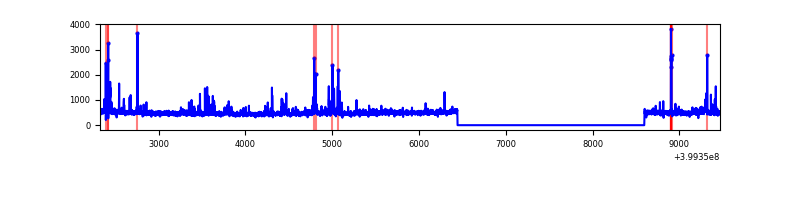 |
| C | 7141 | 4989 | 299 | 299 | 4.19% | 5.99% | 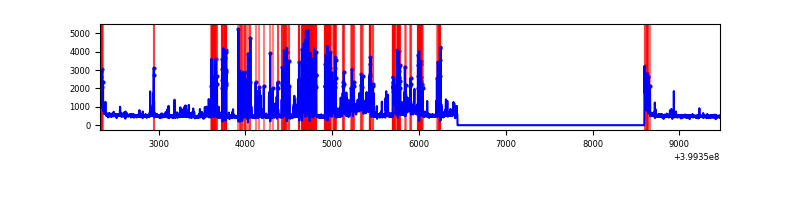 |
| D | 7141 | 4989 | 1615 | 1615 | 22.62% | 32.37% | 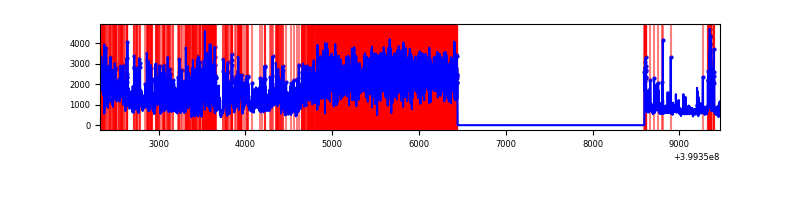 |
Top three noisy pixels from each quadrant. If the there are fewer than three noisy pixels in the level2.evt file, extra rows are filled as -1
| Pixel properties | Quadrant properties | ||||||
|---|---|---|---|---|---|---|---|
| Quadrant | DetID | PixID | Counts | Sigma | Mean | Median | Sigma |
| A | 10 | 83 | 276070 | 2350.12 | 586 | 575 | 117.2 |
| A | 9 | 143 | 34446 | 288.94 | 586 | 575 | 117.2 |
| A | 12 | 227 | 15789 | 129.78 | 586 | 575 | 117.2 |
| B | 5 | 172 | 85224 | 774.88 | 581 | 567 | 109.3 |
| B | 4 | 232 | 39581 | 357.1 | 581 | 567 | 109.3 |
| B | 4 | 171 | 29765 | 267.26 | 581 | 567 | 109.3 |
| C | 1 | 23 | 1421271 | 11272.58 | 546 | 549 | 126.0 |
| C | 15 | 214 | 211768 | 1675.9 | 546 | 549 | 126.0 |
| C | 0 | 10 | 91214 | 719.37 | 546 | 549 | 126.0 |
| D | 12 | 235 | 3394328 | 29282.51 | 481 | 467 | 115.9 |
| D | 12 | 227 | 1684331 | 14528.52 | 481 | 467 | 115.9 |
| D | 2 | 249 | 476360 | 4106.04 | 481 | 467 | 115.9 |
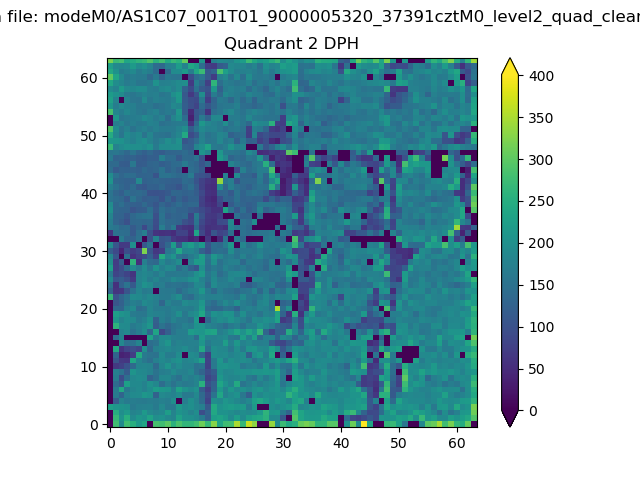
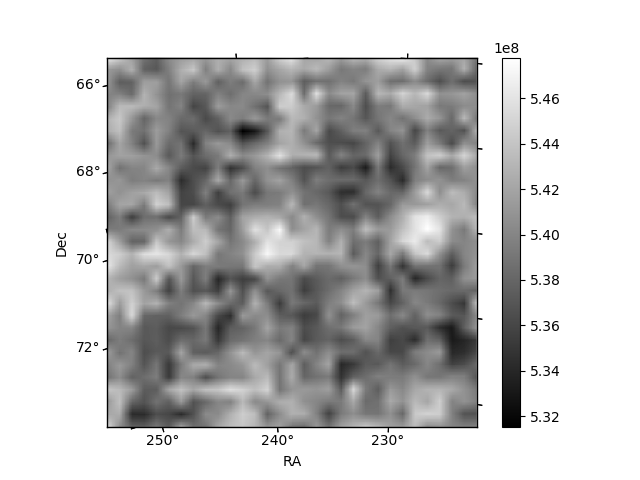
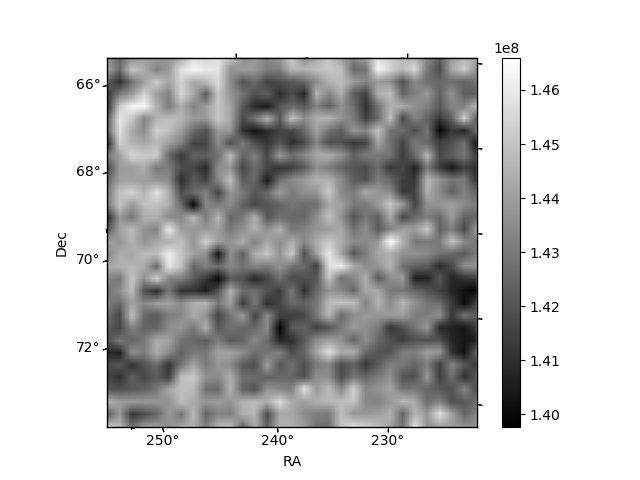
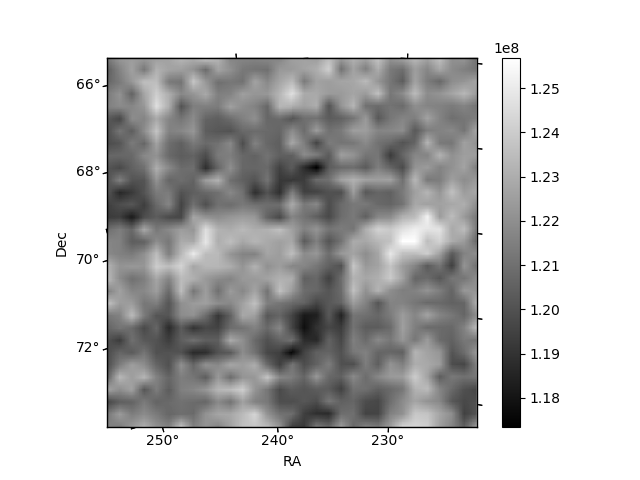
Histogram calculated using DETX and DETY for each event in the final _common_clean file
| Quadrant A | 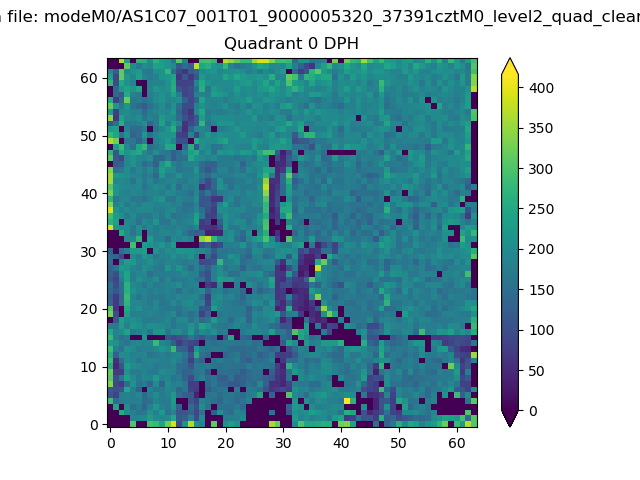 |
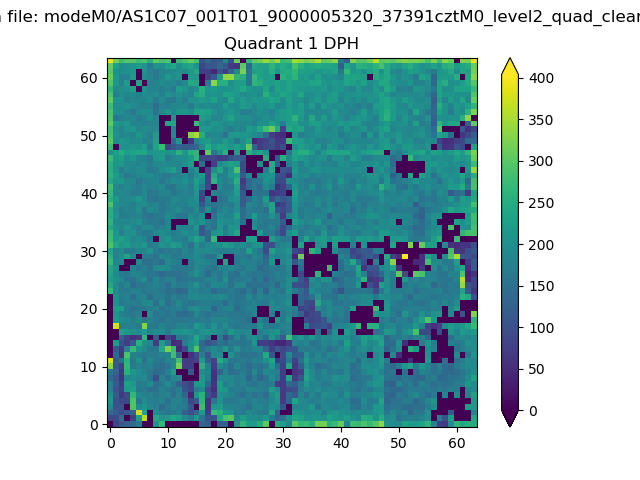 |
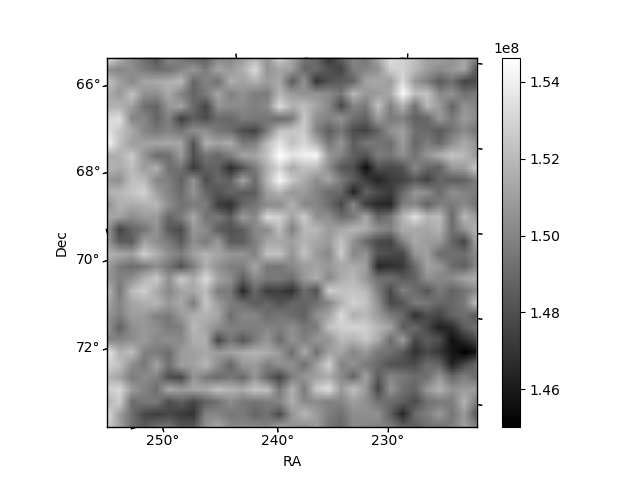
Quadrant B |
|---|---|---|---|
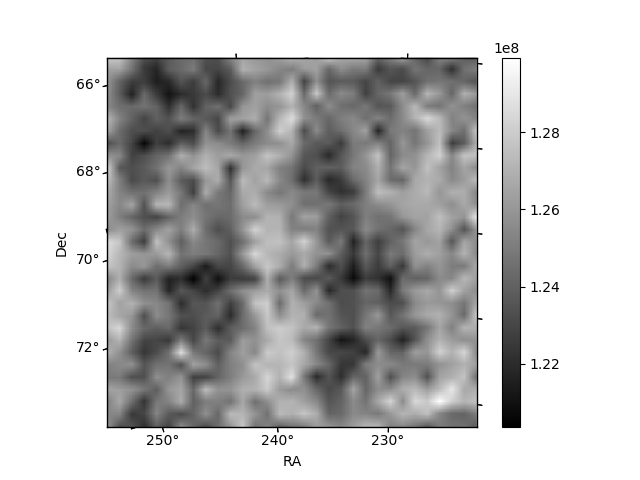
| Quadrant D | 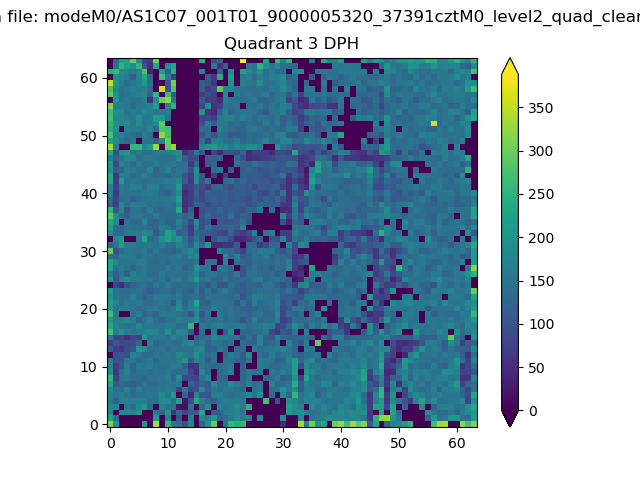 |
 |
Quadrant C |
| Plot type | Count rate plots | Images |
|---|---|---|
| Comparison with Poisson distribution Blue bars denote a histogram of data divided into 1 sec bins. Red curve is a Poisson curve with rate = median count rate of data. |
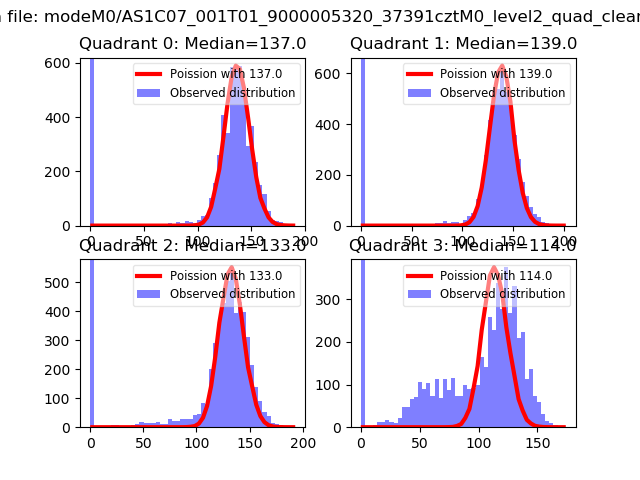 |
 |
| Quadrant-wise count rates Data is divided into 100 sec bins |
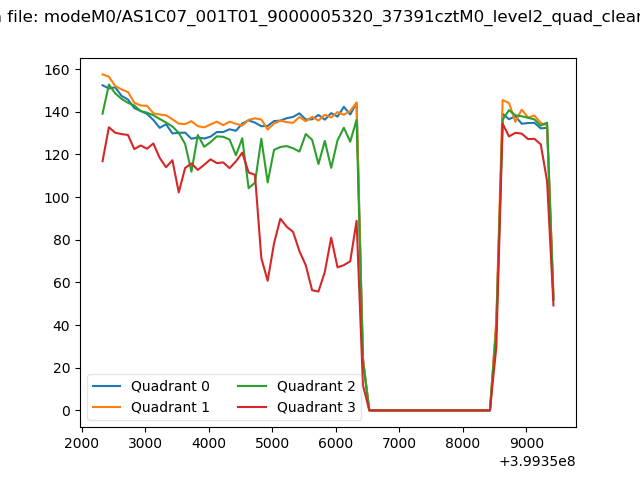 |
|
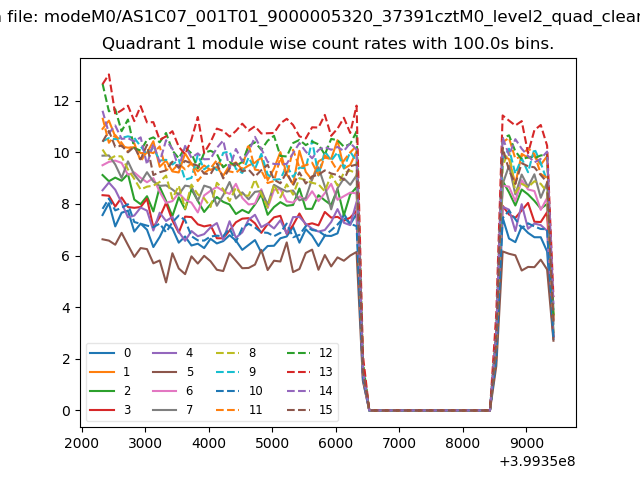
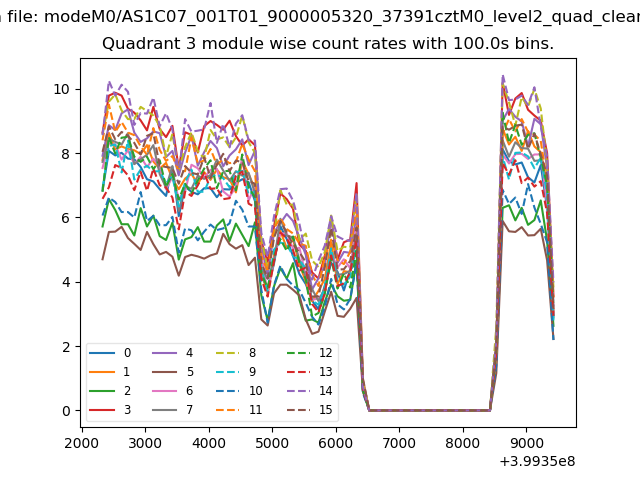
| Module-wise count rates for Quadrant A Data is divided into 100 sec bins |
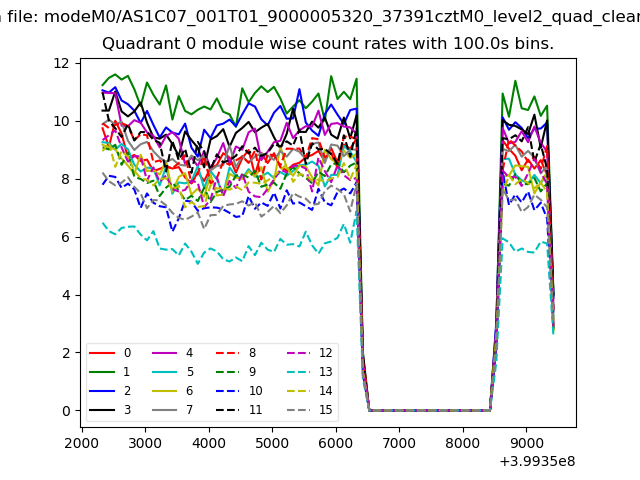 |
 |
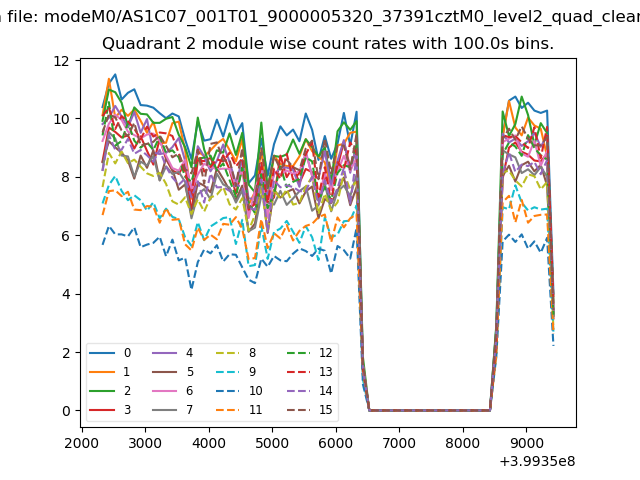
| Module-wise count rates for Quadrant B Data is divided into 100 sec bins |
 |
 |
| Module-wise count rates for Quadrant C Data is divided into 100 sec bins |
 |
 |
| Module-wise count rates for Quadrant D Data is divided into 100 sec bins |
 |
 |
| Parameter | Plot |
|---|---|
| CZT HV Monitor | 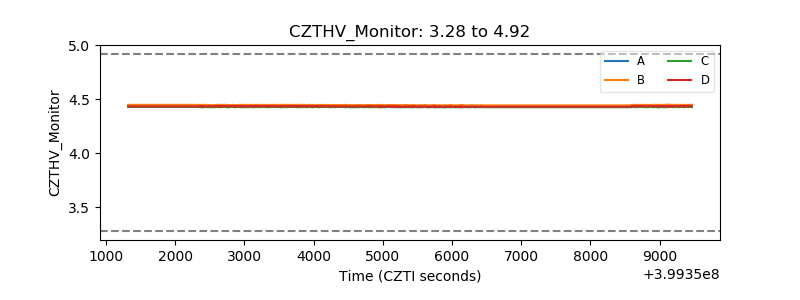 |
| D_VDD | 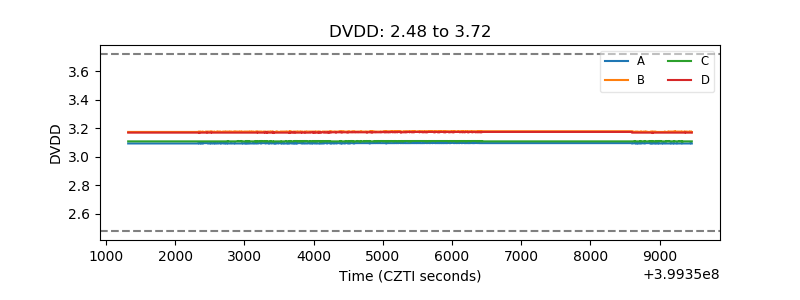 |
| Temperature 1 | 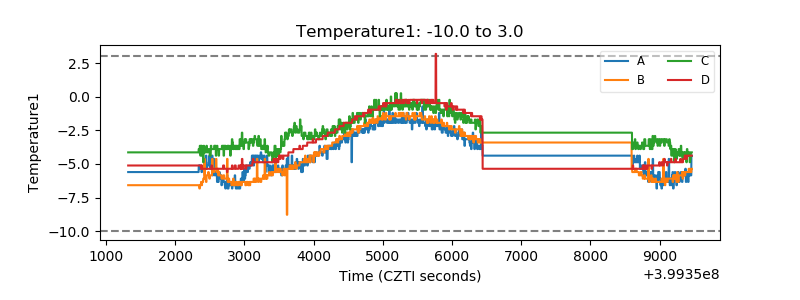 |
| Veto HV Monitor | 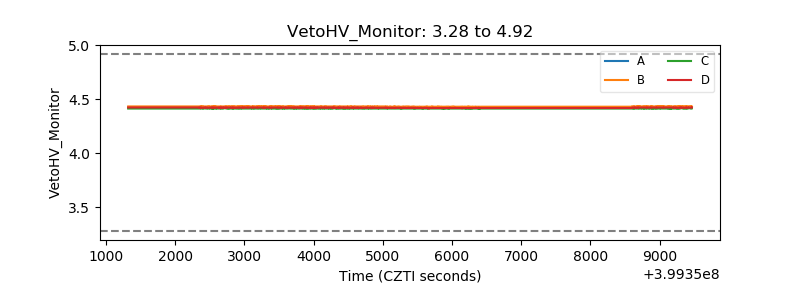 |
| Veto LLD | 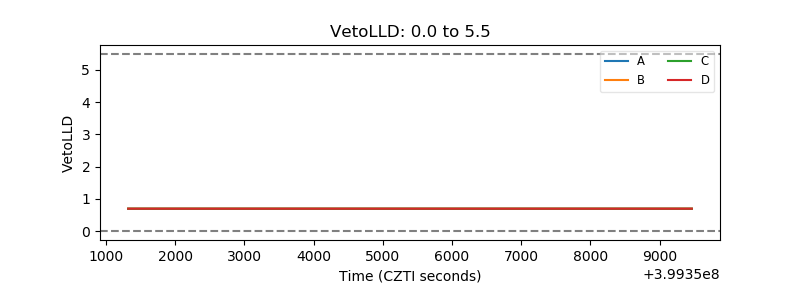 |
| Alpha Counter | 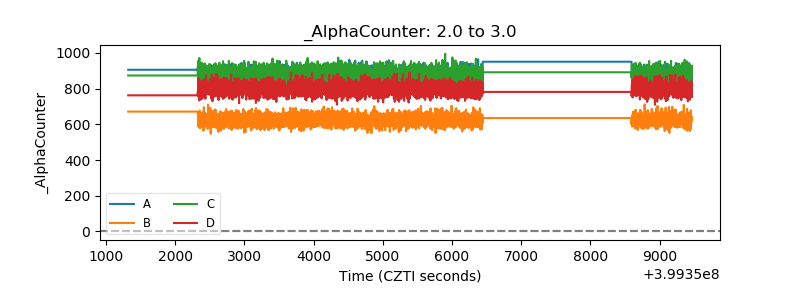 |
| _CPM_Rate | 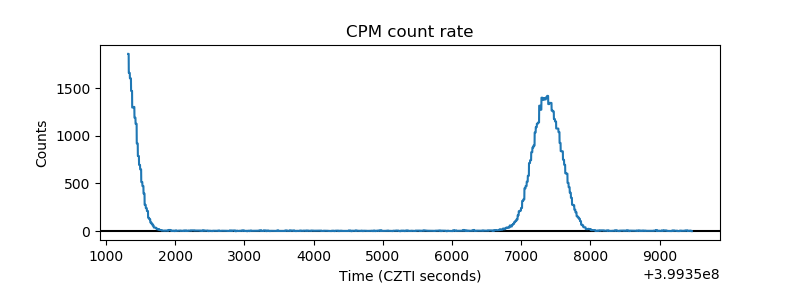 |
| CZT Counter | 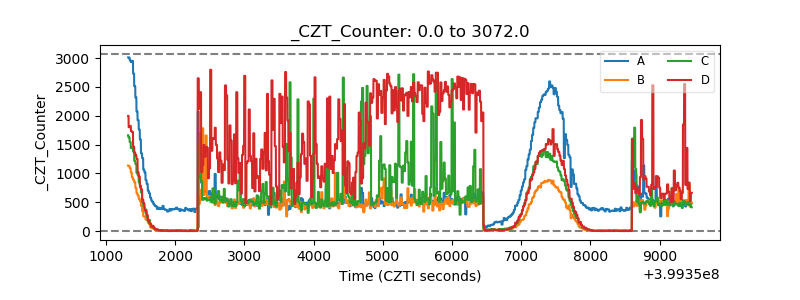 |
| +2.5 Volts monitor | 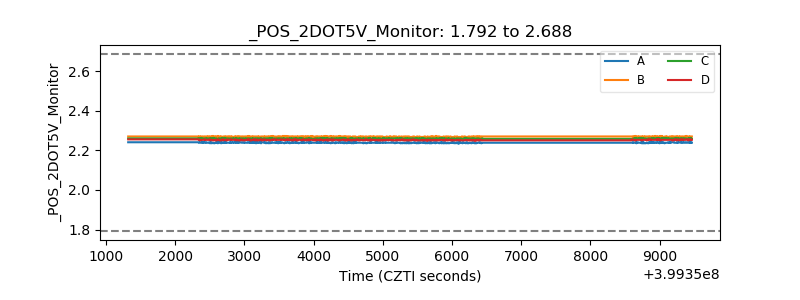 |
| +5 Volts monitor | 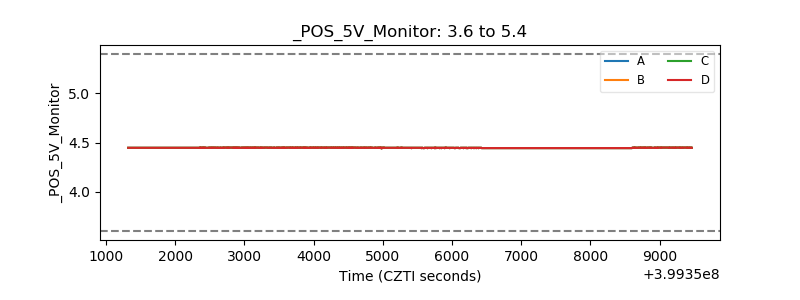 |
| _ROLL_ROT | 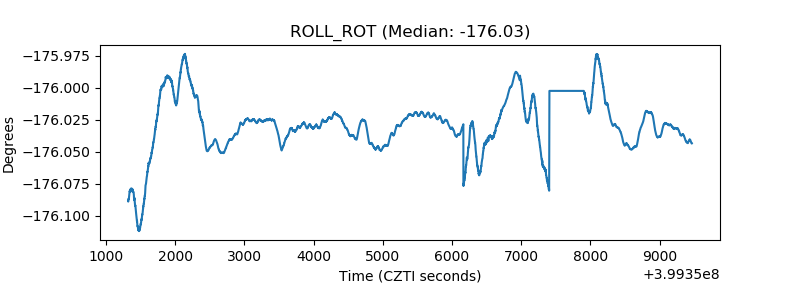 |
| _Roll_DEC | 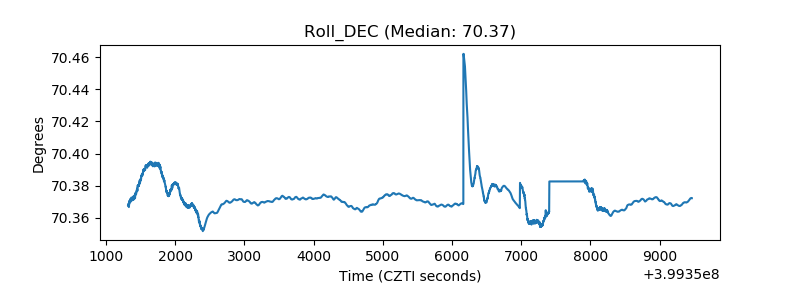 |
| _Roll_RA | 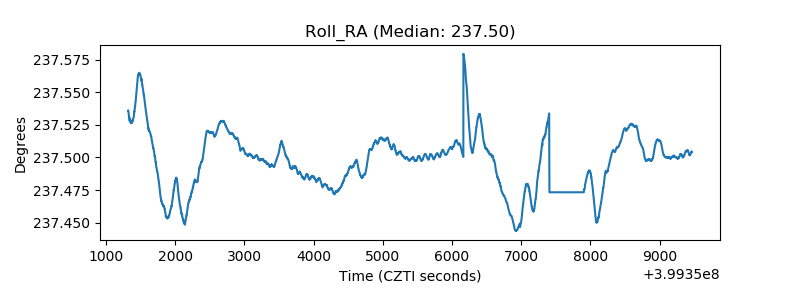 |
| Veto Counter | 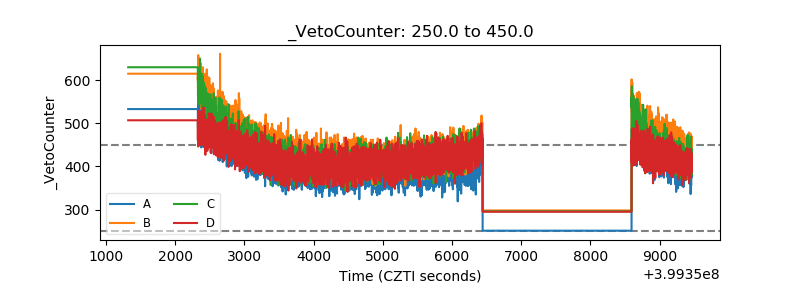 |