| Param | Original file | Final file |
|---|---|---|
| Filename | modeM0/AS1C07_001T01_9000005320_37392cztM0_level2.evt | modeM0/AS1C07_001T01_9000005320_37392cztM0_level2_quad_clean.evt |
| Size (bytes) | 433,644,480 | 95,123,520 |
| Size | 413.6 MB | 90.7 MB |
| Events in quadrant A | 2,569,040 | 651,354 |
| Events in quadrant B | 2,702,724 | 658,153 |
| Events in quadrant C | 2,469,936 | 639,704 |
| Events in quadrant D | 5,054,382 | 583,396 |
| Mode SS | |||
|---|---|---|---|
| Quadrant | BADHDUFLAG | Total packets | Discarded packets |
| A | 0 | 102 | 0 |
| B | 0 | 102 | 0 |
| C | 0 | 102 | 0 |
| D | 0 | 102 | 0 |
| Mode M0 | |||
|---|---|---|---|
| Quadrant | BADHDUFLAG | Total packets | Discarded packets |
| A | 0 | 10627 | 3 |
| B | 0 | 11159 | 2 |
| C | 0 | 10340 | 2 |
| D | 0 | 18569 | 2 |
| Mode M9 | |||
|---|---|---|---|
| Quadrant | BADHDUFLAG | Total packets | Discarded packets |
| A | 0 | 27 | 0 |
| B | 0 | 27 | 0 |
| C | 0 | 27 | 0 |
| D | 0 | 28 | 0 |
| Quadrant | Total seconds | Saturated seconds | Saturation percentage |
|---|---|---|---|
| A | 4962 | 11 | 0.221685% |
| B | 4962 | 76 | 1.531640% |
| C | 4962 | 17 | 0.342604% |
| D | 4962 | 350 | 7.053607% |
Noise dominated data is calculated using 1-second bins in cleaned event files. If a bin has >2000 counts, and if more than 50% of those come from <1% of pixels, then it is considered to be noise-dominated and hence unusable.
| Quadrant | # 1 sec bins | Bins with >0 counts | Bins with >2000 counts | High rate bins dominated by noise | Noise dominated (total time) | Noise dominated (detector-on time) | Marked lightcurve |
|---|---|---|---|---|---|---|---|
| A | 7055 | 4963 | 8 | 8 | 0.11% | 0.16% | 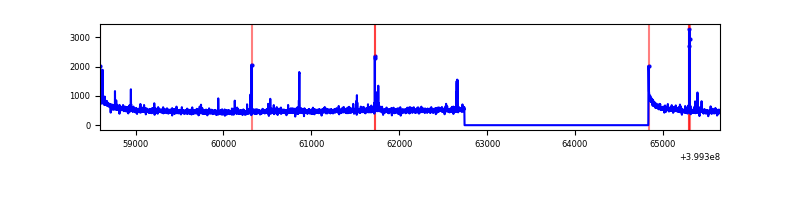 |
| B | 7055 | 4963 | 53 | 53 | 0.75% | 1.07% | 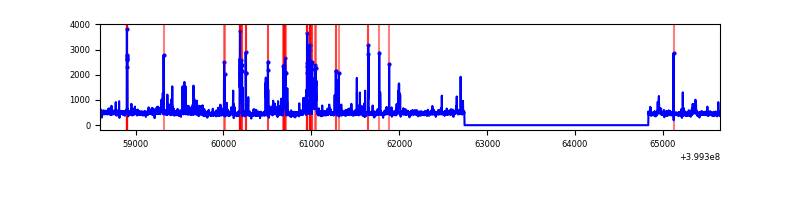 |
| C | 7055 | 4963 | 13 | 13 | 0.18% | 0.26% | 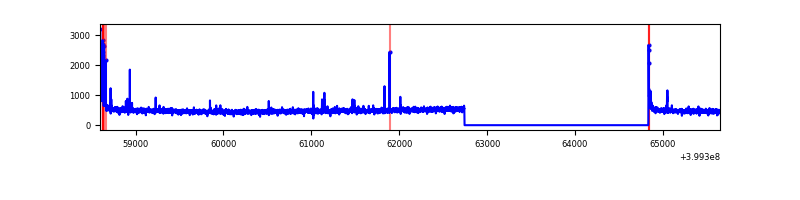 |
| D | 7055 | 4963 | 305 | 305 | 4.32% | 6.15% | 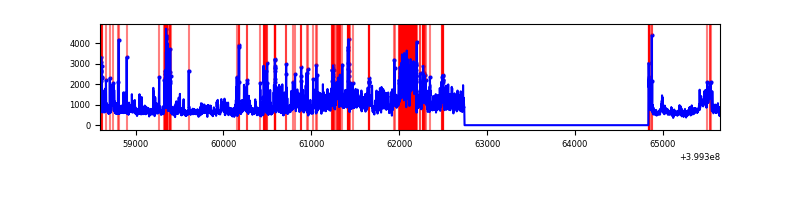 |
Top three noisy pixels from each quadrant. If the there are fewer than three noisy pixels in the level2.evt file, extra rows are filled as -1
| Pixel properties | Quadrant properties | ||||||
|---|---|---|---|---|---|---|---|
| Quadrant | DetID | PixID | Counts | Sigma | Mean | Median | Sigma |
| A | 10 | 83 | 270972 | 2362.54 | 569 | 559 | 114.5 |
| A | 9 | 143 | 35803 | 307.92 | 569 | 559 | 114.5 |
| A | 12 | 227 | 16074 | 135.55 | 569 | 559 | 114.5 |
| B | 5 | 172 | 159113 | 1477.42 | 562 | 548 | 107.3 |
| B | 0 | 190 | 106167 | 984.1 | 562 | 548 | 107.3 |
| B | 4 | 232 | 83493 | 772.83 | 562 | 548 | 107.3 |
| C | 15 | 214 | 215961 | 1727.03 | 543 | 547 | 124.7 |
| C | 0 | 10 | 55062 | 437.06 | 543 | 547 | 124.7 |
| C | 1 | 23 | 45150 | 357.59 | 543 | 547 | 124.7 |
| D | 12 | 235 | 1545809 | 12108.14 | 529 | 513 | 127.6 |
| D | 12 | 227 | 461395 | 3611.23 | 529 | 513 | 127.6 |
| D | 2 | 249 | 433607 | 3393.5 | 529 | 513 | 127.6 |
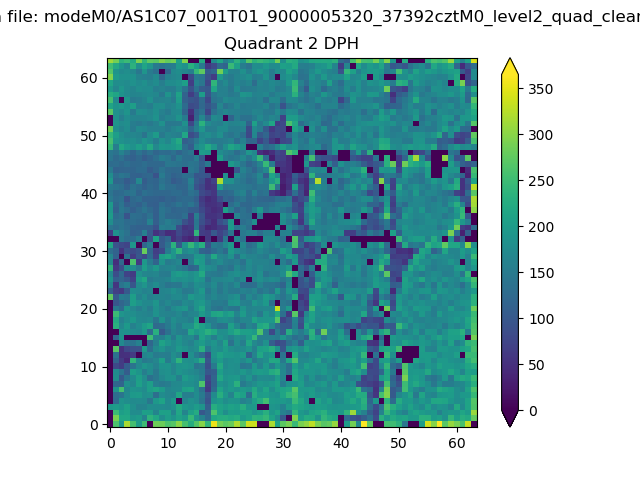
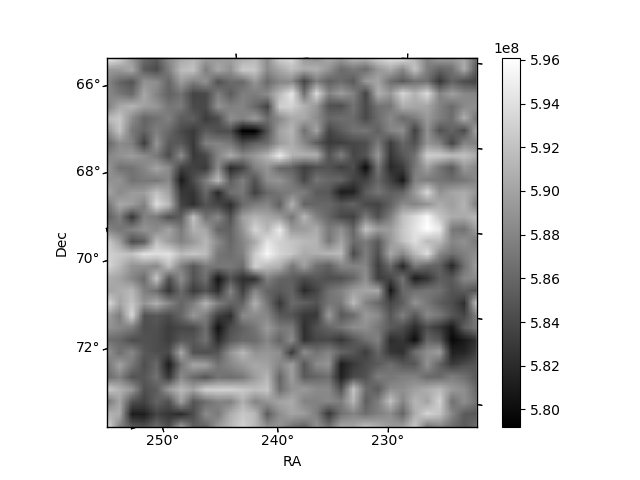
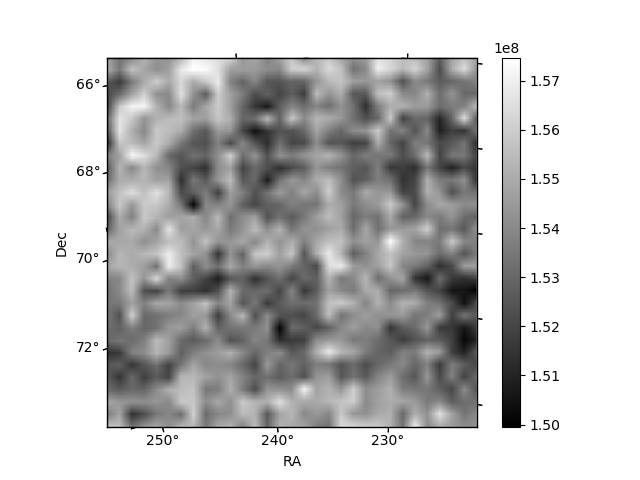
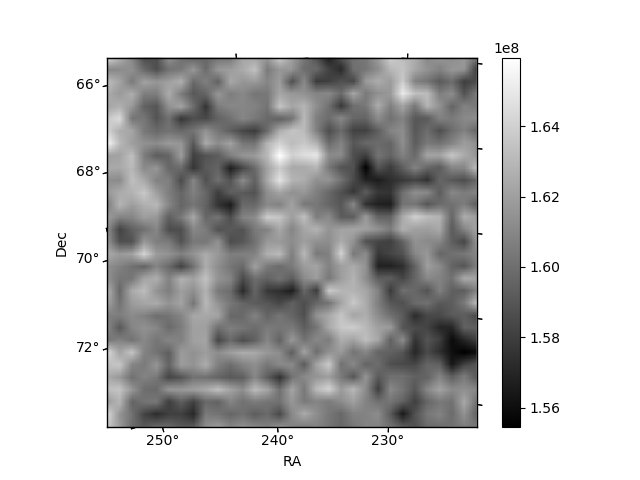
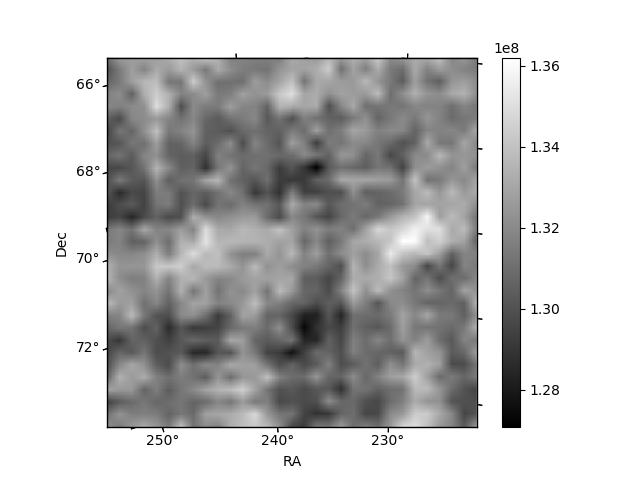
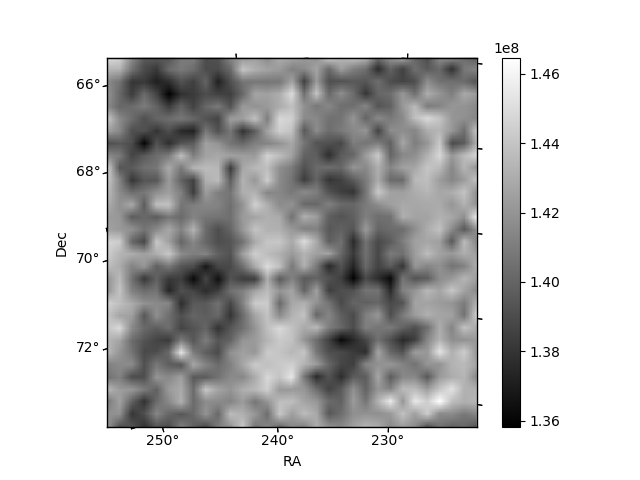
Histogram calculated using DETX and DETY for each event in the final _common_clean file
| Quadrant A | 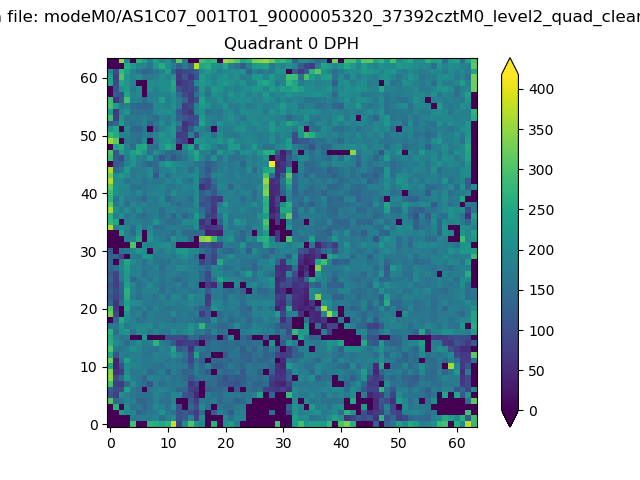 |
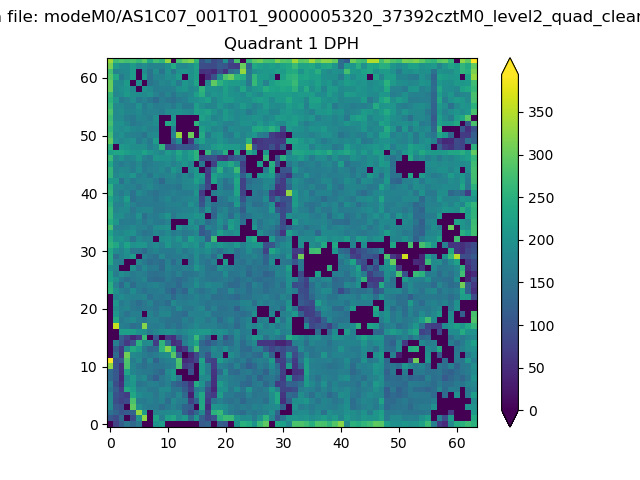 |
Quadrant B |
|---|---|---|---|
| Quadrant D | 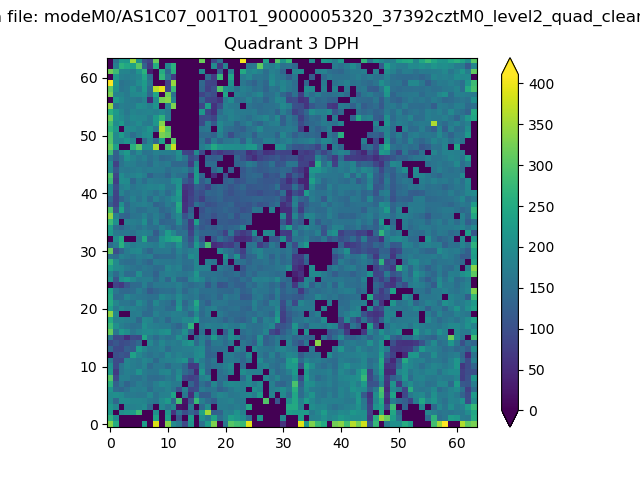 |
 |
Quadrant C |
| Plot type | Count rate plots | Images |
|---|---|---|
| Comparison with Poisson distribution Blue bars denote a histogram of data divided into 1 sec bins. Red curve is a Poisson curve with rate = median count rate of data. |
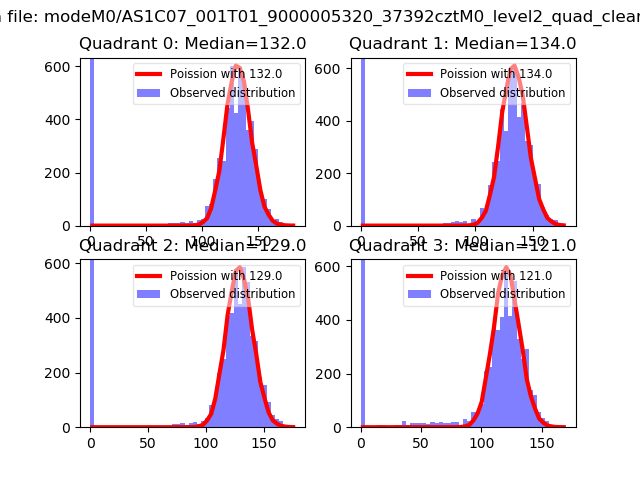 |
 |
| Quadrant-wise count rates Data is divided into 100 sec bins |
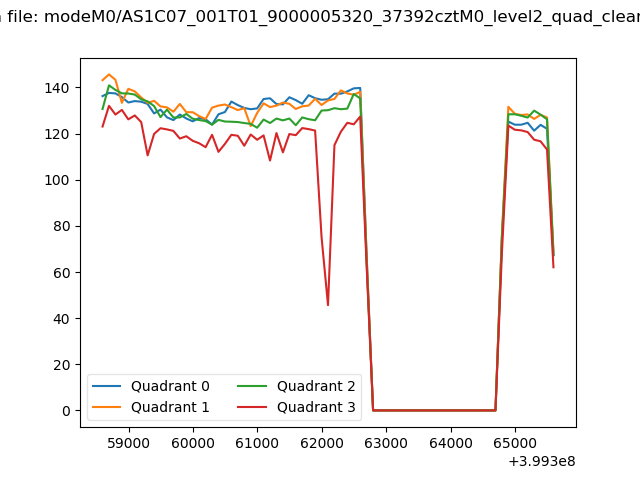 |
|
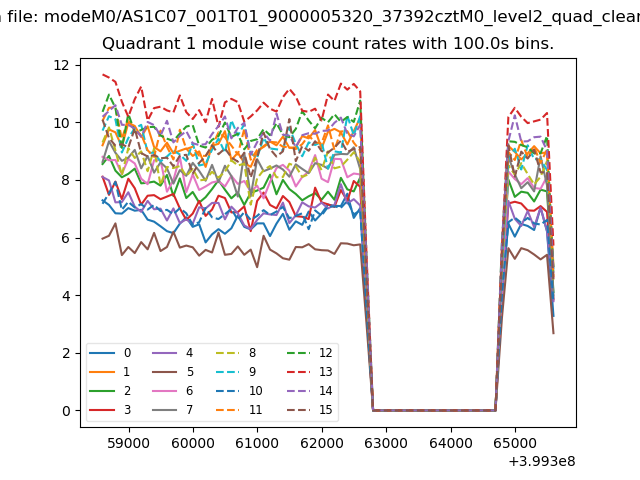
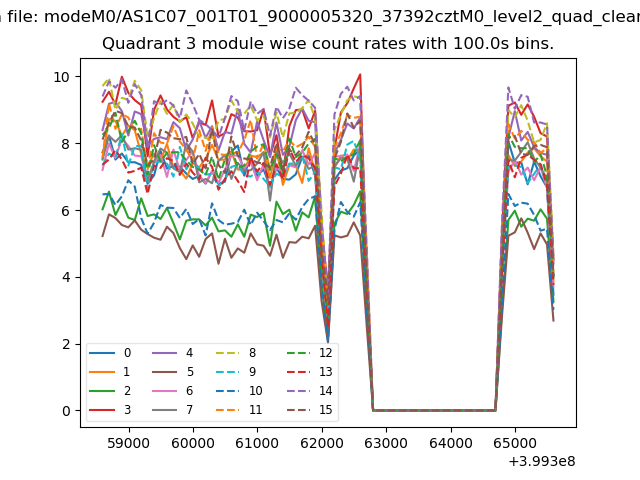
| Module-wise count rates for Quadrant A Data is divided into 100 sec bins |
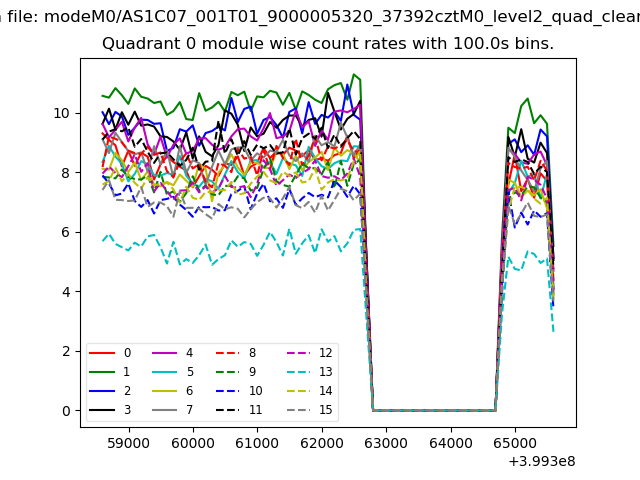 |
 |
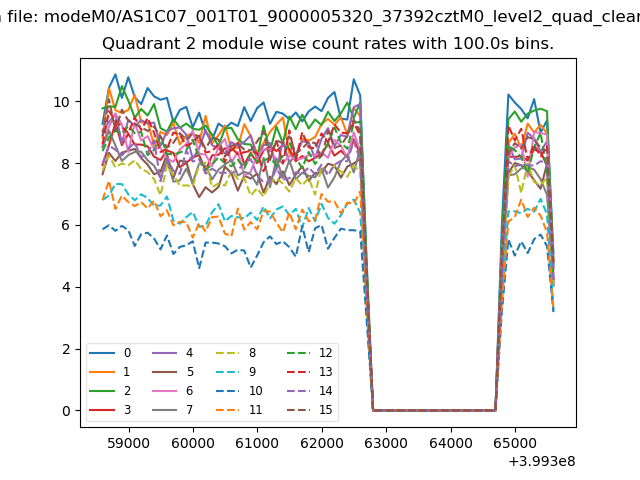
| Module-wise count rates for Quadrant B Data is divided into 100 sec bins |
 |
 |
| Module-wise count rates for Quadrant C Data is divided into 100 sec bins |
 |
 |
| Module-wise count rates for Quadrant D Data is divided into 100 sec bins |
 |
 |
| Parameter | Plot |
|---|---|
| CZT HV Monitor | 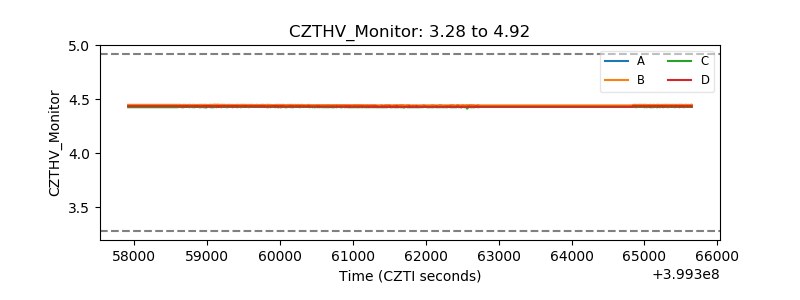 |
| D_VDD | 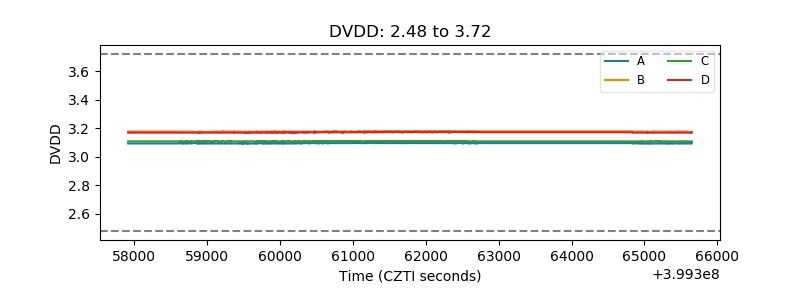 |
| Temperature 1 | 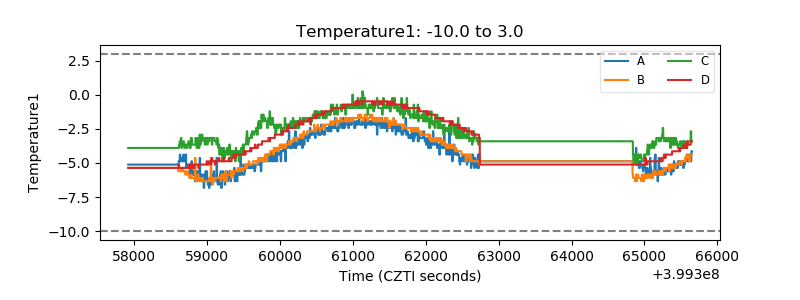 |
| Veto HV Monitor | 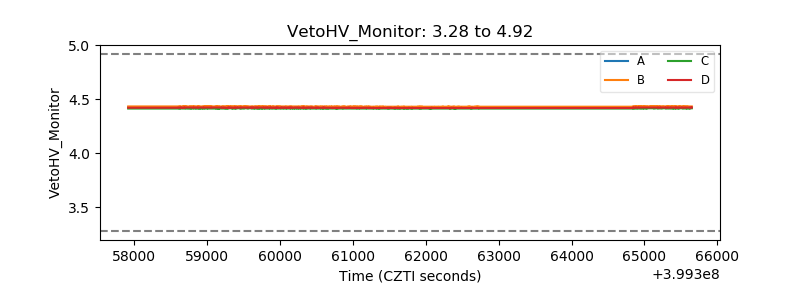 |
| Veto LLD | 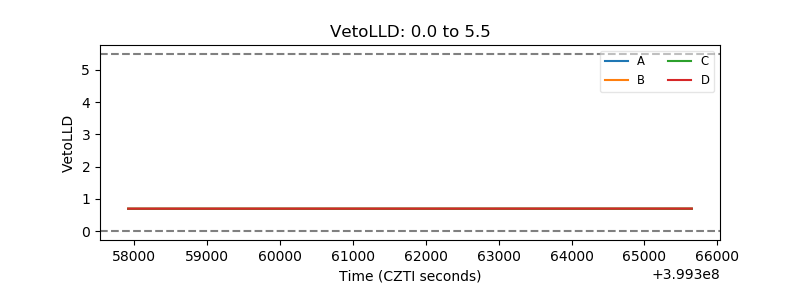 |
| Alpha Counter | 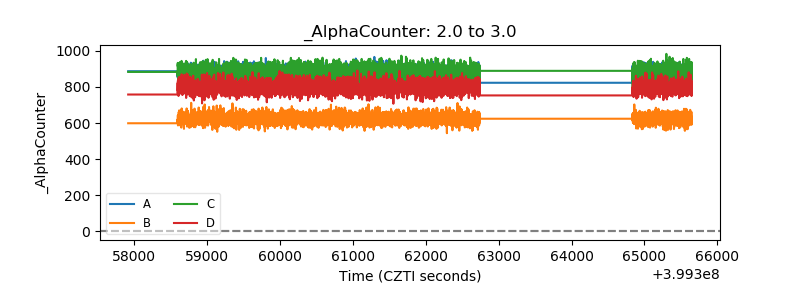 |
| _CPM_Rate | 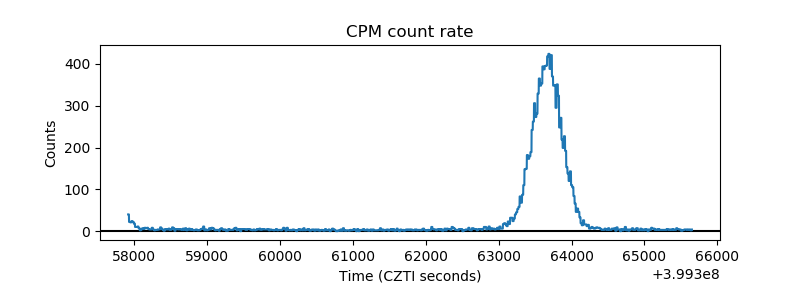 |
| CZT Counter | 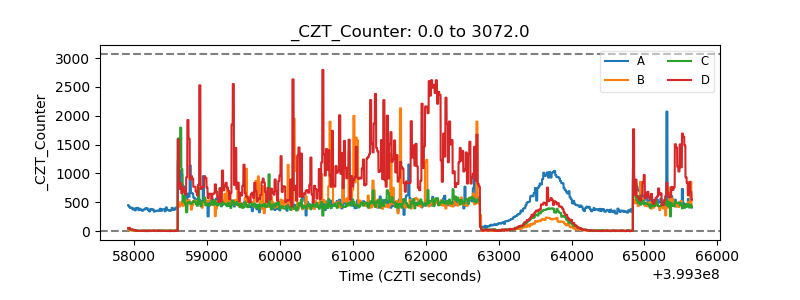 |
| +2.5 Volts monitor | 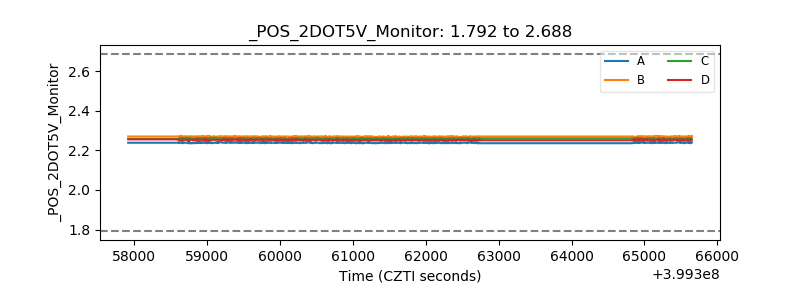 |
| +5 Volts monitor | 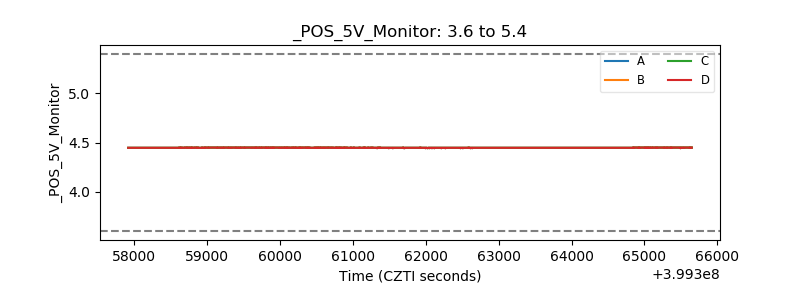 |
| _ROLL_ROT | 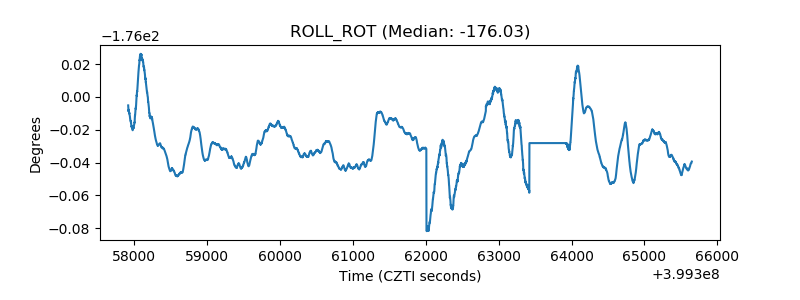 |
| _Roll_DEC | 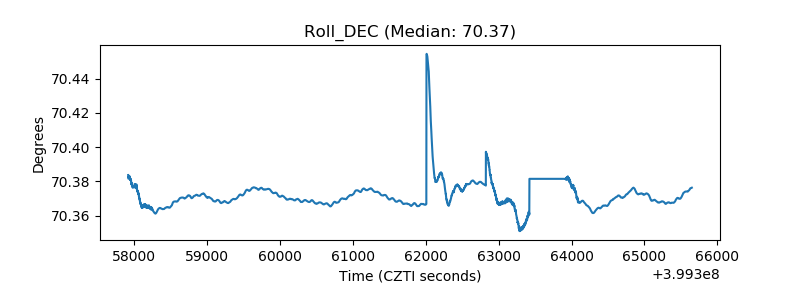 |
| _Roll_RA | 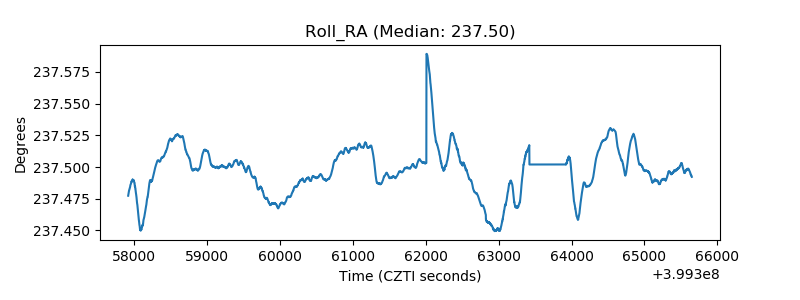 |
| Veto Counter | 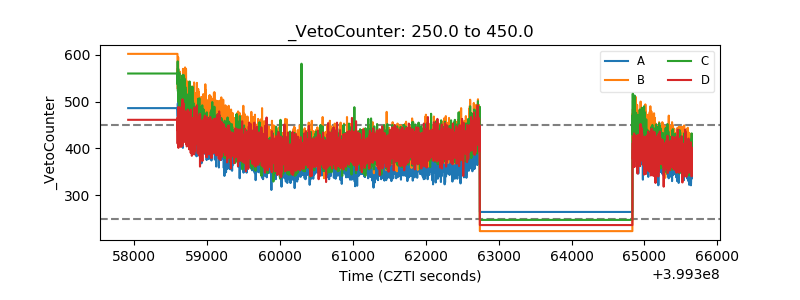 |