| Param | Original file | Final file |
|---|---|---|
| Filename | modeM0/AS1C07_001T01_9000005320_37394cztM0_level2.evt | modeM0/AS1C07_001T01_9000005320_37394cztM0_level2_quad_clean.evt |
| Size (bytes) | 589,973,760 | 97,807,680 |
| Size | 562.6 MB | 93.3 MB |
| Events in quadrant A | 2,763,848 | 678,928 |
| Events in quadrant B | 3,039,738 | 680,187 |
| Events in quadrant C | 3,585,729 | 657,308 |
| Events in quadrant D | 8,104,742 | 558,949 |
| Mode SS | |||
|---|---|---|---|
| Quadrant | BADHDUFLAG | Total packets | Discarded packets |
| A | 0 | 112 | 0 |
| B | 0 | 112 | 0 |
| C | 0 | 112 | 0 |
| D | 0 | 112 | 0 |
| Mode M0 | |||
|---|---|---|---|
| Quadrant | BADHDUFLAG | Total packets | Discarded packets |
| A | 0 | 11613 | 3 |
| B | 0 | 12741 | 2 |
| C | 0 | 14195 | 2 |
| D | 0 | 27953 | 2 |
| Mode M9 | |||
|---|---|---|---|
| Quadrant | BADHDUFLAG | Total packets | Discarded packets |
| A | 0 | 16 | 0 |
| B | 0 | 16 | 0 |
| C | 0 | 16 | 0 |
| D | 0 | 17 | 0 |
| Quadrant | Total seconds | Saturated seconds | Saturation percentage |
|---|---|---|---|
| A | 5518 | 18 | 0.326205% |
| B | 5518 | 73 | 1.322943% |
| C | 5518 | 90 | 1.631026% |
| D | 5518 | 1621 | 29.376586% |
Noise dominated data is calculated using 1-second bins in cleaned event files. If a bin has >2000 counts, and if more than 50% of those come from <1% of pixels, then it is considered to be noise-dominated and hence unusable.
| Quadrant | # 1 sec bins | Bins with >0 counts | Bins with >2000 counts | High rate bins dominated by noise | Noise dominated (total time) | Noise dominated (detector-on time) | Marked lightcurve |
|---|---|---|---|---|---|---|---|
| A | 7101 | 5519 | 3 | 3 | 0.04% | 0.05% | 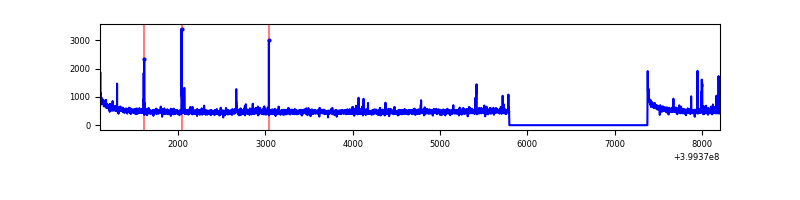 |
| B | 7101 | 5519 | 46 | 46 | 0.65% | 0.83% | 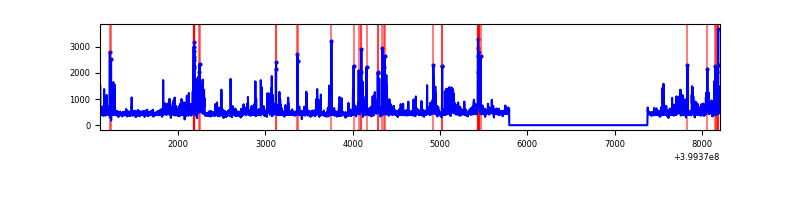 |
| C | 7101 | 5519 | 87 | 87 | 1.23% | 1.58% | 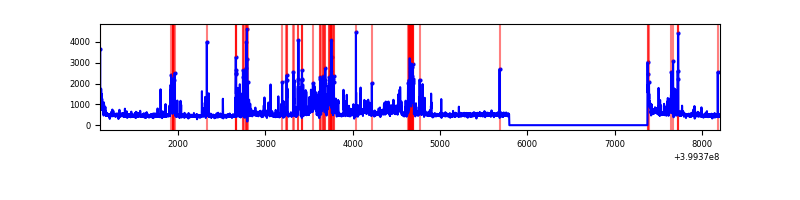 |
| D | 7101 | 5519 | 1553 | 1553 | 21.87% | 28.14% | 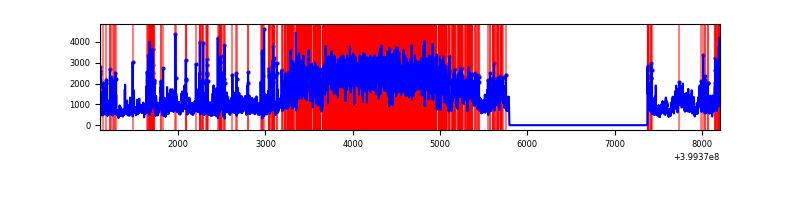 |
Top three noisy pixels from each quadrant. If the there are fewer than three noisy pixels in the level2.evt file, extra rows are filled as -1
| Pixel properties | Quadrant properties | ||||||
|---|---|---|---|---|---|---|---|
| Quadrant | DetID | PixID | Counts | Sigma | Mean | Median | Sigma |
| A | 10 | 83 | 299137 | 2431.13 | 609 | 596 | 122.8 |
| A | 10 | 248 | 30909 | 246.85 | 609 | 596 | 122.8 |
| A | 12 | 227 | 16878 | 132.59 | 609 | 596 | 122.8 |
| B | 4 | 171 | 190621 | 1656.54 | 599 | 583 | 114.7 |
| B | 5 | 255 | 113496 | 984.25 | 599 | 583 | 114.7 |
| B | 4 | 232 | 95388 | 826.41 | 599 | 583 | 114.7 |
| C | 1 | 23 | 955562 | 7059.63 | 584 | 587 | 135.3 |
| C | 15 | 214 | 237038 | 1747.96 | 584 | 587 | 135.3 |
| C | 0 | 10 | 56888 | 416.2 | 584 | 587 | 135.3 |
| D | 12 | 235 | 4497717 | 34395.48 | 534 | 517 | 130.7 |
| D | 12 | 227 | 517296 | 3952.43 | 534 | 517 | 130.7 |
| D | 13 | 249 | 375720 | 2869.62 | 534 | 517 | 130.7 |
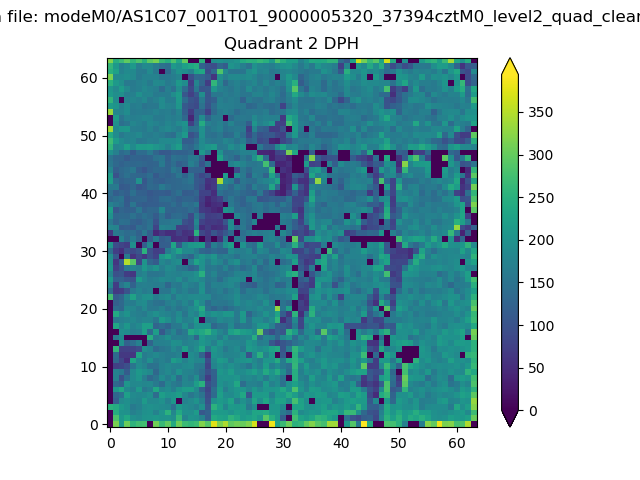
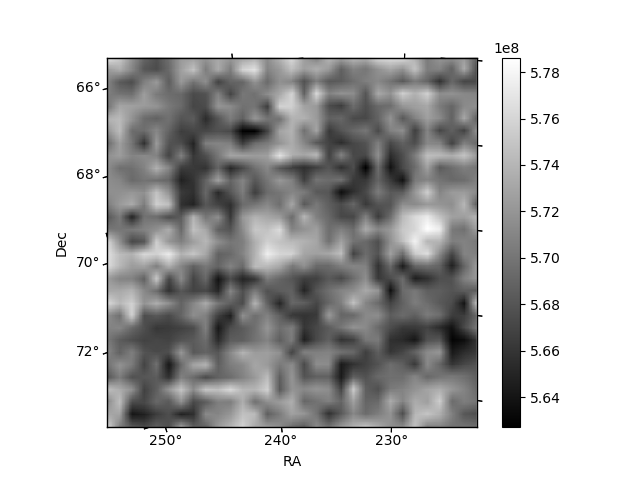
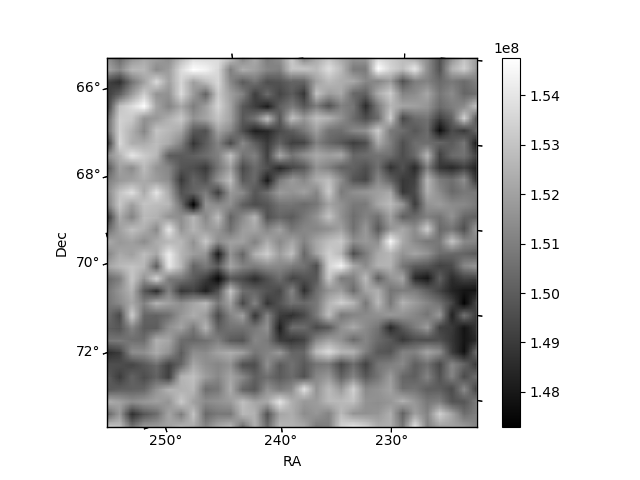
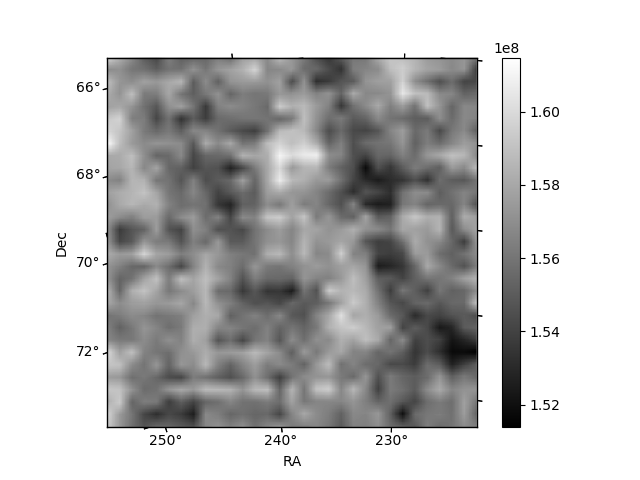
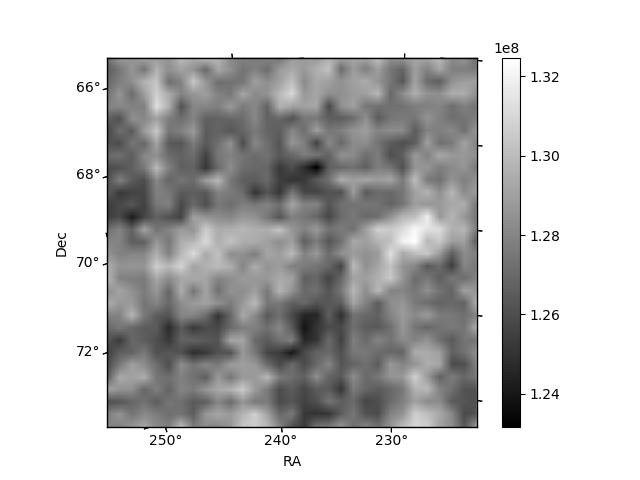
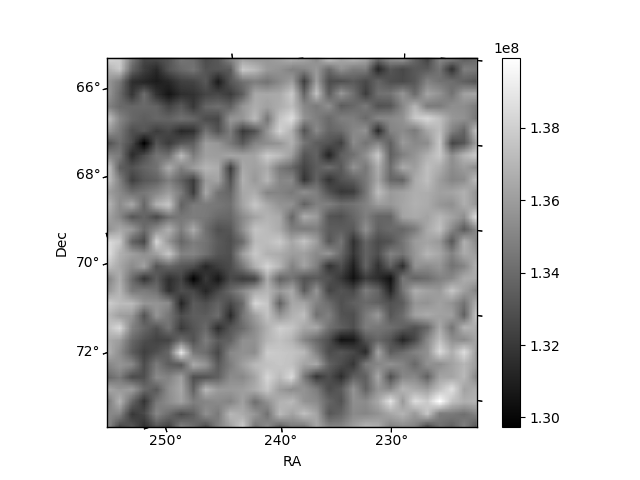
Histogram calculated using DETX and DETY for each event in the final _common_clean file
| Quadrant A | 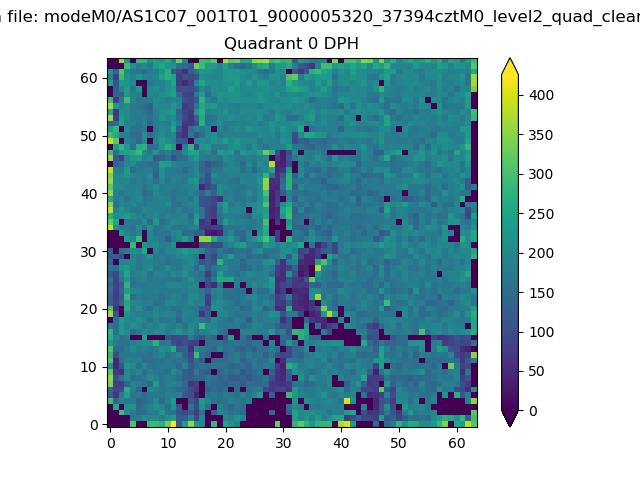 |
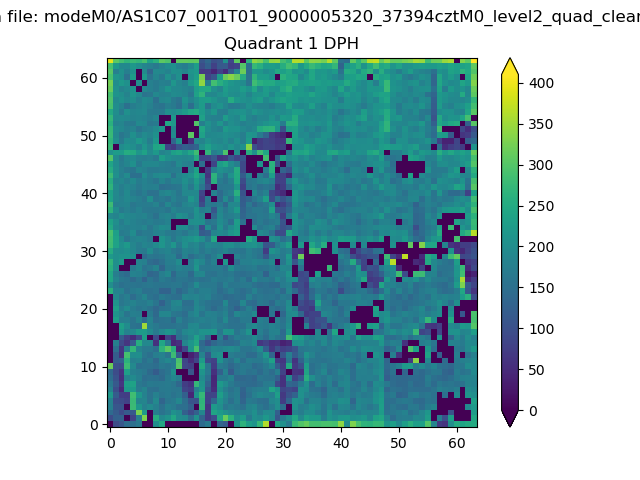 |
Quadrant B |
|---|---|---|---|
| Quadrant D | 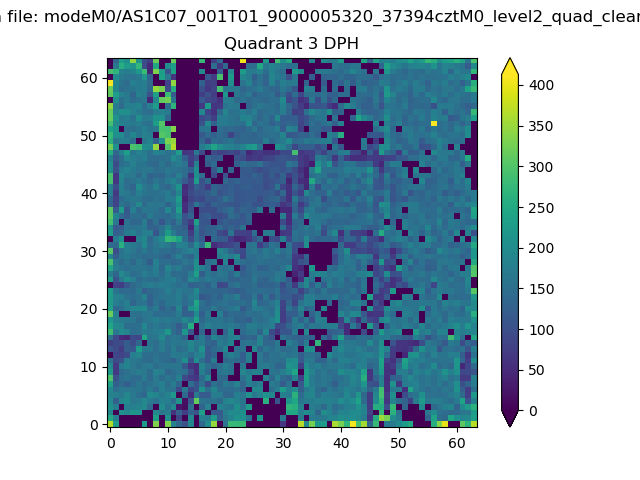 |
 |
Quadrant C |
| Plot type | Count rate plots | Images |
|---|---|---|
| Comparison with Poisson distribution Blue bars denote a histogram of data divided into 1 sec bins. Red curve is a Poisson curve with rate = median count rate of data. |
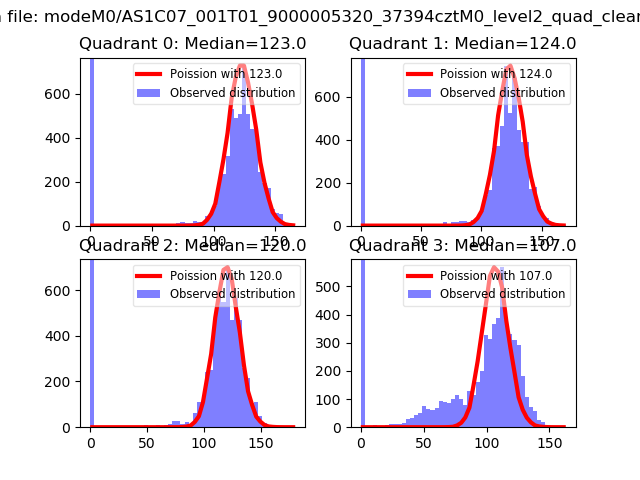 |
 |
| Quadrant-wise count rates Data is divided into 100 sec bins |
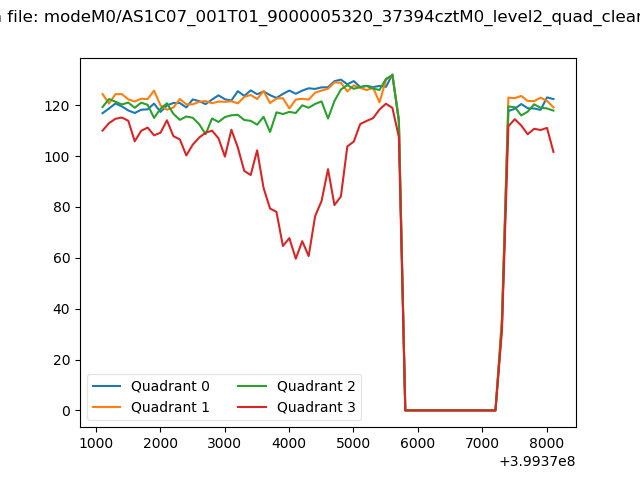 |
|
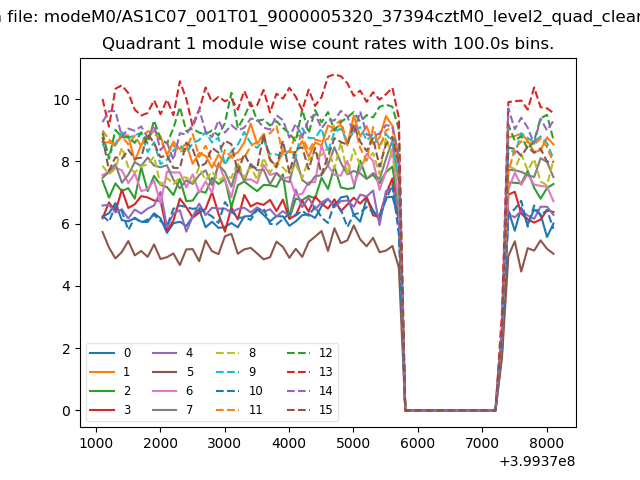
| Module-wise count rates for Quadrant A Data is divided into 100 sec bins |
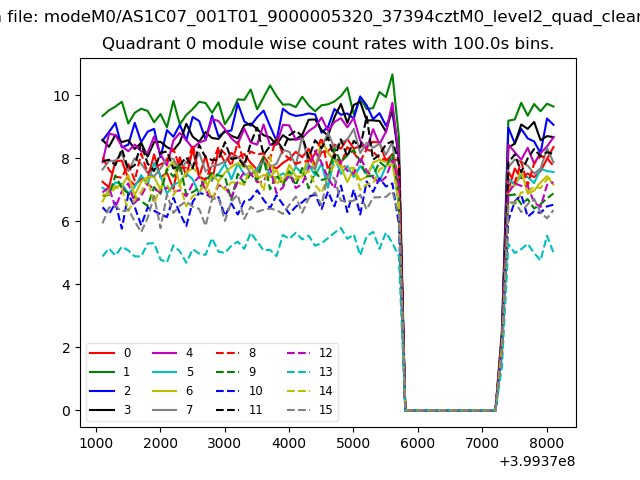 |
 |
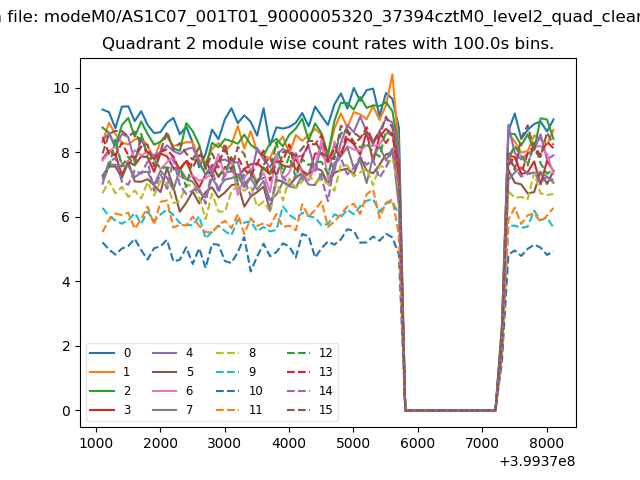
| Module-wise count rates for Quadrant B Data is divided into 100 sec bins |
 |
 |
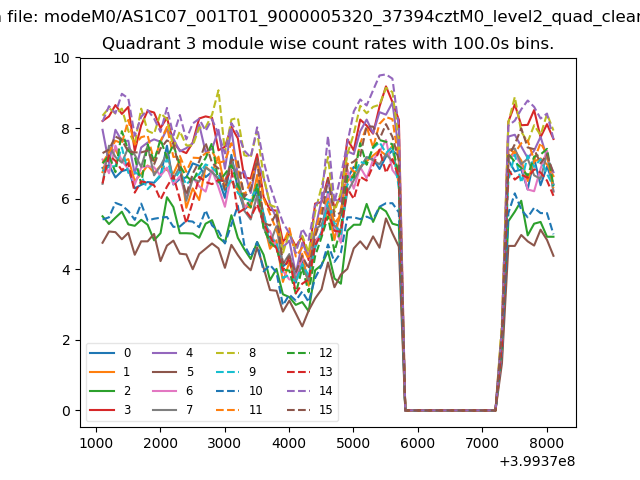
| Module-wise count rates for Quadrant C Data is divided into 100 sec bins |
 |
 |
| Module-wise count rates for Quadrant D Data is divided into 100 sec bins |
 |
 |
| Parameter | Plot |
|---|---|
| CZT HV Monitor |  |
| D_VDD | 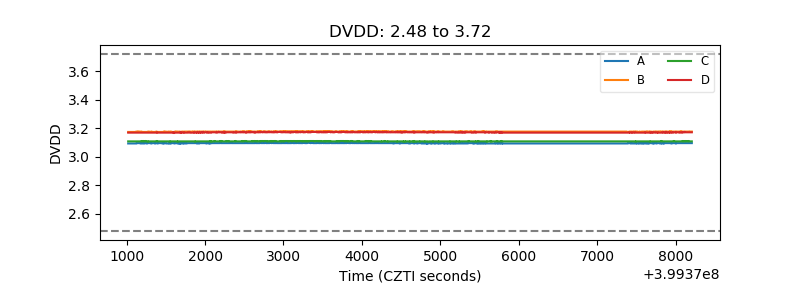 |
| Temperature 1 | 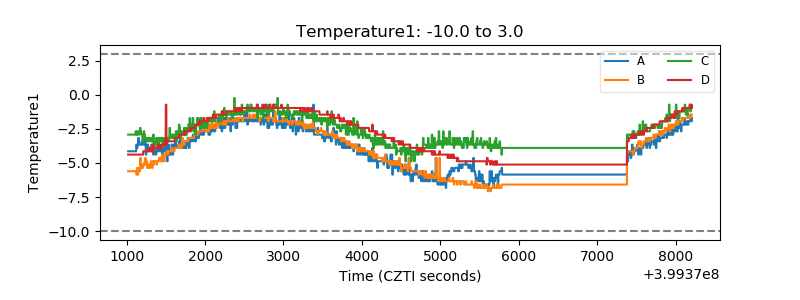 |
| Veto HV Monitor | 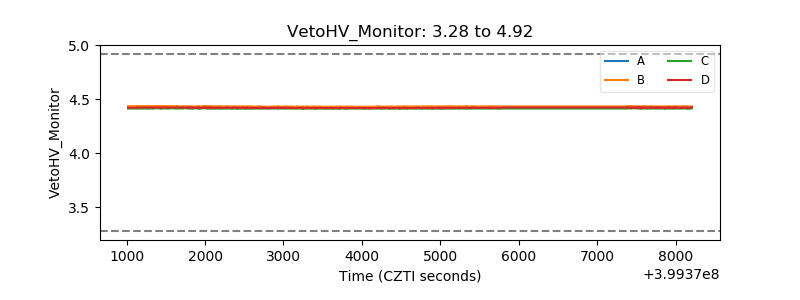 |
| Veto LLD | 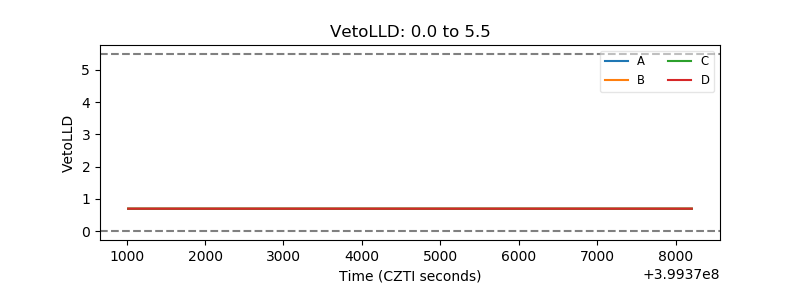 |
| Alpha Counter | 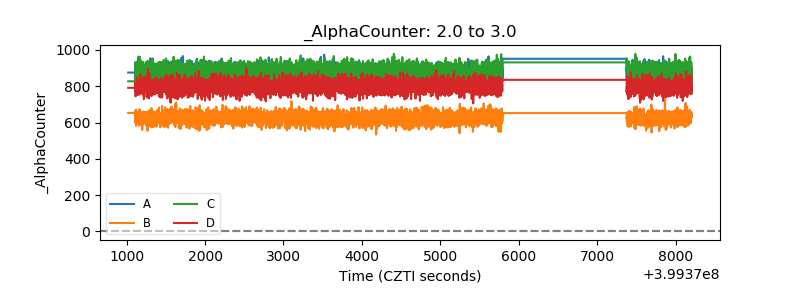 |
| _CPM_Rate | 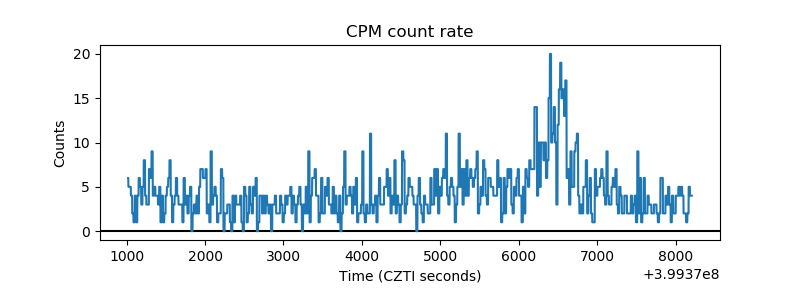 |
| CZT Counter | 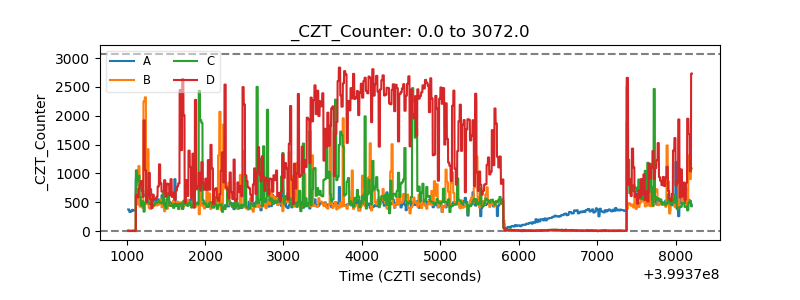 |
| +2.5 Volts monitor | 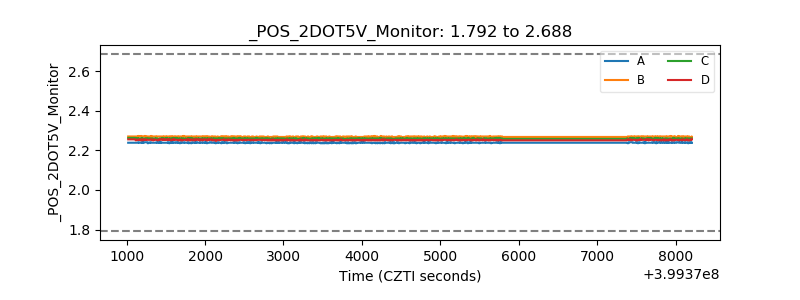 |
| +5 Volts monitor | 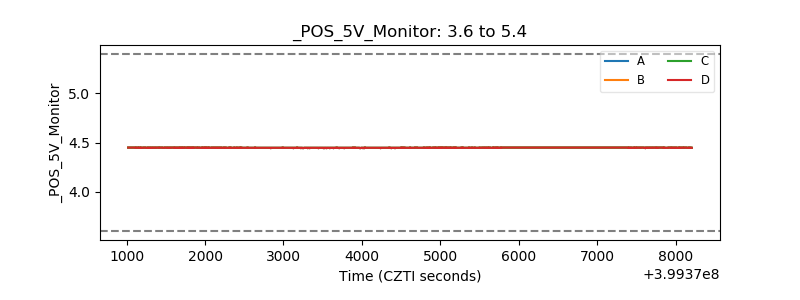 |
| _ROLL_ROT | 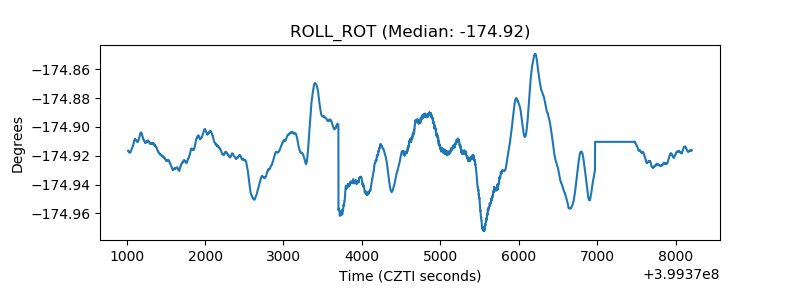 |
| _Roll_DEC | 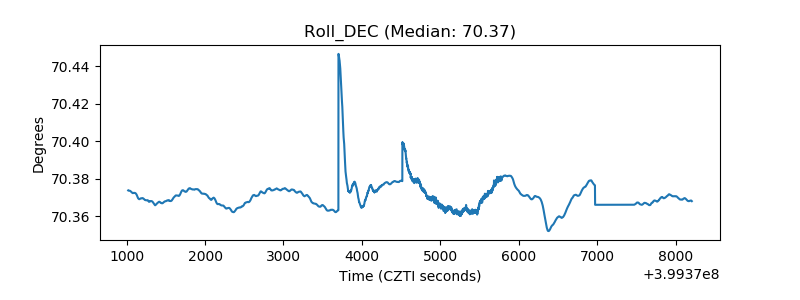 |
| _Roll_RA | 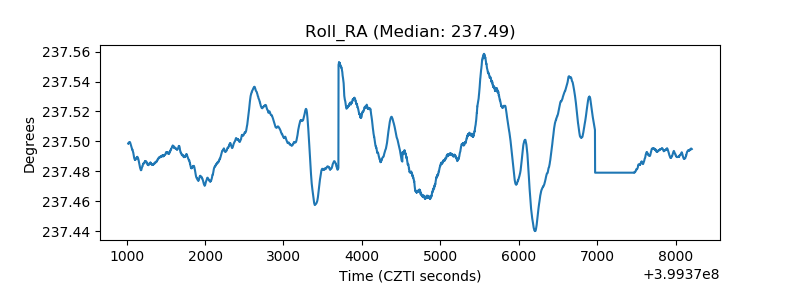 |
| Veto Counter | 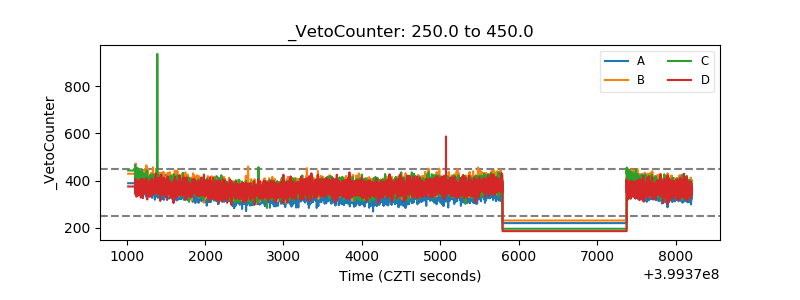 |