| Param | Original file | Final file |
|---|---|---|
| Filename | modeM0/AS1C07_001T01_9000005320_37396cztM0_level2.evt | modeM0/AS1C07_001T01_9000005320_37396cztM0_level2_quad_clean.evt |
| Size (bytes) | 1,161,930,240 | 189,820,800 |
| Size | 1.1 GB | 181.0 MB |
| Events in quadrant A | 5,566,524 | 1,319,205 |
| Events in quadrant B | 6,266,975 | 1,301,304 |
| Events in quadrant C | 6,174,441 | 1,278,079 |
| Events in quadrant D | 16,451,386 | 1,099,344 |
| Mode SS | |||
|---|---|---|---|
| Quadrant | BADHDUFLAG | Total packets | Discarded packets |
| A | 0 | 222 | 0 |
| B | 0 | 222 | 0 |
| C | 0 | 222 | 0 |
| D | 0 | 222 | 0 |
| Mode M0 | |||
|---|---|---|---|
| Quadrant | BADHDUFLAG | Total packets | Discarded packets |
| A | 0 | 23461 | 3 |
| B | 0 | 25833 | 2 |
| C | 0 | 25143 | 2 |
| D | 0 | 56285 | 2 |
| Mode M9 | |||
|---|---|---|---|
| Quadrant | BADHDUFLAG | Total packets | Discarded packets |
| A | 0 | 26 | 0 |
| B | 0 | 26 | 0 |
| C | 0 | 26 | 0 |
| D | 0 | 26 | 0 |
| Quadrant | Total seconds | Saturated seconds | Saturation percentage |
|---|---|---|---|
| A | 10831 | 42 | 0.387776% |
| B | 10831 | 257 | 2.372819% |
| C | 10831 | 158 | 1.458776% |
| D | 10831 | 3225 | 29.775644% |
Noise dominated data is calculated using 1-second bins in cleaned event files. If a bin has >2000 counts, and if more than 50% of those come from <1% of pixels, then it is considered to be noise-dominated and hence unusable.
| Quadrant | # 1 sec bins | Bins with >0 counts | Bins with >2000 counts | High rate bins dominated by noise | Noise dominated (total time) | Noise dominated (detector-on time) | Marked lightcurve |
|---|---|---|---|---|---|---|---|
| A | 13457 | 10833 | 30 | 30 | 0.22% | 0.28% | 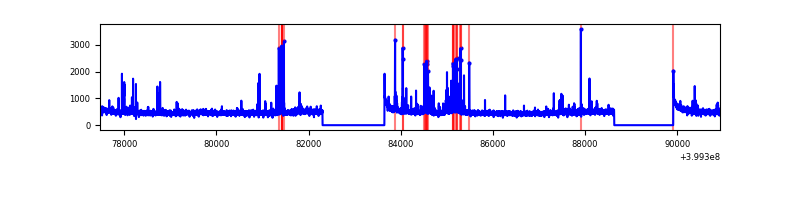 |
| B | 13457 | 10833 | 171 | 171 | 1.27% | 1.58% | 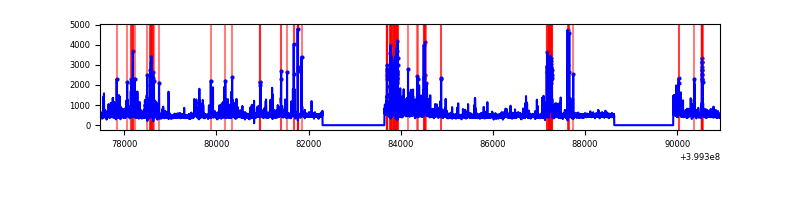 |
| C | 13457 | 10833 | 145 | 145 | 1.08% | 1.34% | 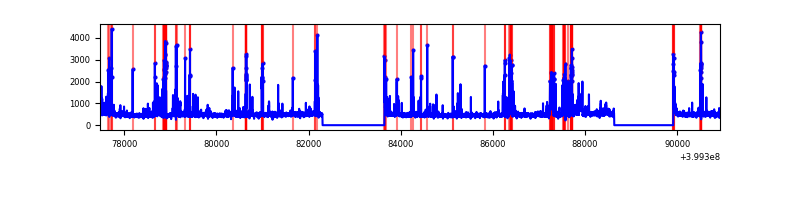 |
| D | 13457 | 10833 | 3111 | 3111 | 23.12% | 28.72% | 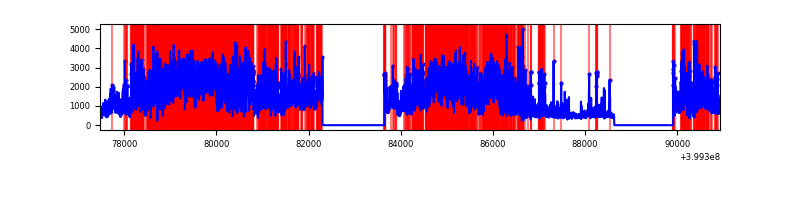 |
Top three noisy pixels from each quadrant. If the there are fewer than three noisy pixels in the level2.evt file, extra rows are filled as -1
| Pixel properties | Quadrant properties | ||||||
|---|---|---|---|---|---|---|---|
| Quadrant | DetID | PixID | Counts | Sigma | Mean | Median | Sigma |
| A | 10 | 83 | 502203 | 2090.26 | 1193 | 1171 | 239.7 |
| A | 9 | 143 | 171150 | 709.14 | 1193 | 1171 | 239.7 |
| A | 2 | 79 | 74462 | 305.76 | 1193 | 1171 | 239.7 |
| B | 5 | 200 | 319624 | 1442.04 | 1172 | 1141 | 220.9 |
| B | 0 | 213 | 314260 | 1417.75 | 1172 | 1141 | 220.9 |
| B | 4 | 171 | 239959 | 1081.33 | 1172 | 1141 | 220.9 |
| C | 1 | 23 | 938593 | 3548.12 | 1150 | 1159 | 264.2 |
| C | 15 | 214 | 456455 | 1723.26 | 1150 | 1159 | 264.2 |
| C | 14 | 254 | 134334 | 504.06 | 1150 | 1159 | 264.2 |
| D | 12 | 235 | 9947076 | 38366.2 | 1061 | 1027 | 259.2 |
| D | 12 | 227 | 739150 | 2847.26 | 1061 | 1027 | 259.2 |
| D | 13 | 249 | 517157 | 1990.94 | 1061 | 1027 | 259.2 |
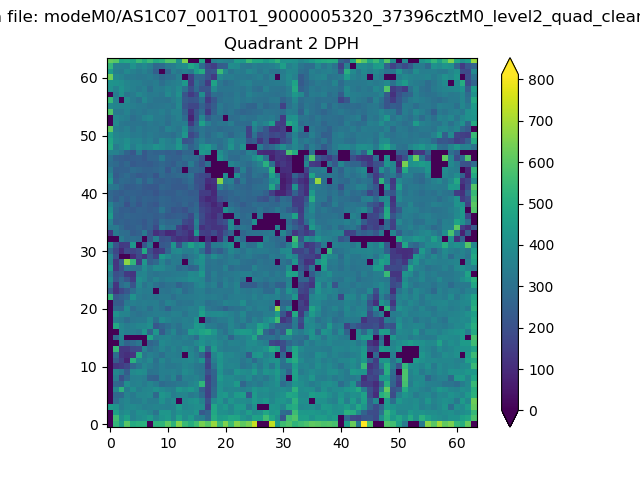
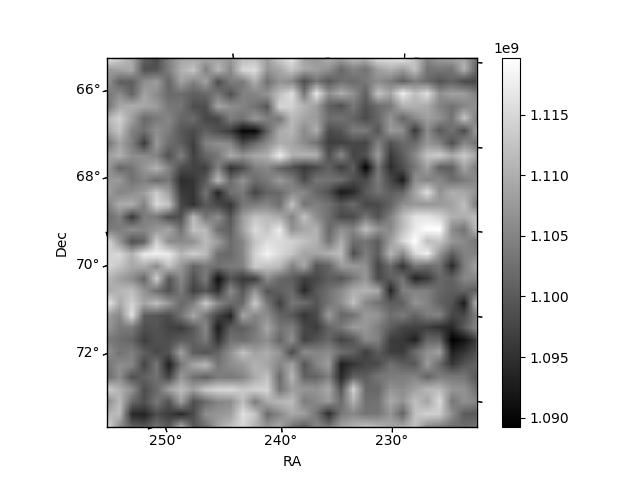
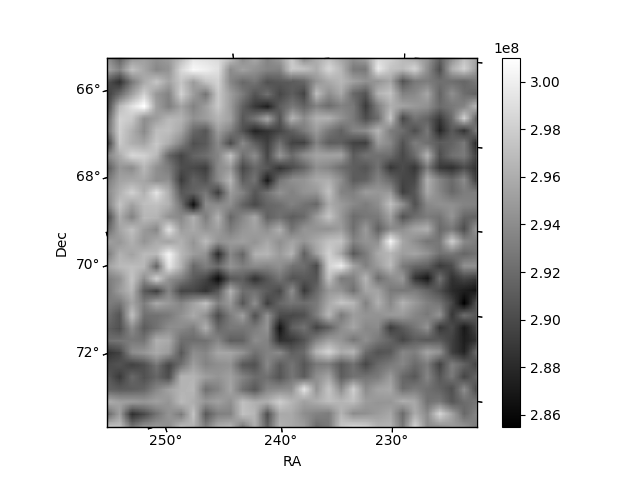
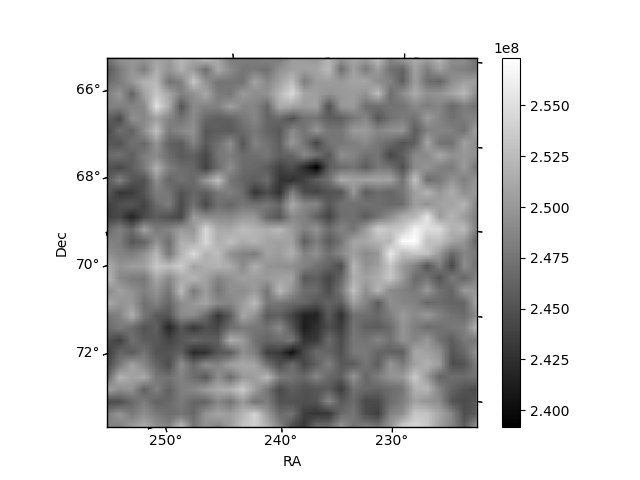
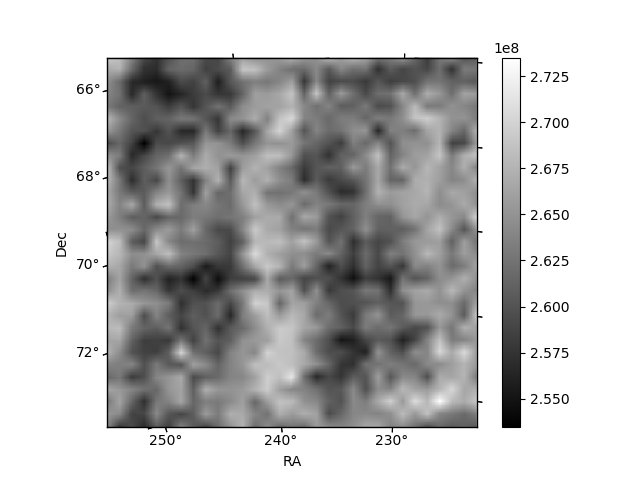
Histogram calculated using DETX and DETY for each event in the final _common_clean file
| Quadrant A | 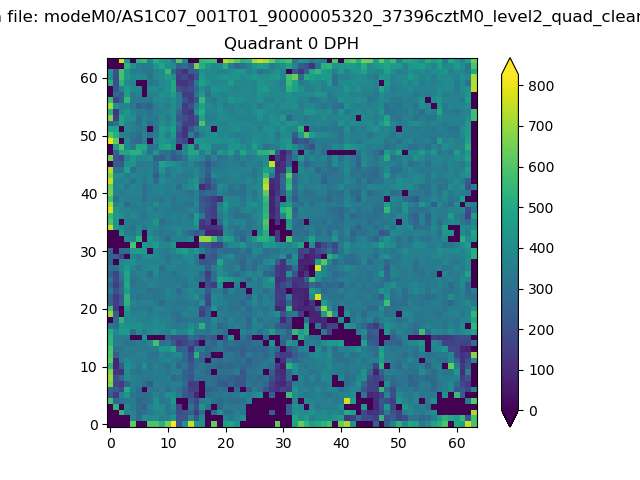 |
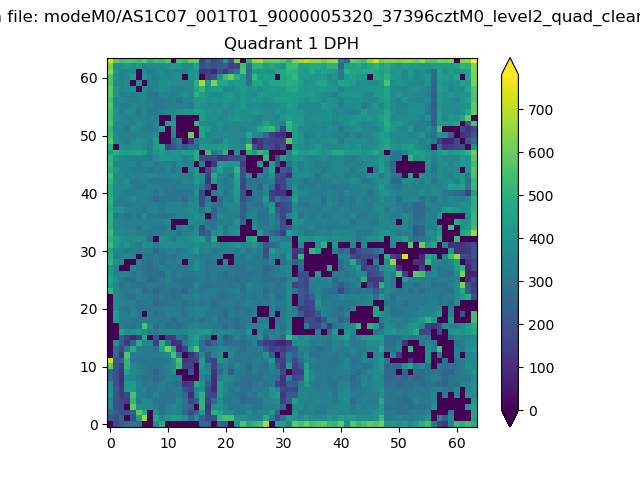 |
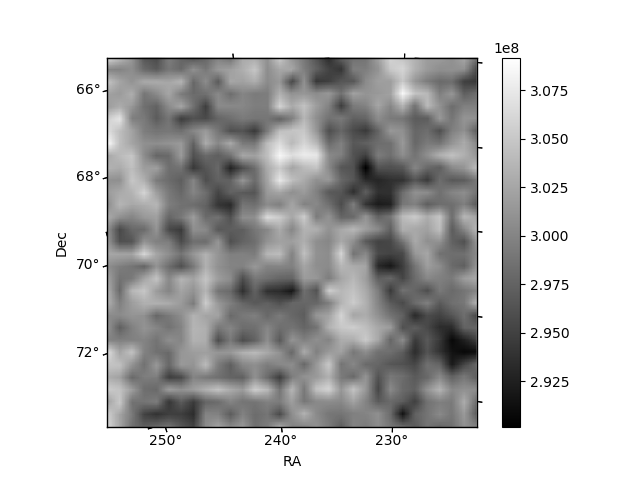
Quadrant B |
|---|---|---|---|
| Quadrant D | 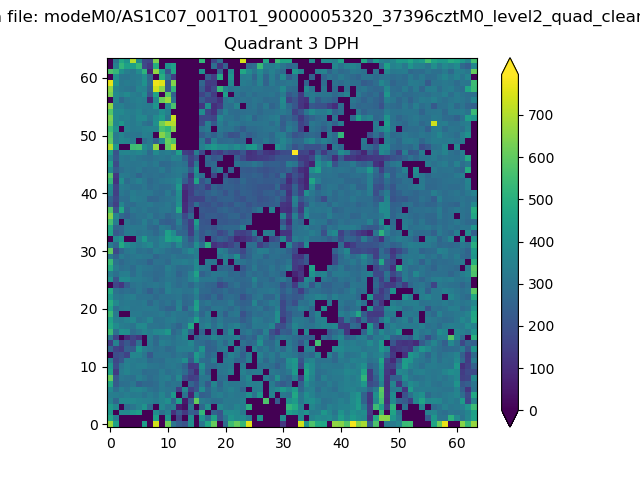 |
 |
Quadrant C |
| Plot type | Count rate plots | Images |
|---|---|---|
| Comparison with Poisson distribution Blue bars denote a histogram of data divided into 1 sec bins. Red curve is a Poisson curve with rate = median count rate of data. |
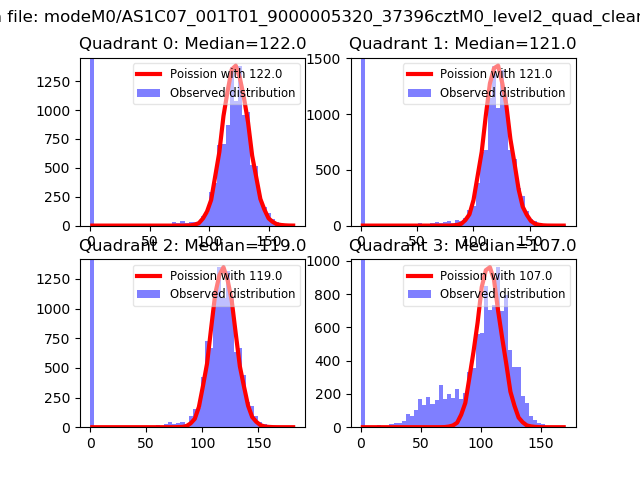 |
 |
| Quadrant-wise count rates Data is divided into 100 sec bins |
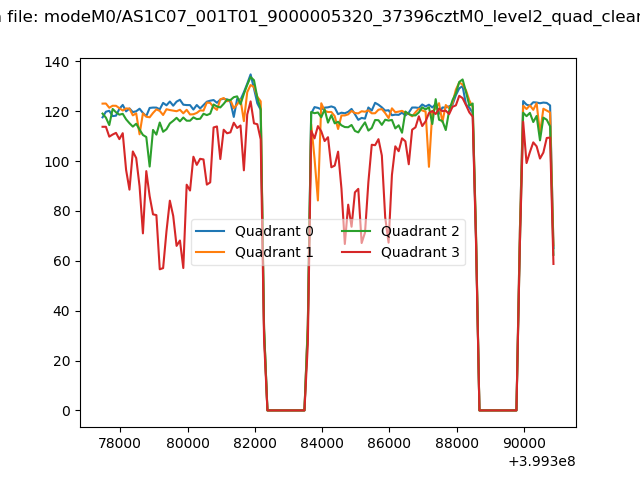 |
|
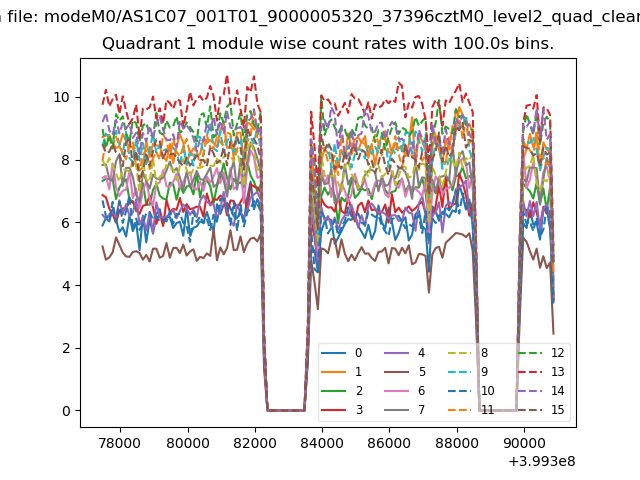
| Module-wise count rates for Quadrant A Data is divided into 100 sec bins |
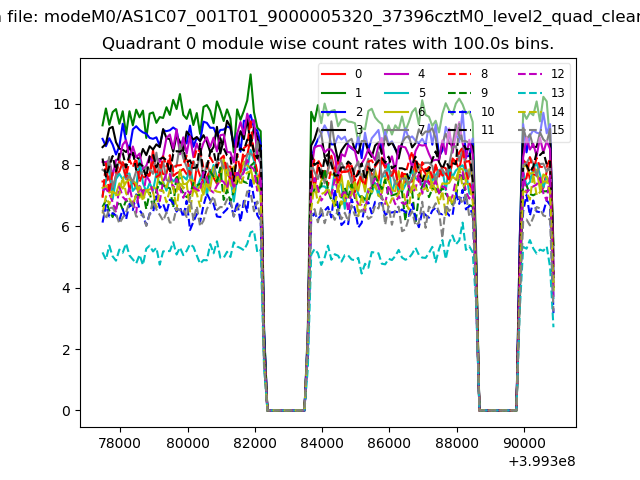 |
 |
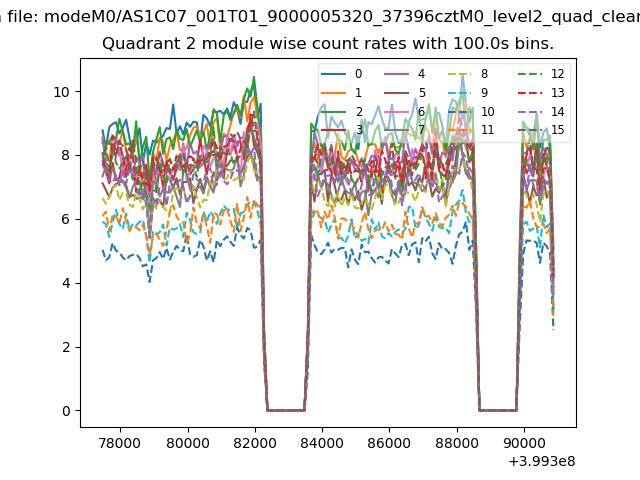
| Module-wise count rates for Quadrant B Data is divided into 100 sec bins |
 |
 |
| Module-wise count rates for Quadrant C Data is divided into 100 sec bins |
 |
 |
| Module-wise count rates for Quadrant D Data is divided into 100 sec bins |
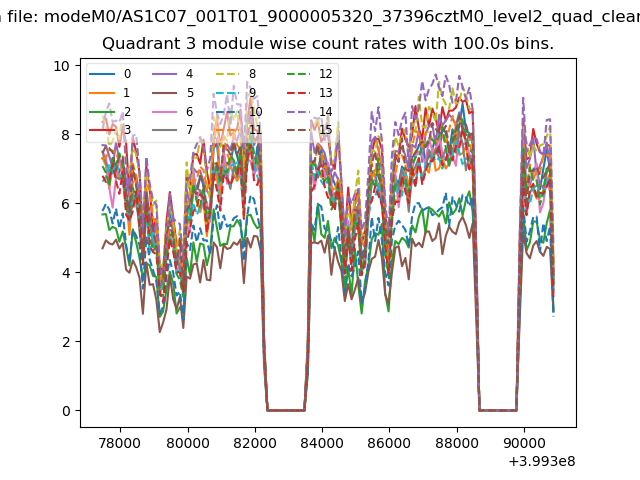 |
 |
| Parameter | Plot |
|---|---|
| CZT HV Monitor |  |
| D_VDD | 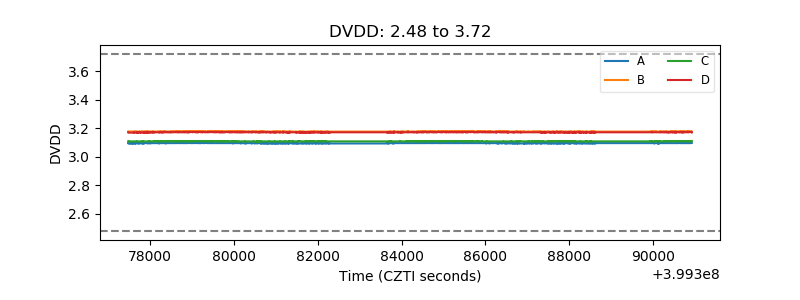 |
| Temperature 1 | 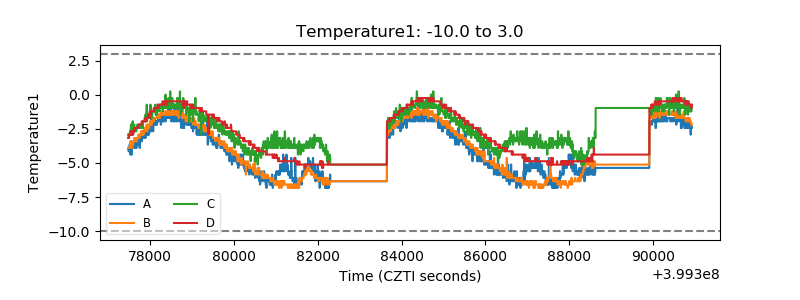 |
| Veto HV Monitor | 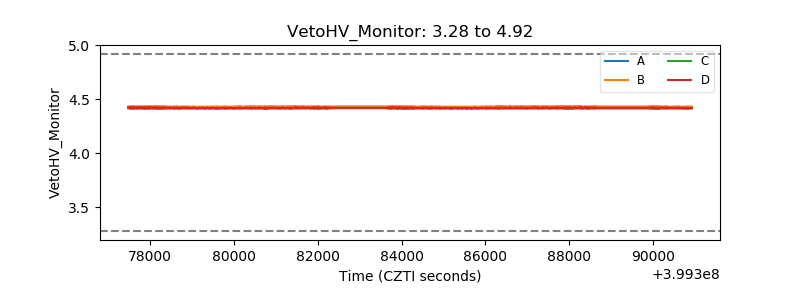 |
| Veto LLD | 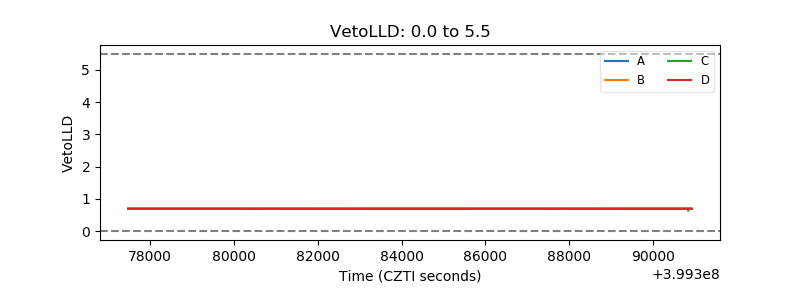 |
| Alpha Counter | 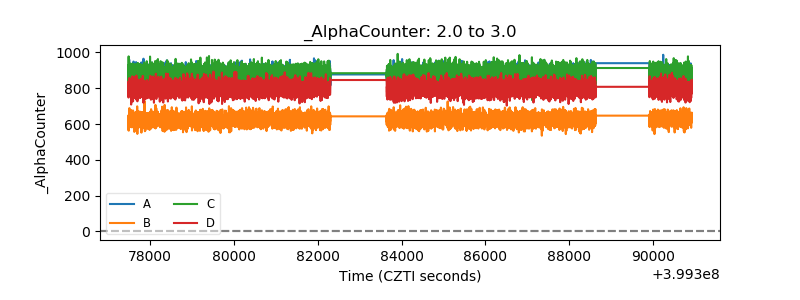 |
| _CPM_Rate | 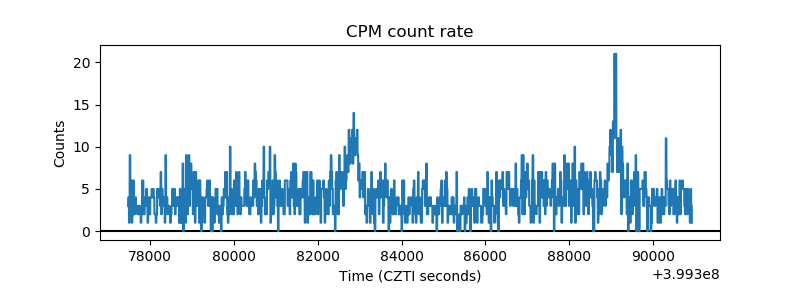 |
| CZT Counter | 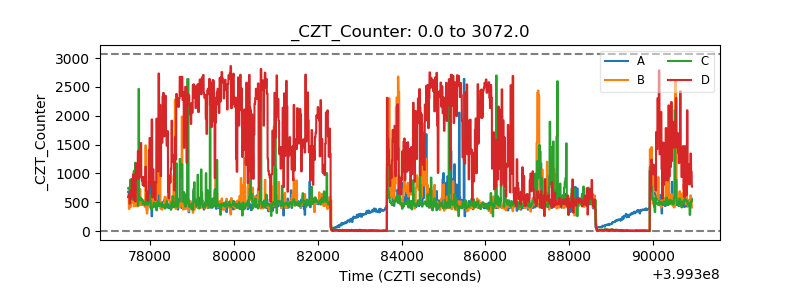 |
| +2.5 Volts monitor | 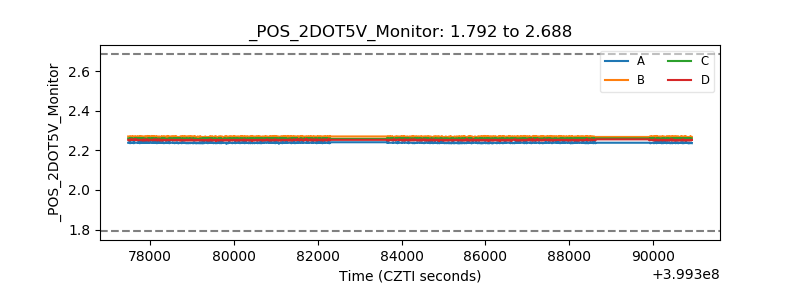 |
| +5 Volts monitor | 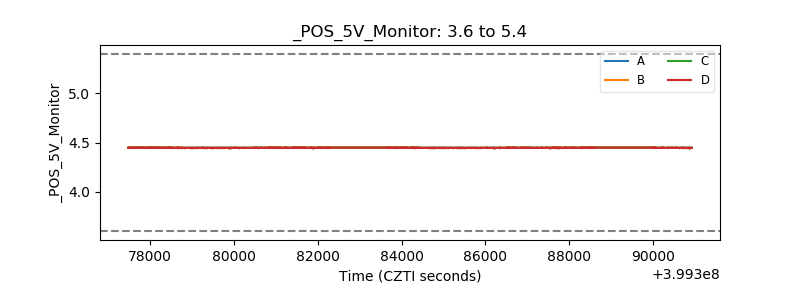 |
| _ROLL_ROT | 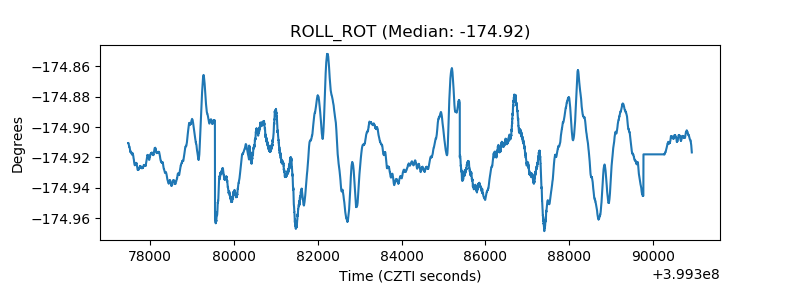 |
| _Roll_DEC | 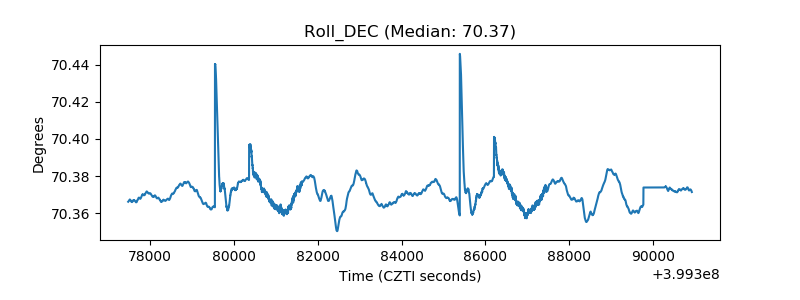 |
| _Roll_RA | 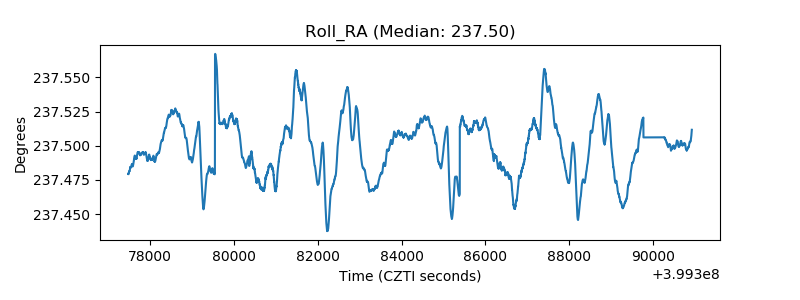 |
| Veto Counter | 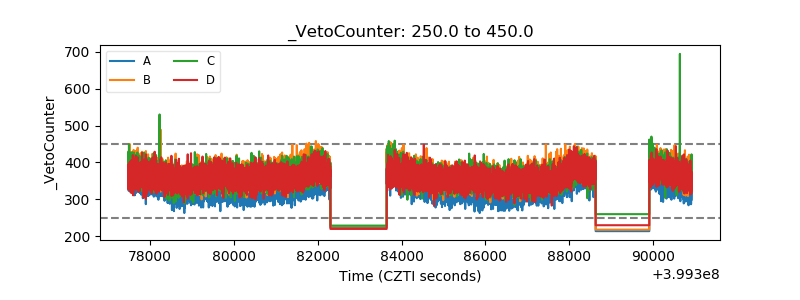 |