| Param | Original file | Final file |
|---|---|---|
| Filename | modeM0/AS1C07_001T01_9000005320_37398cztM0_level2.evt | modeM0/AS1C07_001T01_9000005320_37398cztM0_level2_quad_clean.evt |
| Size (bytes) | 1,346,008,320 | 255,087,360 |
| Size | 1.3 GB | 243.3 MB |
| Events in quadrant A | 7,168,876 | 1,750,771 |
| Events in quadrant B | 7,560,689 | 1,745,383 |
| Events in quadrant C | 7,840,244 | 1,703,871 |
| Events in quadrant D | 17,214,593 | 1,522,230 |
| Mode SS | |||
|---|---|---|---|
| Quadrant | BADHDUFLAG | Total packets | Discarded packets |
| A | 0 | 298 | 0 |
| B | 0 | 298 | 0 |
| C | 0 | 298 | 0 |
| D | 0 | 298 | 0 |
| Mode M0 | |||
|---|---|---|---|
| Quadrant | BADHDUFLAG | Total packets | Discarded packets |
| A | 0 | 30717 | 4 |
| B | 0 | 32241 | 3 |
| C | 0 | 32434 | 3 |
| D | 0 | 61298 | 3 |
| Mode M9 | |||
|---|---|---|---|
| Quadrant | BADHDUFLAG | Total packets | Discarded packets |
| A | 0 | 31 | 0 |
| B | 0 | 31 | 0 |
| C | 0 | 31 | 0 |
| D | 0 | 31 | 0 |
| Quadrant | Total seconds | Saturated seconds | Saturation percentage |
|---|---|---|---|
| A | 14520 | 52 | 0.358127% |
| B | 14520 | 168 | 1.157025% |
| C | 14520 | 214 | 1.473829% |
| D | 14520 | 2695 | 18.560606% |
Noise dominated data is calculated using 1-second bins in cleaned event files. If a bin has >2000 counts, and if more than 50% of those come from <1% of pixels, then it is considered to be noise-dominated and hence unusable.
| Quadrant | # 1 sec bins | Bins with >0 counts | Bins with >2000 counts | High rate bins dominated by noise | Noise dominated (total time) | Noise dominated (detector-on time) | Marked lightcurve |
|---|---|---|---|---|---|---|---|
| A | 25880 | 14523 | 28 | 28 | 0.11% | 0.19% | 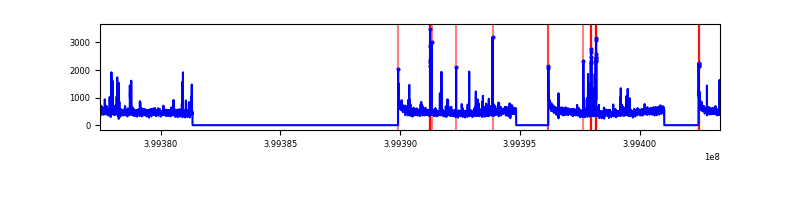 |
| B | 25880 | 14523 | 113 | 113 | 0.44% | 0.78% | 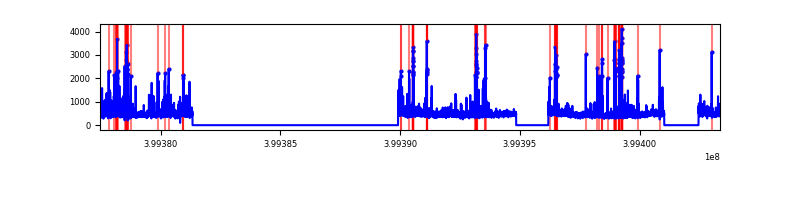 |
| C | 25880 | 14523 | 189 | 189 | 0.73% | 1.30% | 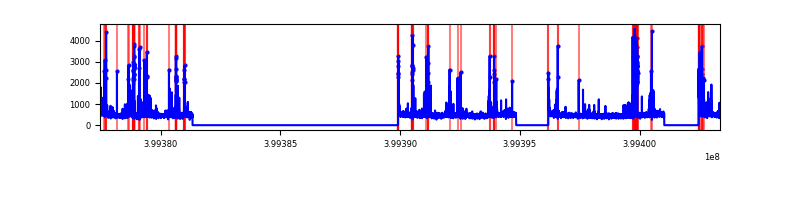 |
| D | 25880 | 14523 | 2573 | 2573 | 9.94% | 17.72% | 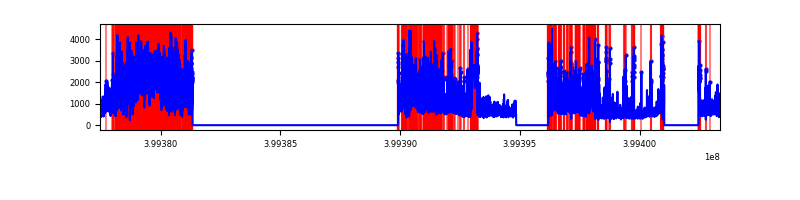 |
Top three noisy pixels from each quadrant. If the there are fewer than three noisy pixels in the level2.evt file, extra rows are filled as -1
| Pixel properties | Quadrant properties | ||||||
|---|---|---|---|---|---|---|---|
| Quadrant | DetID | PixID | Counts | Sigma | Mean | Median | Sigma |
| A | 10 | 83 | 684912 | 2146.81 | 1593 | 1559 | 318.3 |
| A | 2 | 79 | 99590 | 307.97 | 1593 | 1559 | 318.3 |
| A | 9 | 143 | 93512 | 288.88 | 1593 | 1559 | 318.3 |
| B | 5 | 172 | 327477 | 1102.06 | 1577 | 1534 | 295.8 |
| B | 4 | 171 | 271900 | 914.15 | 1577 | 1534 | 295.8 |
| B | 0 | 213 | 237207 | 796.85 | 1577 | 1534 | 295.8 |
| C | 1 | 23 | 766520 | 2159.21 | 1540 | 1553 | 354.3 |
| C | 15 | 214 | 606917 | 1708.71 | 1540 | 1553 | 354.3 |
| C | 14 | 254 | 256642 | 720.02 | 1540 | 1553 | 354.3 |
| D | 12 | 235 | 7670744 | 21962.32 | 1453 | 1412 | 349.2 |
| D | 12 | 227 | 1164288 | 3330.08 | 1453 | 1412 | 349.2 |
| D | 2 | 249 | 889060 | 2541.92 | 1453 | 1412 | 349.2 |
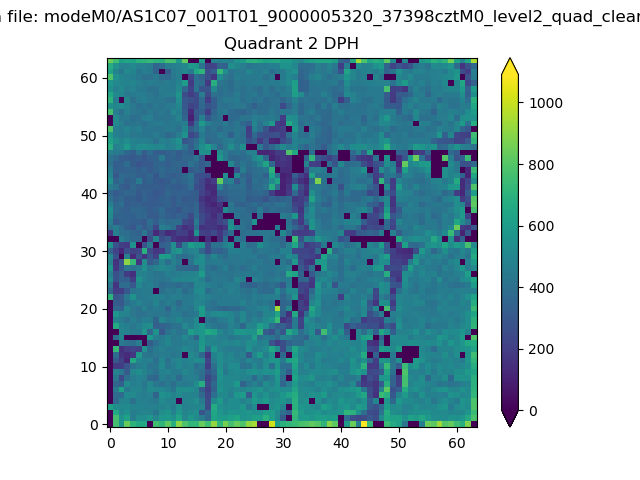
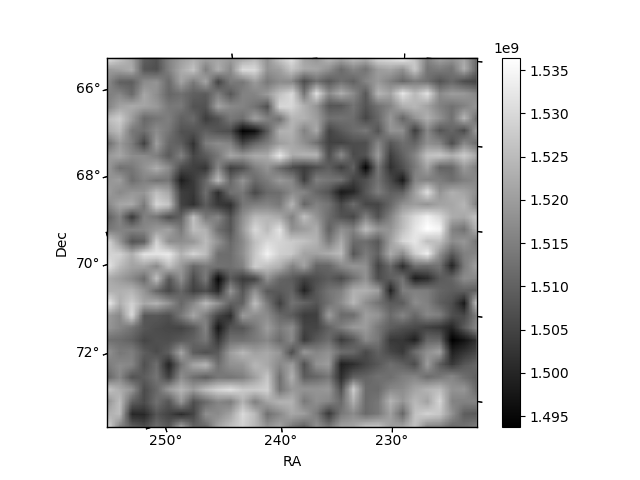
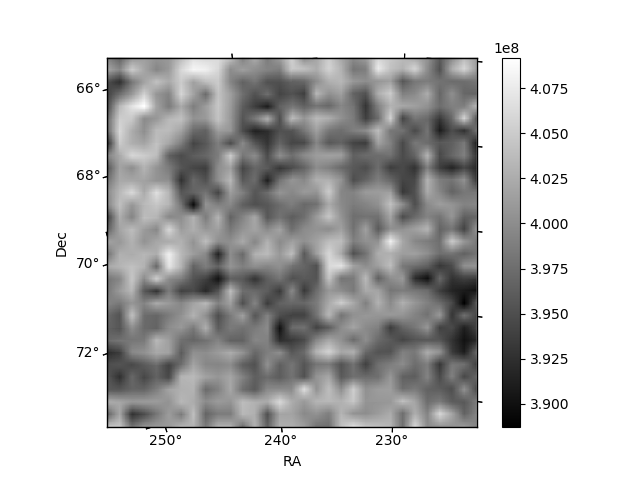
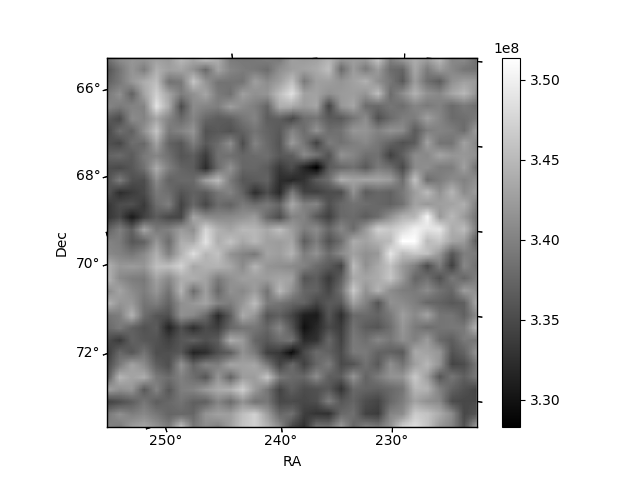
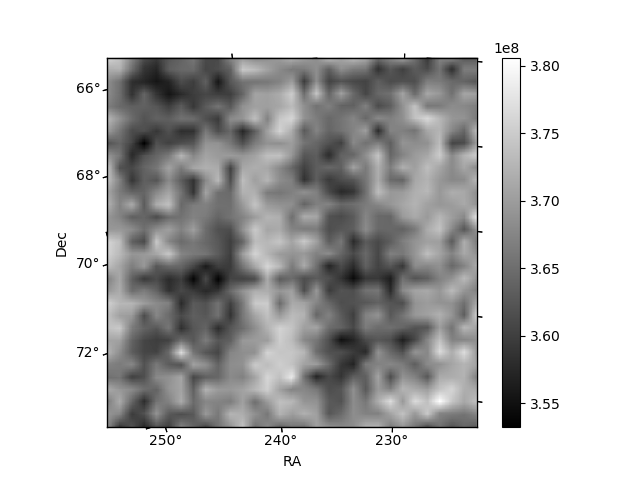
Histogram calculated using DETX and DETY for each event in the final _common_clean file
| Quadrant A | 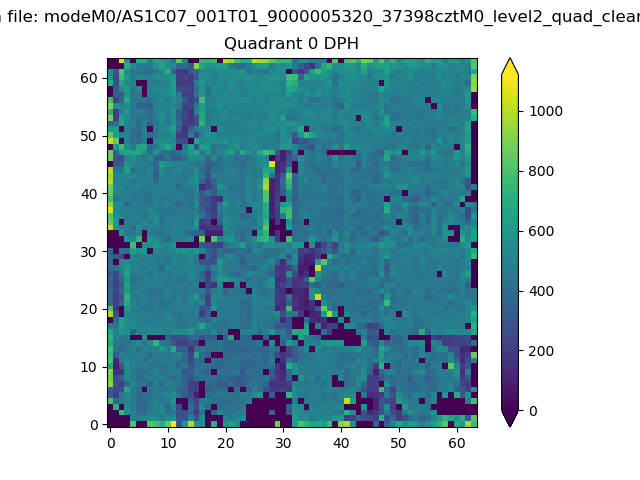 |
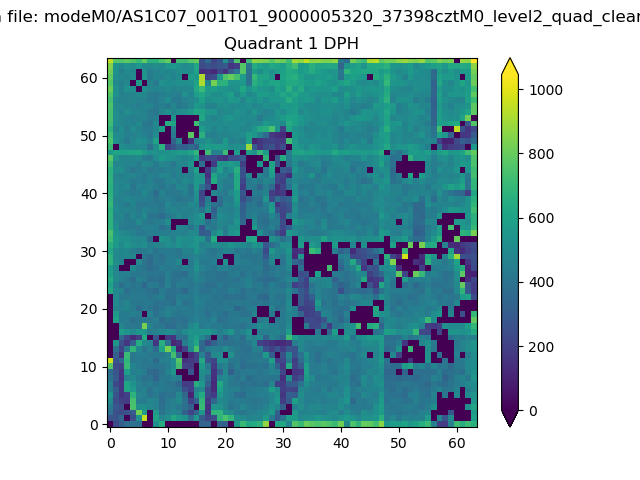 |
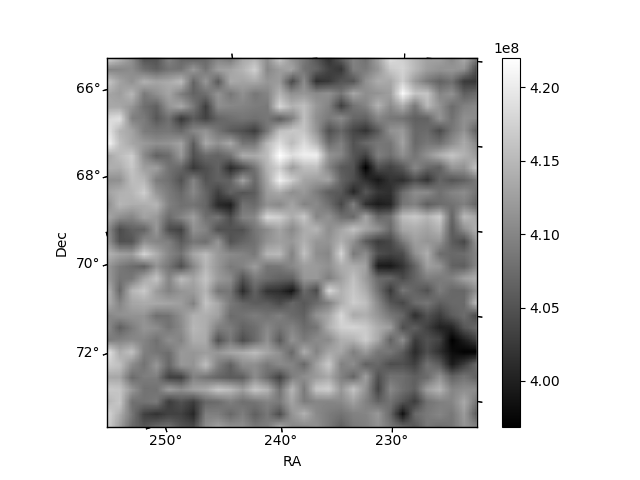
Quadrant B |
|---|---|---|---|
| Quadrant D | 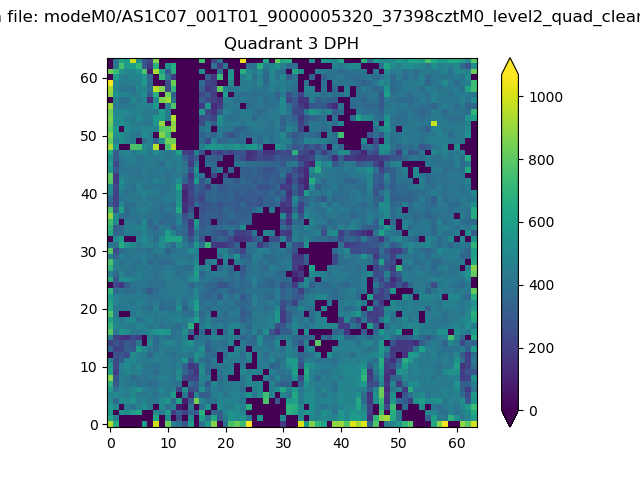 |
 |
Quadrant C |
| Plot type | Count rate plots | Images |
|---|---|---|
| Comparison with Poisson distribution Blue bars denote a histogram of data divided into 1 sec bins. Red curve is a Poisson curve with rate = median count rate of data. |
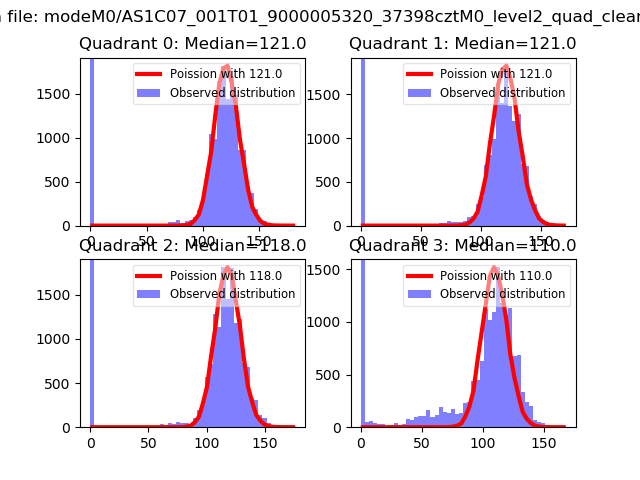 |
 |
| Quadrant-wise count rates Data is divided into 100 sec bins |
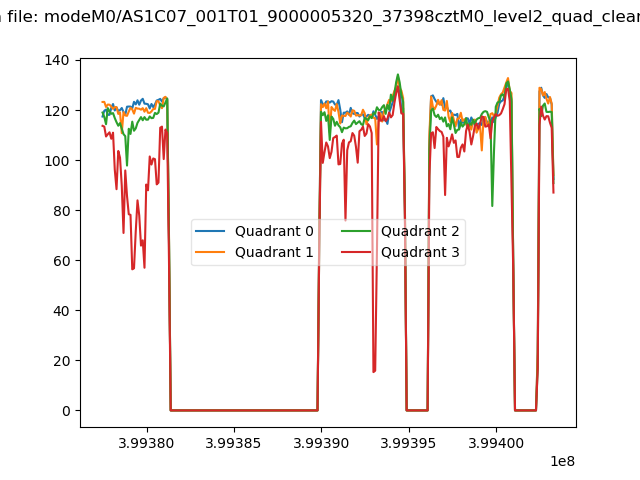 |
|
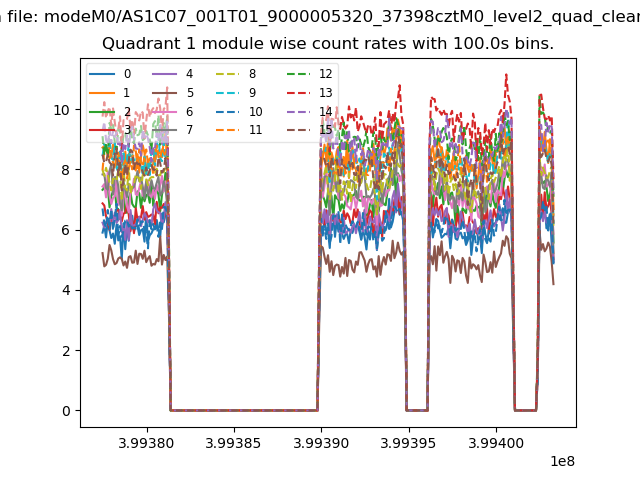
| Module-wise count rates for Quadrant A Data is divided into 100 sec bins |
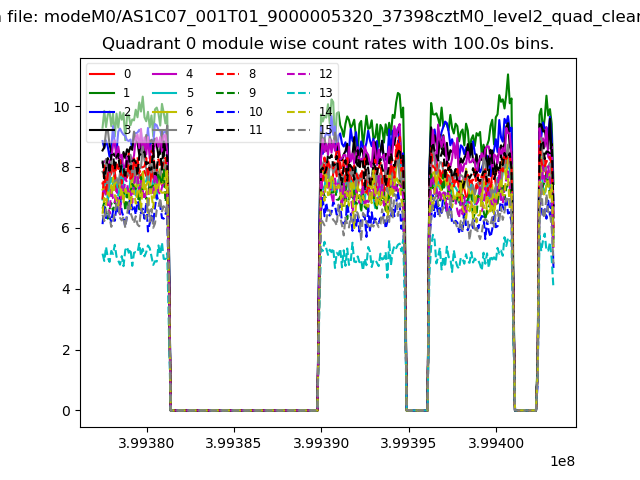 |
 |
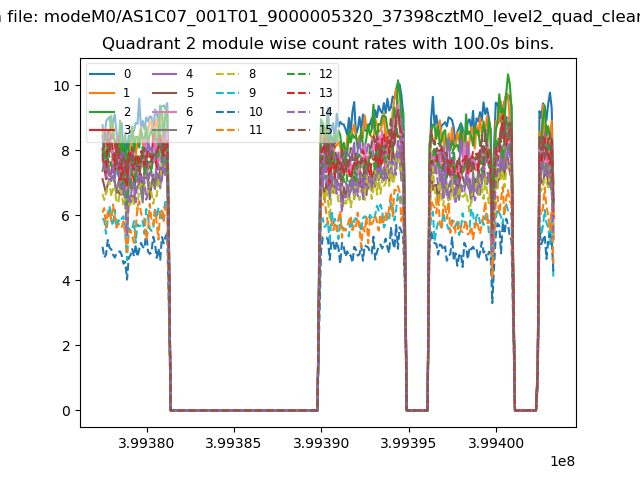
| Module-wise count rates for Quadrant B Data is divided into 100 sec bins |
 |
 |
| Module-wise count rates for Quadrant C Data is divided into 100 sec bins |
 |
 |
| Module-wise count rates for Quadrant D Data is divided into 100 sec bins |
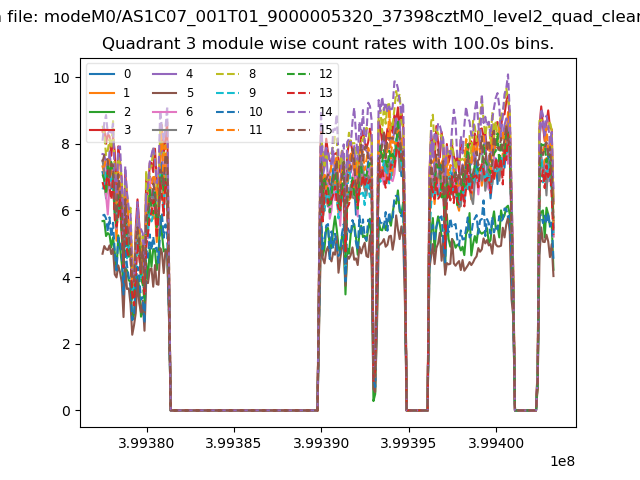 |
 |
| Parameter | Plot |
|---|---|
| CZT HV Monitor | 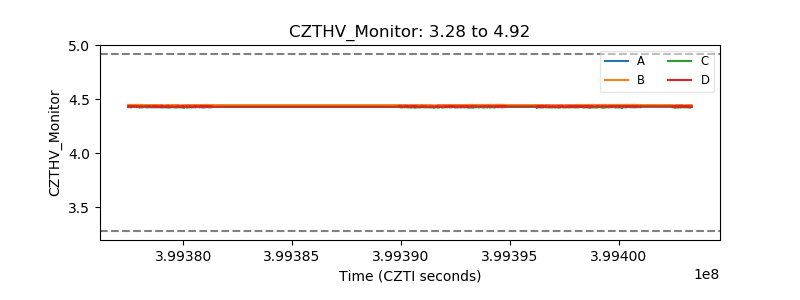 |
| D_VDD | 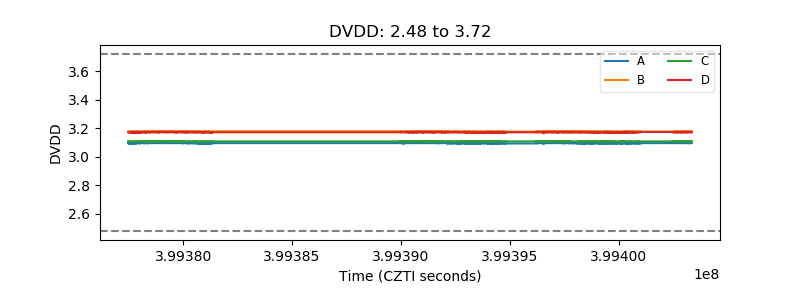 |
| Temperature 1 | 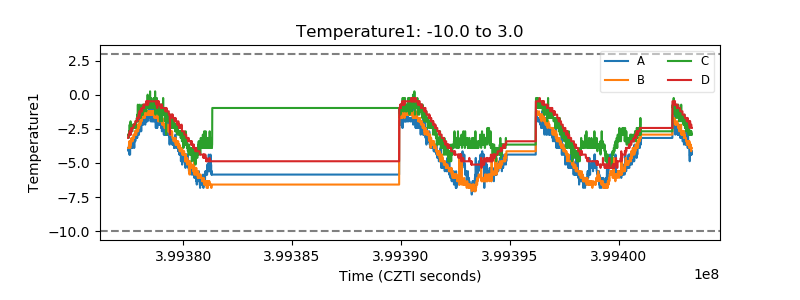 |
| Veto HV Monitor | 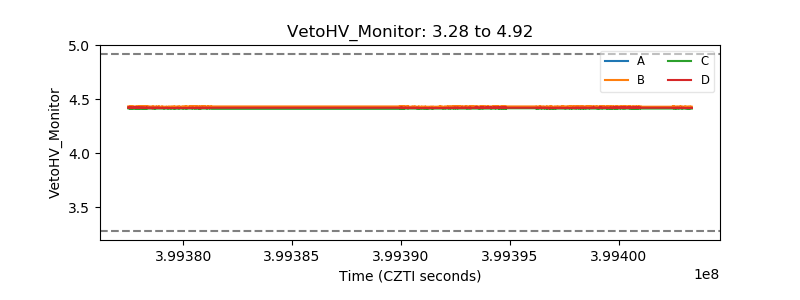 |
| Veto LLD | 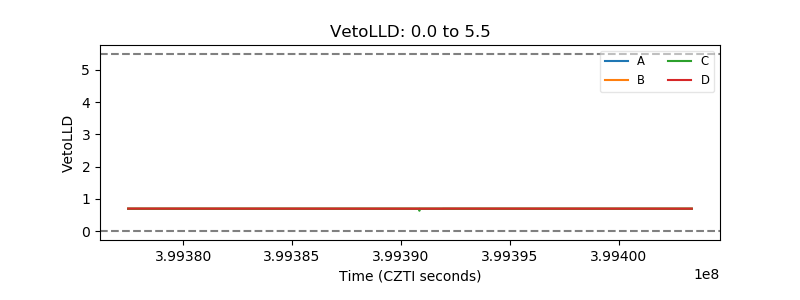 |
| Alpha Counter | 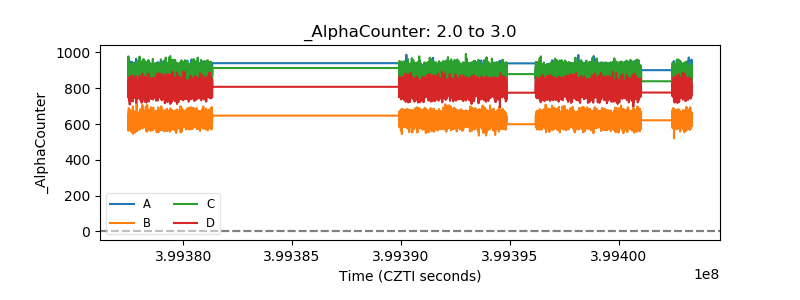 |
| _CPM_Rate | 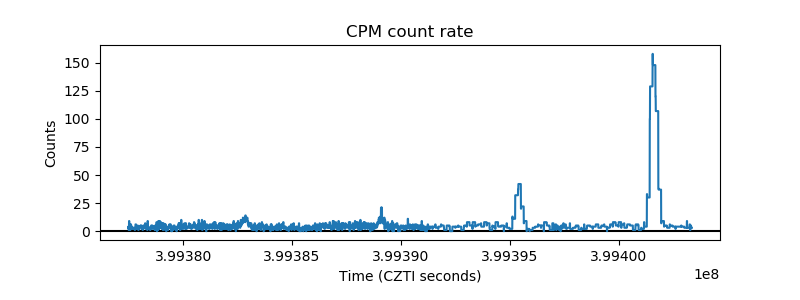 |
| CZT Counter | 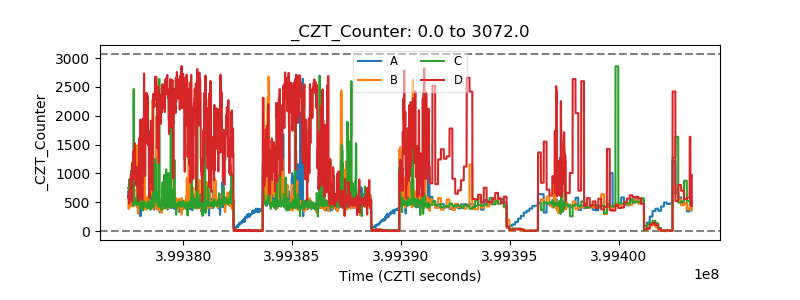 |
| +2.5 Volts monitor | 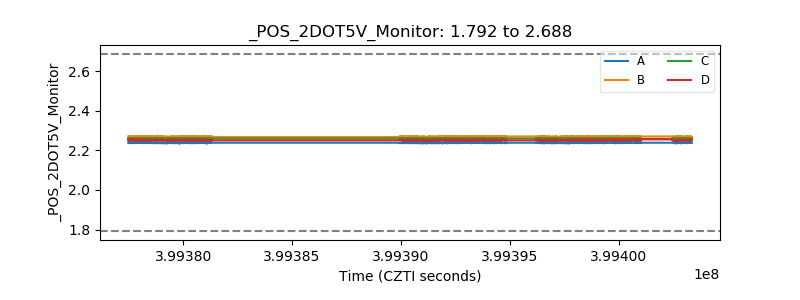 |
| +5 Volts monitor | 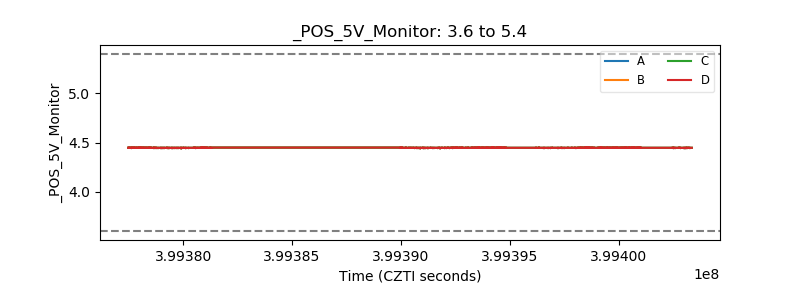 |
| _ROLL_ROT | 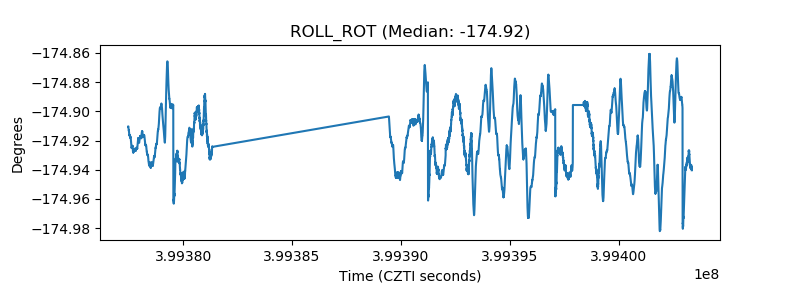 |
| _Roll_DEC |  |
| _Roll_RA | 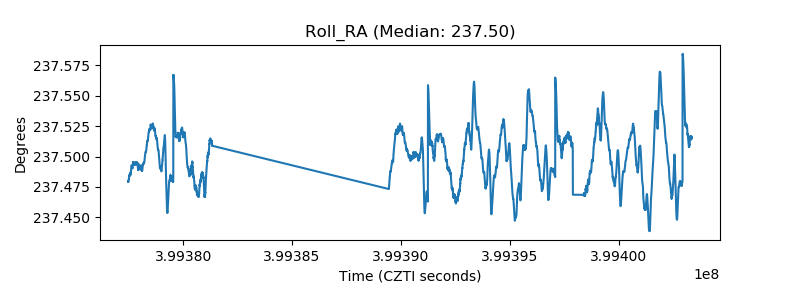 |
| Veto Counter | 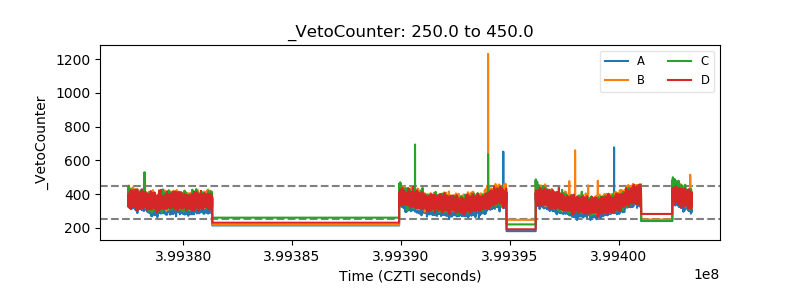 |