| Param | Original file | Final file |
|---|---|---|
| Filename | modeM0/AS1C07_001T01_9000005320_37399cztM0_level2.evt | modeM0/AS1C07_001T01_9000005320_37399cztM0_level2_quad_clean.evt |
| Size (bytes) | 2,305,307,520 | 443,816,640 |
| Size | 2.1 GB | 423.3 MB |
| Events in quadrant A | 12,653,455 | 3,034,631 |
| Events in quadrant B | 13,516,907 | 3,018,100 |
| Events in quadrant C | 13,732,862 | 2,968,568 |
| Events in quadrant D | 28,219,449 | 2,689,507 |
| Mode SS | |||
|---|---|---|---|
| Quadrant | BADHDUFLAG | Total packets | Discarded packets |
| A | 0 | 514 | 0 |
| B | 0 | 514 | 0 |
| C | 0 | 514 | 0 |
| D | 0 | 514 | 0 |
| Mode M0 | |||
|---|---|---|---|
| Quadrant | BADHDUFLAG | Total packets | Discarded packets |
| A | 0 | 54000 | 6 |
| B | 0 | 57043 | 5 |
| C | 0 | 56614 | 5 |
| D | 0 | 101261 | 5 |
| Mode M9 | |||
|---|---|---|---|
| Quadrant | BADHDUFLAG | Total packets | Discarded packets |
| A | 0 | 69 | 0 |
| B | 0 | 69 | 0 |
| C | 0 | 69 | 0 |
| D | 0 | 69 | 0 |
| Quadrant | Total seconds | Saturated seconds | Saturation percentage |
|---|---|---|---|
| A | 25166 | 98 | 0.389414% |
| B | 25166 | 410 | 1.629182% |
| C | 25166 | 348 | 1.382818% |
| D | 25166 | 4113 | 16.343479% |
Noise dominated data is calculated using 1-second bins in cleaned event files. If a bin has >2000 counts, and if more than 50% of those come from <1% of pixels, then it is considered to be noise-dominated and hence unusable.
| Quadrant | # 1 sec bins | Bins with >0 counts | Bins with >2000 counts | High rate bins dominated by noise | Noise dominated (total time) | Noise dominated (detector-on time) | Marked lightcurve |
|---|---|---|---|---|---|---|---|
| A | 32122 | 25171 | 65 | 65 | 0.20% | 0.26% | 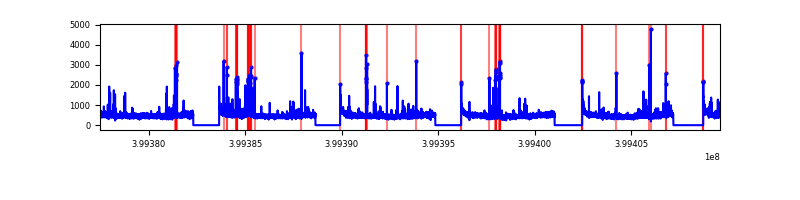 |
| B | 32122 | 25171 | 269 | 269 | 0.84% | 1.07% | 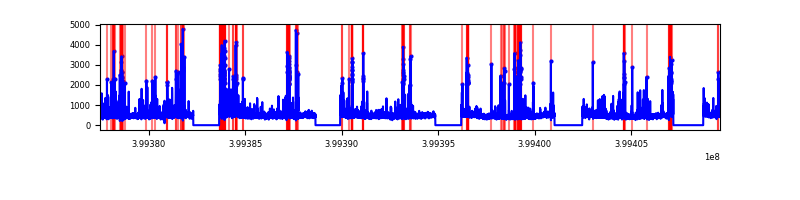 |
| C | 32122 | 25171 | 310 | 310 | 0.97% | 1.23% | 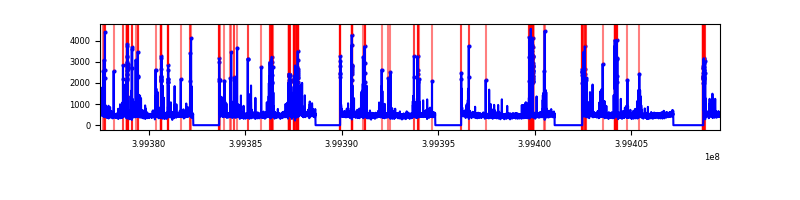 |
| D | 32122 | 25171 | 3961 | 3961 | 12.33% | 15.74% | 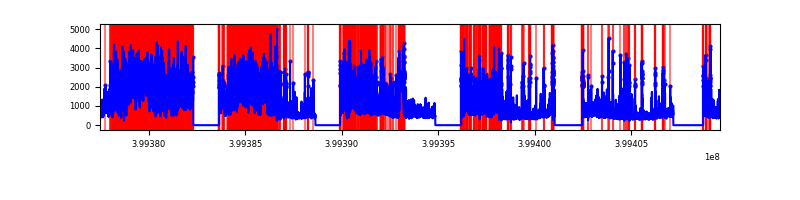 |
Top three noisy pixels from each quadrant. If the there are fewer than three noisy pixels in the level2.evt file, extra rows are filled as -1
| Pixel properties | Quadrant properties | ||||||
|---|---|---|---|---|---|---|---|
| Quadrant | DetID | PixID | Counts | Sigma | Mean | Median | Sigma |
| A | 10 | 83 | 1139911 | 2064.05 | 2763 | 2707 | 551.0 |
| A | 9 | 143 | 256925 | 461.41 | 2763 | 2707 | 551.0 |
| A | 2 | 79 | 218477 | 391.63 | 2763 | 2707 | 551.0 |
| B | 5 | 172 | 611696 | 1182.09 | 2734 | 2657 | 515.2 |
| B | 0 | 213 | 474475 | 915.75 | 2734 | 2657 | 515.2 |
| B | 4 | 171 | 359878 | 693.33 | 2734 | 2657 | 515.2 |
| C | 1 | 23 | 1430415 | 2315.37 | 2678 | 2698 | 616.6 |
| C | 15 | 214 | 1049029 | 1696.86 | 2678 | 2698 | 616.6 |
| C | 14 | 254 | 436182 | 702.99 | 2678 | 2698 | 616.6 |
| D | 12 | 235 | 12741561 | 20681.0 | 2553 | 2479 | 616.0 |
| D | 12 | 227 | 1270791 | 2059.01 | 2553 | 2479 | 616.0 |
| D | 13 | 249 | 1150627 | 1863.94 | 2553 | 2479 | 616.0 |
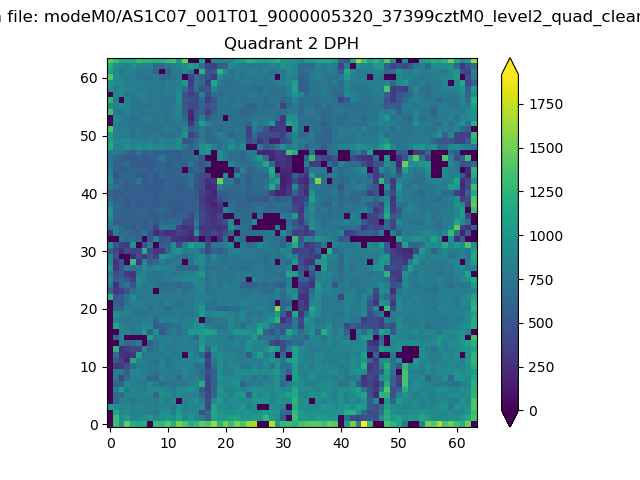
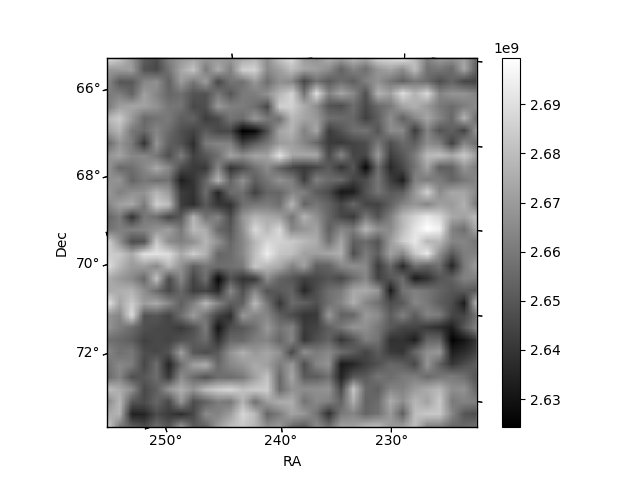
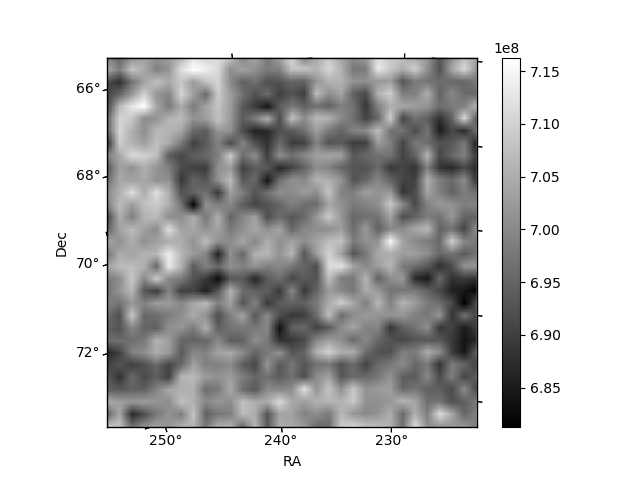
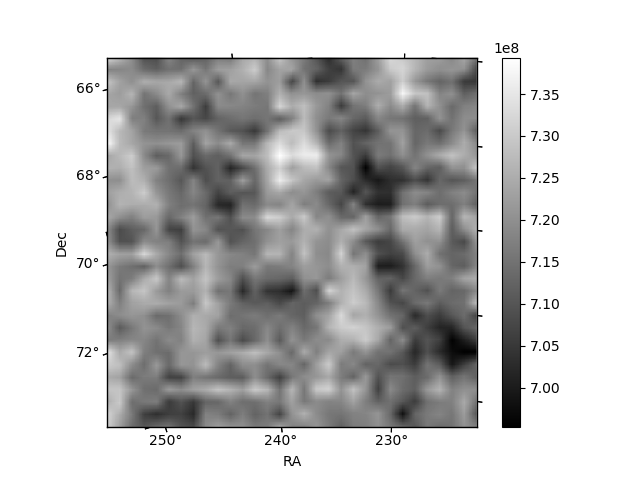
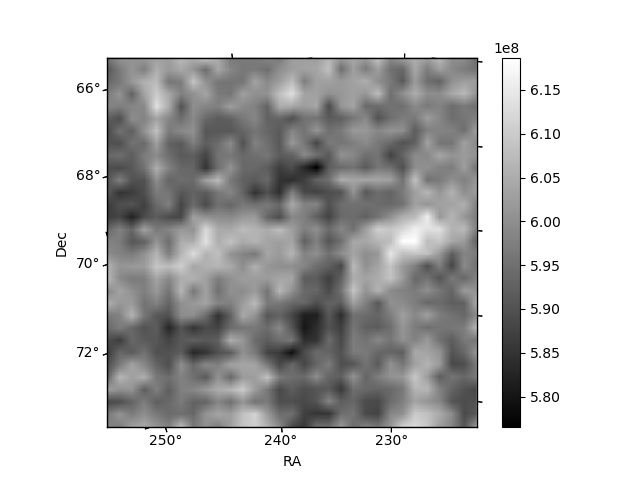
Histogram calculated using DETX and DETY for each event in the final _common_clean file
| Quadrant A | 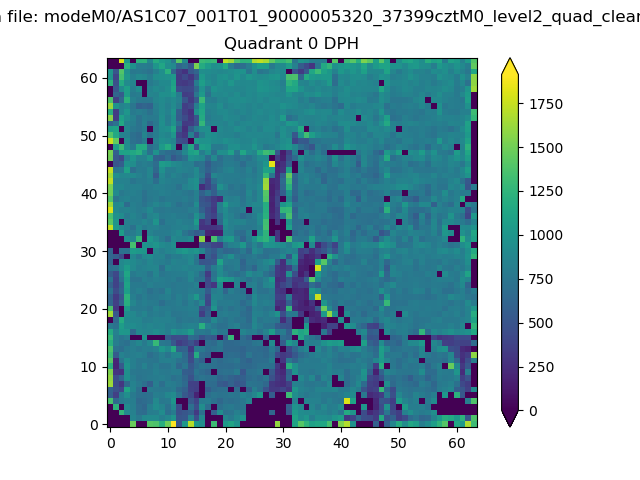 |
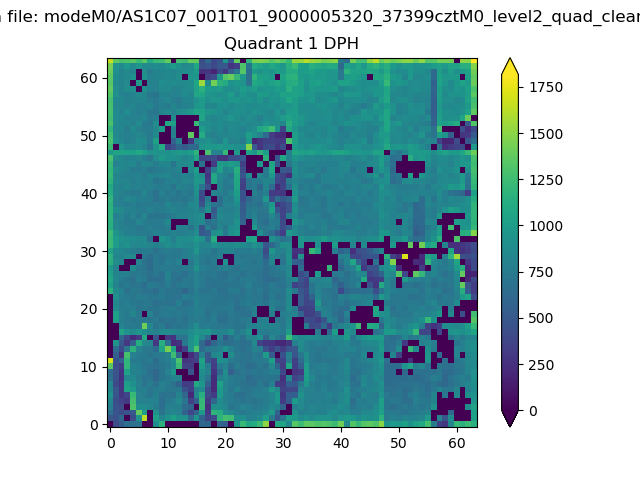 |
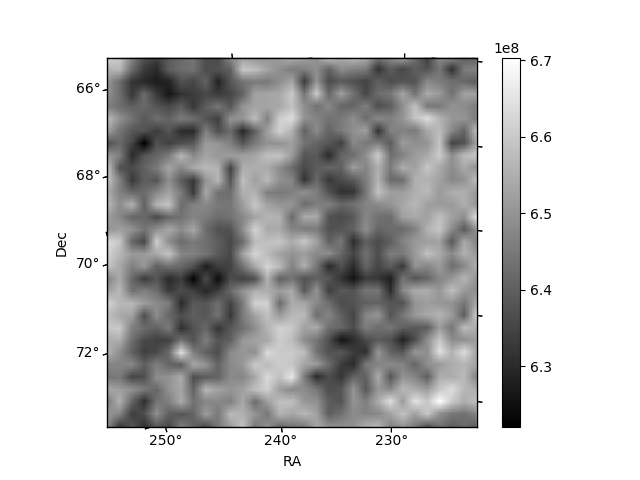
Quadrant B |
|---|---|---|---|
| Quadrant D | 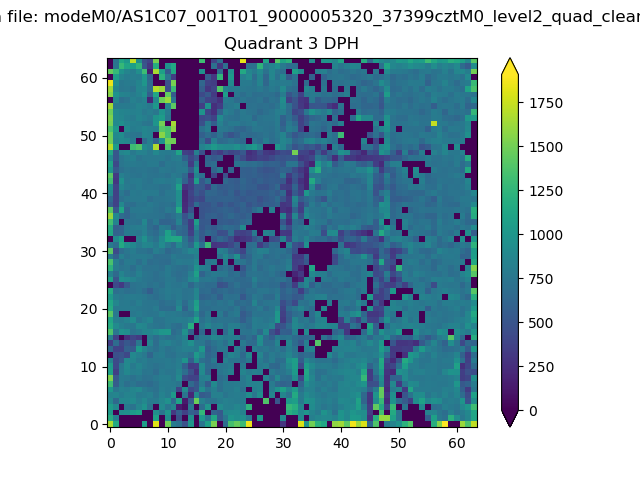 |
 |
Quadrant C |
| Plot type | Count rate plots | Images |
|---|---|---|
| Comparison with Poisson distribution Blue bars denote a histogram of data divided into 1 sec bins. Red curve is a Poisson curve with rate = median count rate of data. |
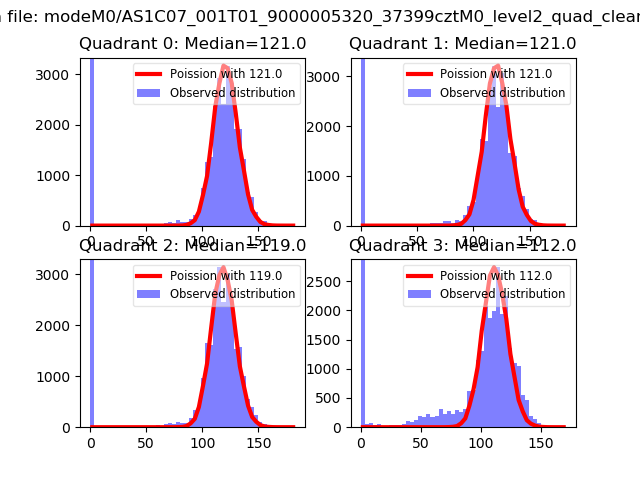 |
 |
| Quadrant-wise count rates Data is divided into 100 sec bins |
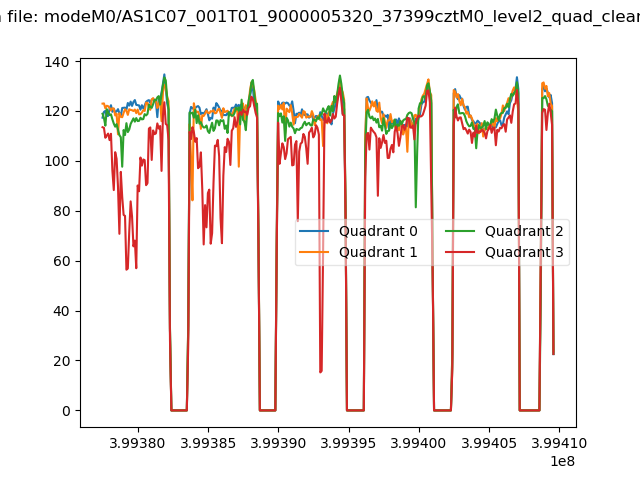 |
|
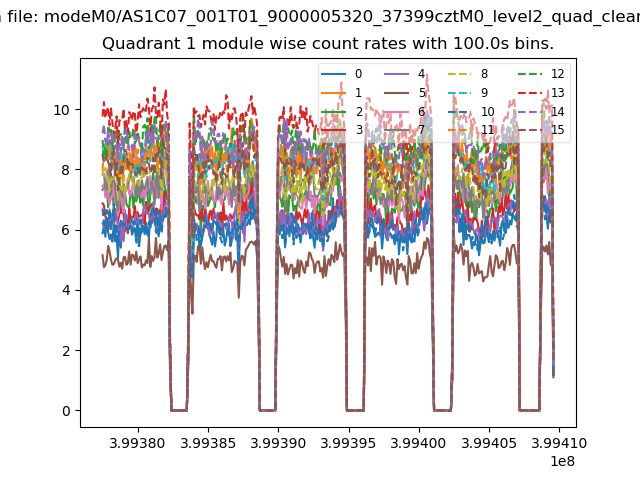
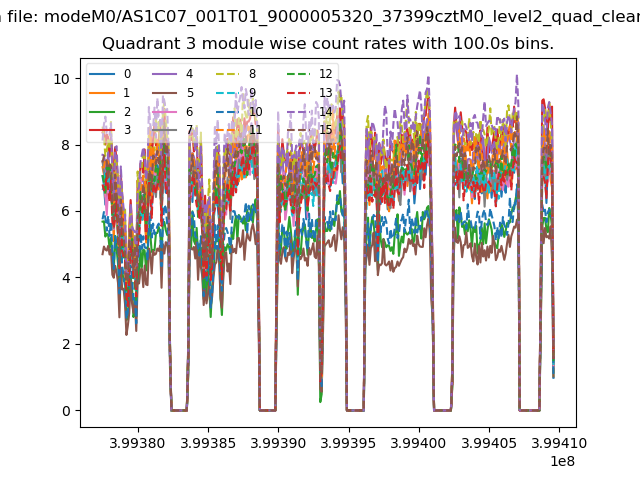
| Module-wise count rates for Quadrant A Data is divided into 100 sec bins |
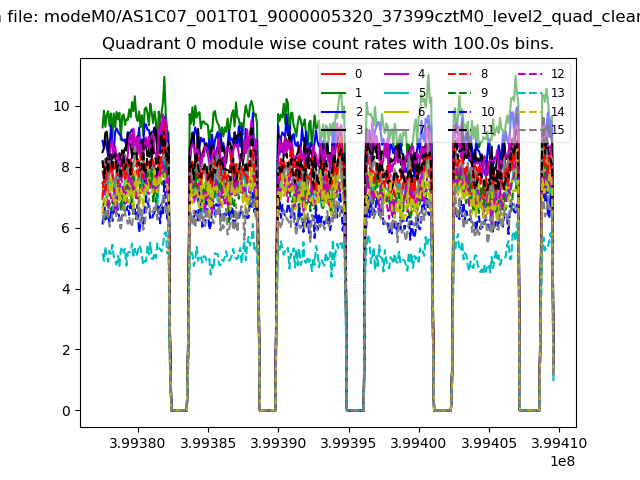 |
 |
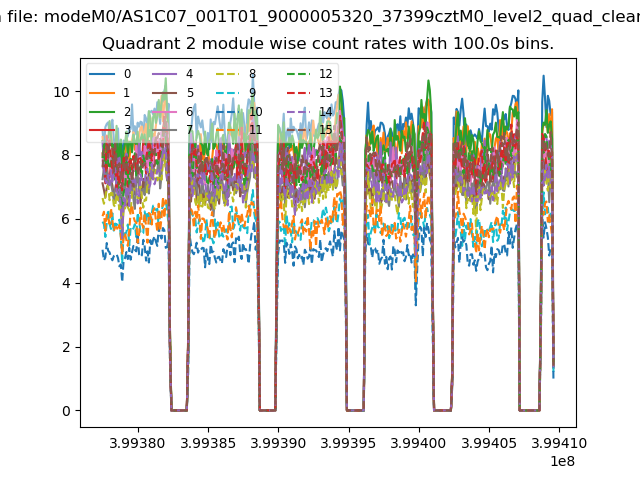
| Module-wise count rates for Quadrant B Data is divided into 100 sec bins |
 |
 |
| Module-wise count rates for Quadrant C Data is divided into 100 sec bins |
 |
 |
| Module-wise count rates for Quadrant D Data is divided into 100 sec bins |
 |
 |
| Parameter | Plot |
|---|---|
| CZT HV Monitor | 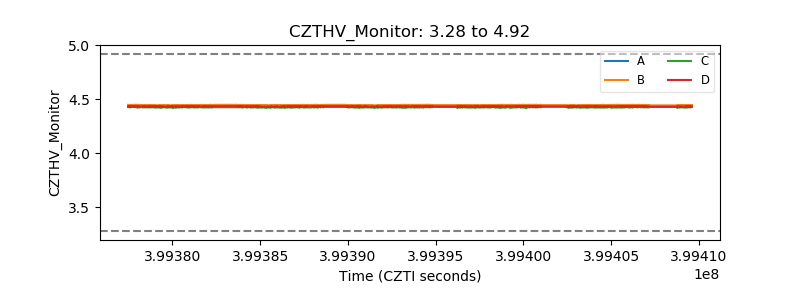 |
| D_VDD | 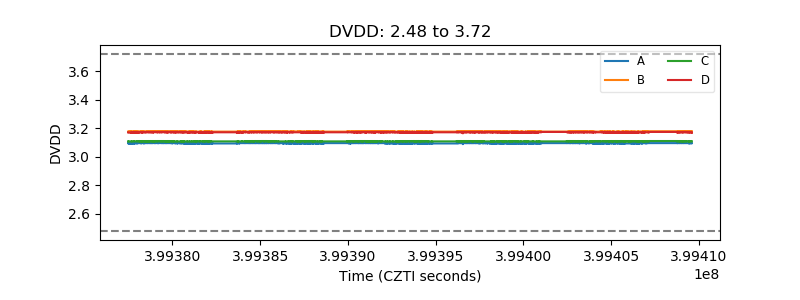 |
| Temperature 1 | 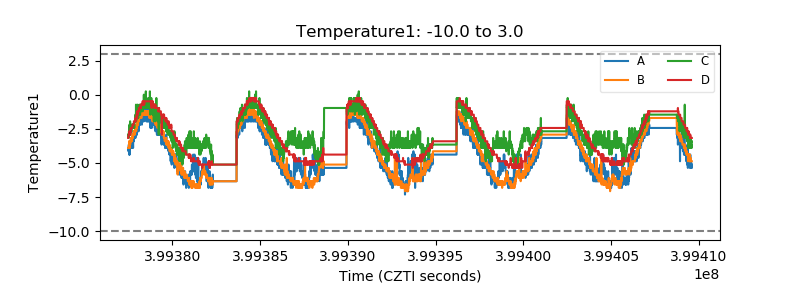 |
| Veto HV Monitor | 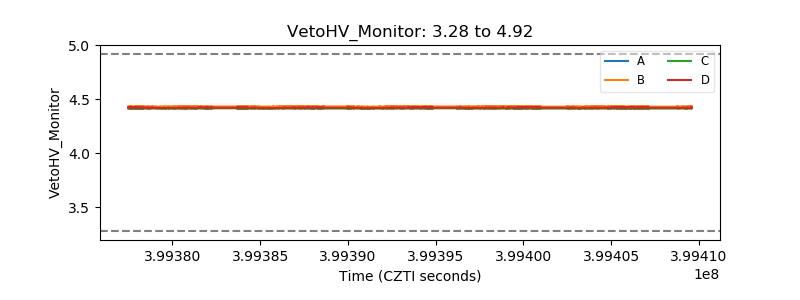 |
| Veto LLD | 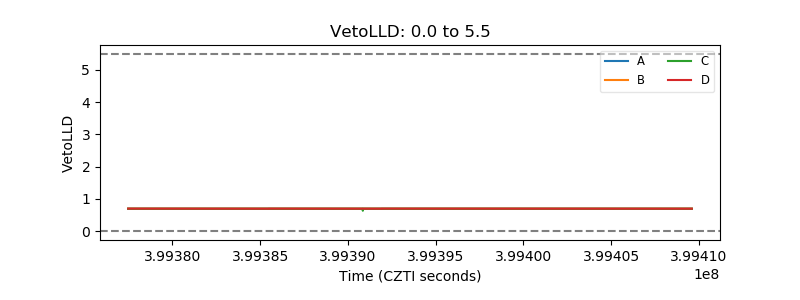 |
| Alpha Counter | 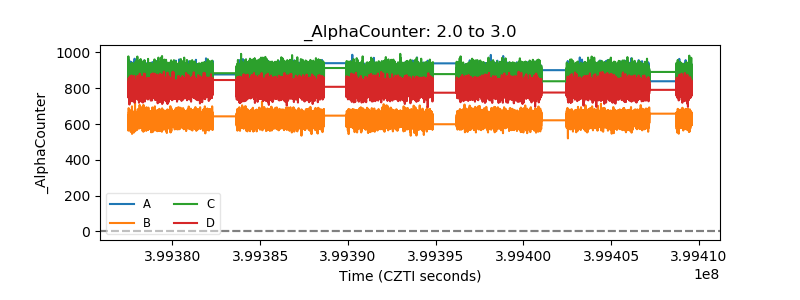 |
| _CPM_Rate | 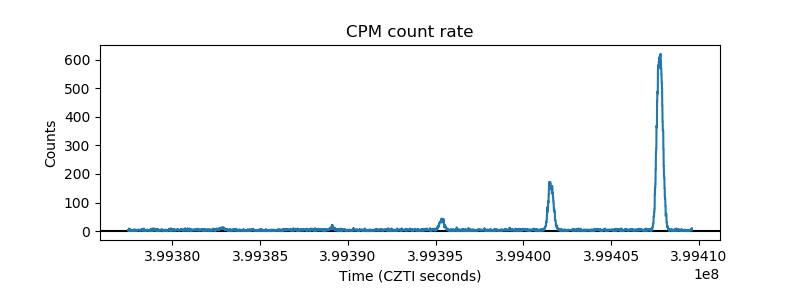 |
| CZT Counter |  |
| +2.5 Volts monitor | 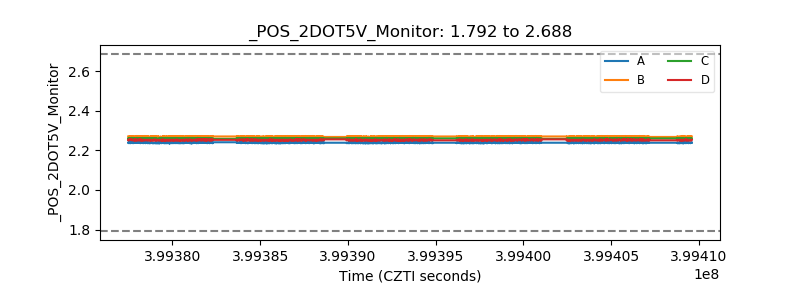 |
| +5 Volts monitor | 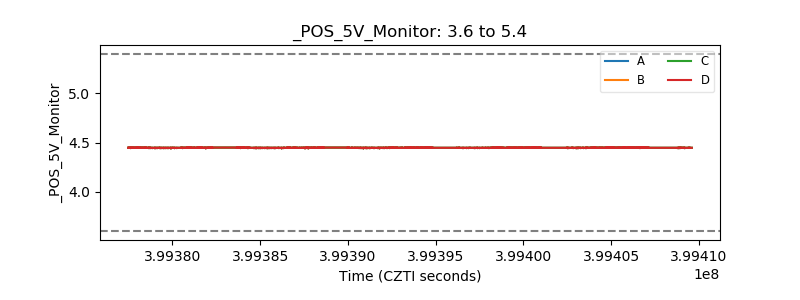 |
| _ROLL_ROT | 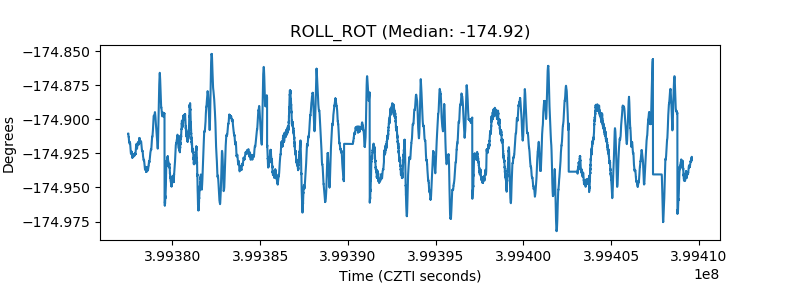 |
| _Roll_DEC | 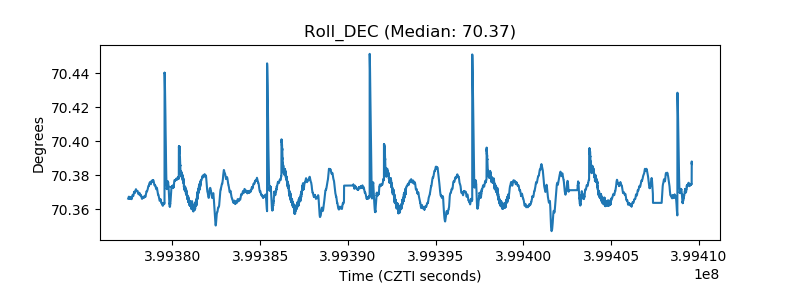 |
| _Roll_RA | 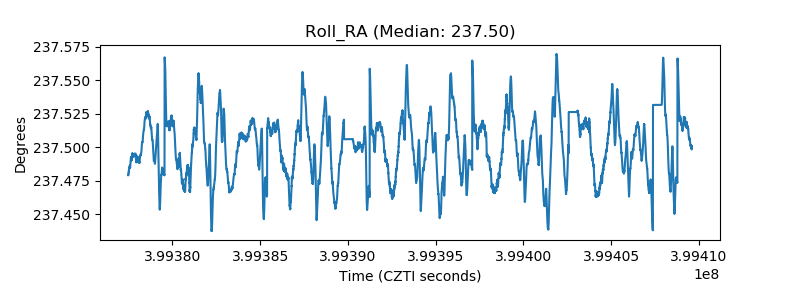 |
| Veto Counter | 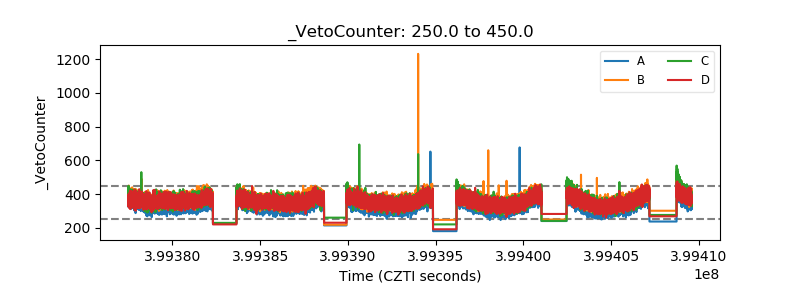 |