| Param | Original file | Final file |
|---|---|---|
| Filename | modeM0/AS1A09_002T01_9000005322cztM0_level2.fits | modeM0/AS1A09_002T01_9000005322cztM0_level2_quad_clean.evt |
| Size (bytes) | 2,125,307,520 | 2,548,425,600 |
| Size | 2.0 GB | 2.4 GB |
| Events in quadrant A | 12,943,137 | 16,087,513 |
| Events in quadrant B | 12,274,652 | 15,859,701 |
| Events in quadrant C | 12,687,794 | 15,771,910 |
| Events in quadrant D | 10,891,412 | 13,911,357 |
| Mode M0 | |||
|---|---|---|---|
| Quadrant | BADHDUFLAG | Total packets | Discarded packets |
| A | 0 | 536739 | 0 |
| B | 0 | 564988 | 0 |
| C | 0 | 547392 | 0 |
| D | 0 | 693485 | 0 |
| Mode M9 | |||
|---|---|---|---|
| Quadrant | BADHDUFLAG | Total packets | Discarded packets |
| A | 0 | 878 | 0 |
| B | 0 | 877 | 0 |
| C | 0 | 878 | 0 |
| D | 0 | 878 | 0 |
| Mode SS | |||
|---|---|---|---|
| Quadrant | BADHDUFLAG | Total packets | Discarded packets |
| A | 0 | 4658 | 0 |
| B | 0 | 4661 | 0 |
| C | 0 | 4652 | 0 |
| D | 0 | 4658 | 0 |
| Quadrant | Total seconds | Saturated seconds | Saturation percentage |
|---|---|---|---|
| A | 227086 | 5144 | 2.265221% |
| B | 227065 | 9833 | 4.330478% |
| C | 227190 | 8418 | 3.705269% |
| D | 226832 | 13796 | 6.082034% |
Noise dominated data is calculated using 1-second bins in cleaned event files. If a bin has >2000 counts, and if more than 50% of those come from <1% of pixels, then it is considered to be noise-dominated and hence unusable.
| Quadrant | # 1 sec bins | Bins with >0 counts | Bins with >2000 counts | High rate bins dominated by noise | Noise dominated (total time) | Noise dominated (detector-on time) | Marked lightcurve |
|---|---|---|---|---|---|---|---|
| A | 319918 | 227633 | 0 | 0 | 0.00% | 0.00% |  |
| B | 319918 | 226950 | 0 | 0 | 0.00% | 0.00% |  |
| C | 319918 | 226244 | 0 | 0 | 0.00% | 0.00% | 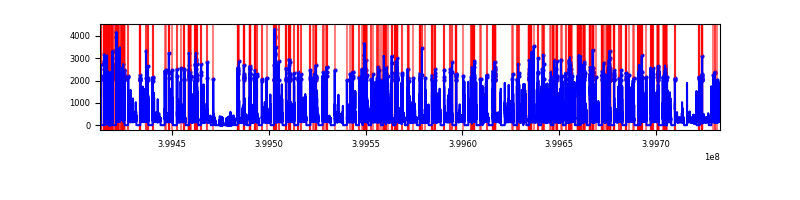 |
| D | 319918 | 227175 | 0 | 0 | 0.00% | 0.00% |  |
Top three noisy pixels from each quadrant. If the there are fewer than three noisy pixels in the level2.evt file, extra rows are filled as -1
| Pixel properties | Quadrant properties | ||||||
|---|---|---|---|---|---|---|---|
| Quadrant | DetID | PixID | Counts | Sigma | Mean | Median | Sigma |
| A | 9 | 19 | 10720 | 9.06 | 3392 | 3207 | 829.1 |
| A | 7 | 110 | 10493 | 8.79 | 3392 | 3207 | 829.1 |
| A | 0 | 29 | 10454 | 8.74 | 3392 | 3207 | 829.1 |
| B | 2 | 9 | 10674 | 12.14 | 3261 | 3133 | 621.2 |
| B | 3 | 80 | 9616 | 10.44 | 3261 | 3133 | 621.2 |
| B | 2 | 8 | 8653 | 8.89 | 3261 | 3133 | 621.2 |
| C | 1 | 81 | 10905 | 9.18 | 3359 | 3174 | 842.6 |
| C | 1 | 80 | 10434 | 8.62 | 3359 | 3174 | 842.6 |
| C | 3 | 202 | 10102 | 8.22 | 3359 | 3174 | 842.6 |
| D | 10 | 189 | 8007 | 6.23 | 3127 | 2868 | 825.5 |
| D | 7 | 3 | 7926 | 6.13 | 3127 | 2868 | 825.5 |
| D | 6 | 38 | 7865 | 6.05 | 3127 | 2868 | 825.5 |
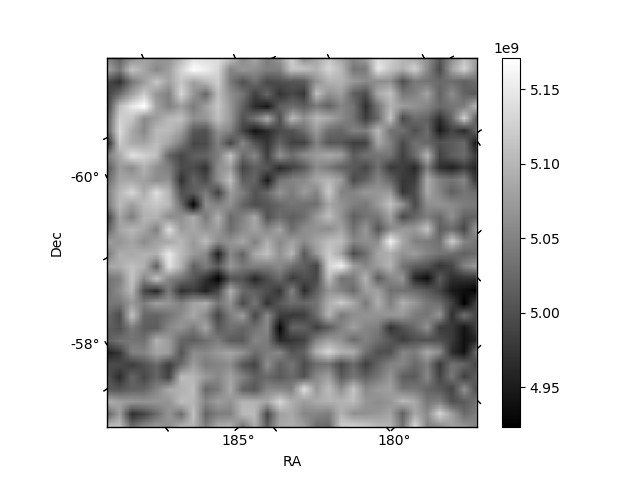
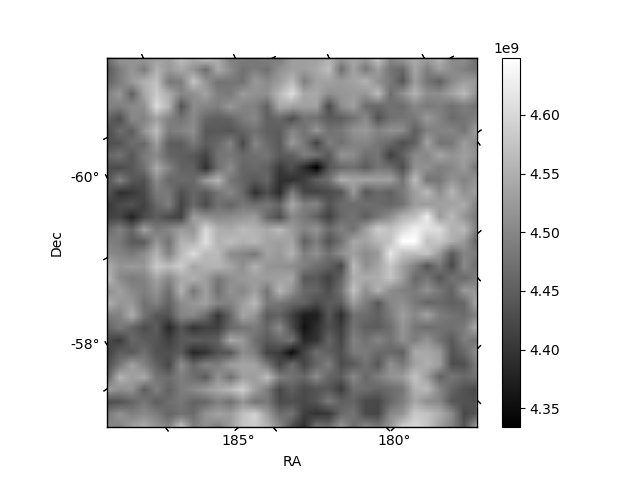
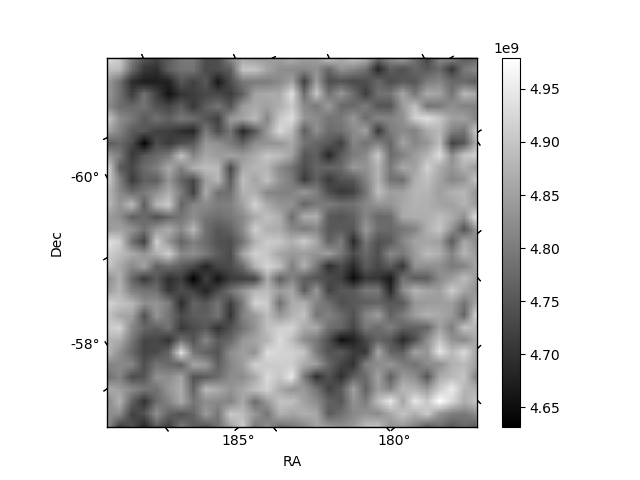
Histogram calculated using DETX and DETY for each event in the final _common_clean file
| Quadrant A | 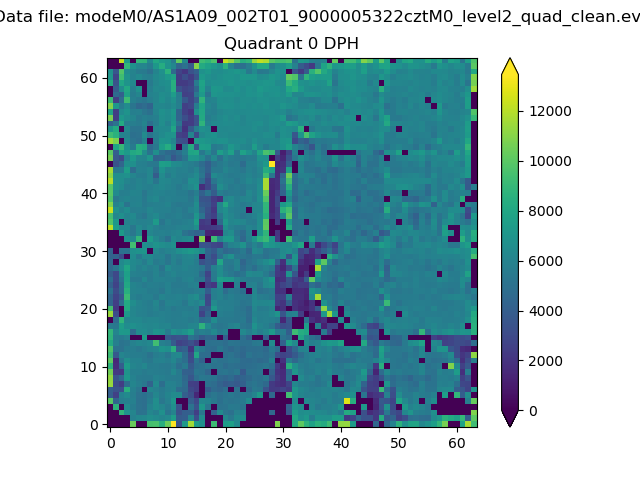 |
 |
Quadrant B |
|---|---|---|---|
| Quadrant D |  |
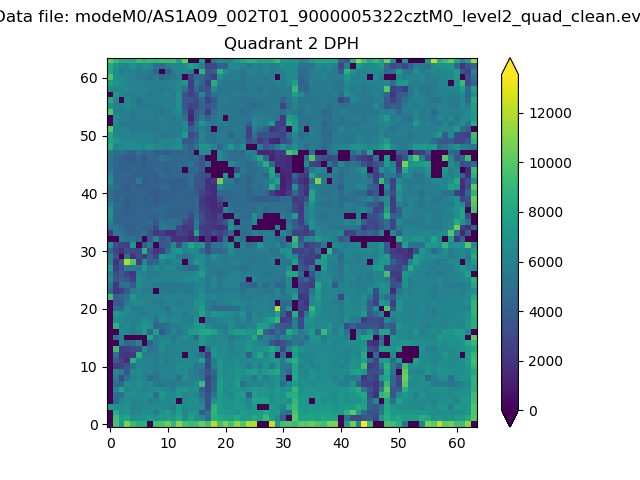 |
Quadrant C |
| Plot type | Count rate plots | Images |
|---|---|---|
| Comparison with Poisson distribution Blue bars denote a histogram of data divided into 1 sec bins. Red curve is a Poisson curve with rate = median count rate of data. |
 |
 |
| Quadrant-wise count rates Data is divided into 100 sec bins |
 |
|
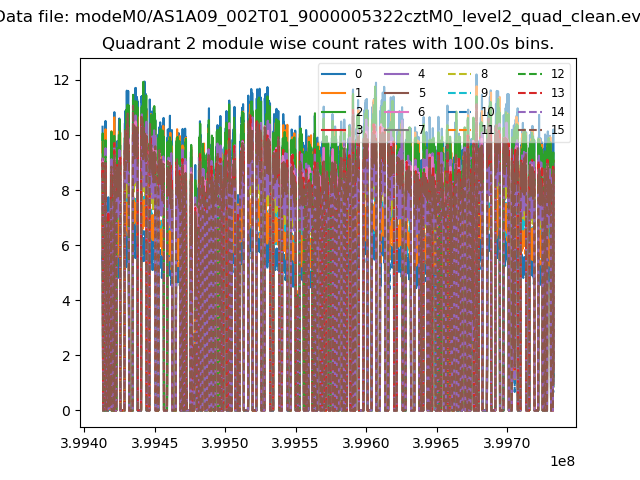
| Module-wise count rates for Quadrant A Data is divided into 100 sec bins |
 |
 |
| Module-wise count rates for Quadrant B Data is divided into 100 sec bins |
 |
 |
| Module-wise count rates for Quadrant C Data is divided into 100 sec bins |
 |
 |
| Module-wise count rates for Quadrant D Data is divided into 100 sec bins |
 |
 |
| Parameter | Plot |
|---|---|
| CZT HV Monitor |  |
| D_VDD |  |
| Temperature 1 | 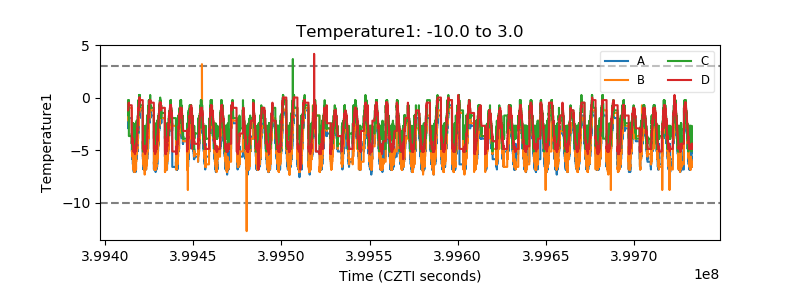 |
| Veto HV Monitor |  |
| Veto LLD |  |
| Alpha Counter | 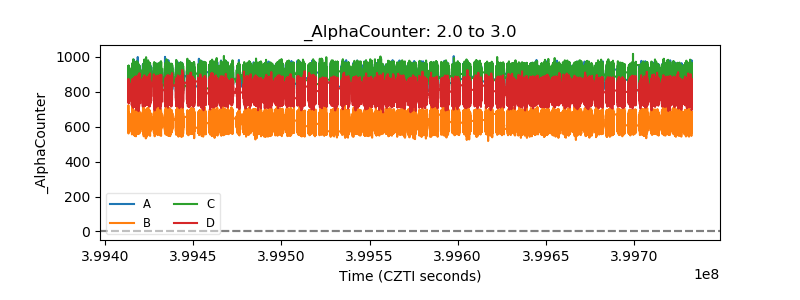 |
| _CPM_Rate |  |
| CZT Counter |  |
| +2.5 Volts monitor | 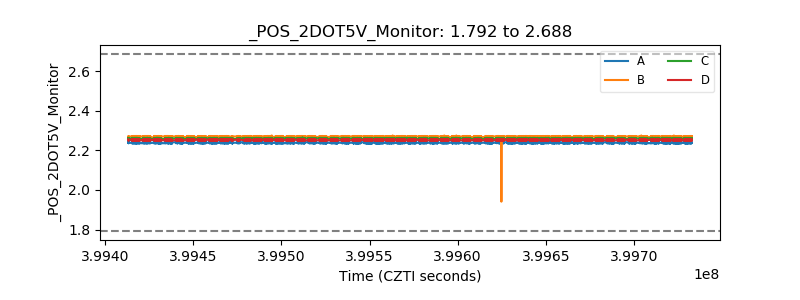 |
| +5 Volts monitor | 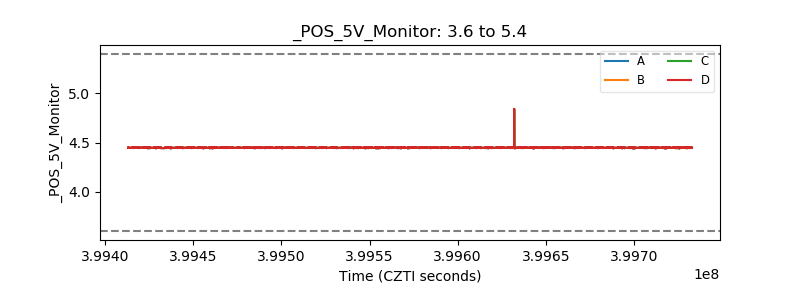 |
| _ROLL_ROT |  |
| _Roll_DEC |  |
| _Roll_RA |  |
| Veto Counter |  |