| Param | Original file | Final file |
|---|---|---|
| Filename | modeM0/AS1A09_002T01_9000005322_37400cztM0_level2.evt | modeM0/AS1A09_002T01_9000005322_37400cztM0_level2_quad_clean.evt |
| Size (bytes) | 119,445,120 | 20,021,760 |
| Size | 113.9 MB | 19.1 MB |
| Events in quadrant A | 651,590 | 137,231 |
| Events in quadrant B | 653,278 | 138,031 |
| Events in quadrant C | 1,486,365 | 111,298 |
| Events in quadrant D | 745,452 | 132,177 |
| Mode M0 | |||
|---|---|---|---|
| Quadrant | BADHDUFLAG | Total packets | Discarded packets |
| A | 0 | 2619 | 2 |
| B | 0 | 2645 | 1 |
| C | 0 | 5144 | 1 |
| D | 0 | 2959 | 1 |
| Mode M9 | |||
|---|---|---|---|
| Quadrant | BADHDUFLAG | Total packets | Discarded packets |
| A | 0 | 16 | 0 |
| B | 0 | 16 | 0 |
| C | 0 | 16 | 0 |
| D | 0 | 16 | 0 |
| Mode SS | |||
|---|---|---|---|
| Quadrant | BADHDUFLAG | Total packets | Discarded packets |
| A | 0 | 26 | 0 |
| B | 0 | 26 | 0 |
| C | 0 | 26 | 0 |
| D | 0 | 26 | 0 |
| Quadrant | Total seconds | Saturated seconds | Saturation percentage |
|---|---|---|---|
| A | 1141 | 6 | 0.525855% |
| B | 1141 | 25 | 2.191060% |
| C | 1141 | 374 | 32.778265% |
| D | 1141 | 37 | 3.242770% |
Noise dominated data is calculated using 1-second bins in cleaned event files. If a bin has >2000 counts, and if more than 50% of those come from <1% of pixels, then it is considered to be noise-dominated and hence unusable.
| Quadrant | # 1 sec bins | Bins with >0 counts | Bins with >2000 counts | High rate bins dominated by noise | Noise dominated (total time) | Noise dominated (detector-on time) | Marked lightcurve |
|---|---|---|---|---|---|---|---|
| A | 2813 | 1142 | 3 | 3 | 0.11% | 0.26% |  |
| B | 2813 | 1142 | 12 | 12 | 0.43% | 1.05% |  |
| C | 2812 | 1140 | 309 | 309 | 10.99% | 27.11% |  |
| D | 2813 | 1142 | 31 | 31 | 1.10% | 2.71% |  |
Top three noisy pixels from each quadrant. If the there are fewer than three noisy pixels in the level2.evt file, extra rows are filled as -1
| Pixel properties | Quadrant properties | ||||||
|---|---|---|---|---|---|---|---|
| Quadrant | DetID | PixID | Counts | Sigma | Mean | Median | Sigma |
| A | 10 | 83 | 100084 | 3423.81 | 135 | 132 | 29.2 |
| A | 2 | 79 | 9015 | 304.28 | 135 | 132 | 29.2 |
| A | 9 | 143 | 6024 | 201.83 | 135 | 132 | 29.2 |
| B | 5 | 172 | 68904 | 2477.38 | 134 | 130 | 27.8 |
| B | 0 | 229 | 41806 | 1501.24 | 134 | 130 | 27.8 |
| B | 0 | 190 | 5573 | 196.05 | 134 | 130 | 27.8 |
| C | 1 | 23 | 938941 | 35867.75 | 107 | 108 | 26.2 |
| C | 0 | 10 | 62873 | 2397.91 | 107 | 108 | 26.2 |
| C | 15 | 214 | 43590 | 1661.21 | 107 | 108 | 26.2 |
| D | 2 | 250 | 63651 | 1908.48 | 128 | 124 | 33.3 |
| D | 1 | 47 | 48459 | 1452.08 | 128 | 124 | 33.3 |
| D | 12 | 235 | 43613 | 1306.5 | 128 | 124 | 33.3 |
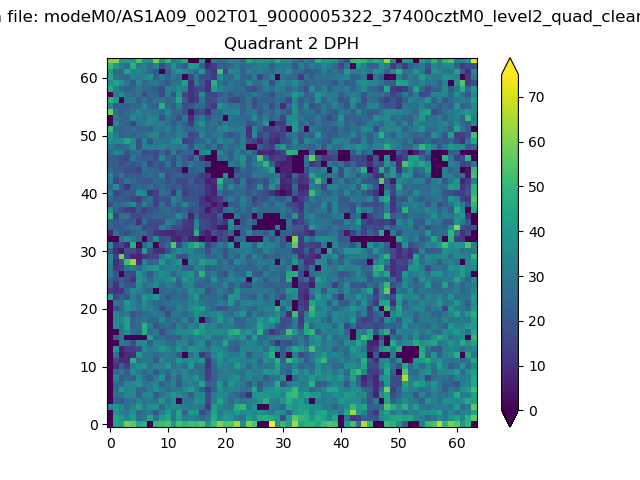
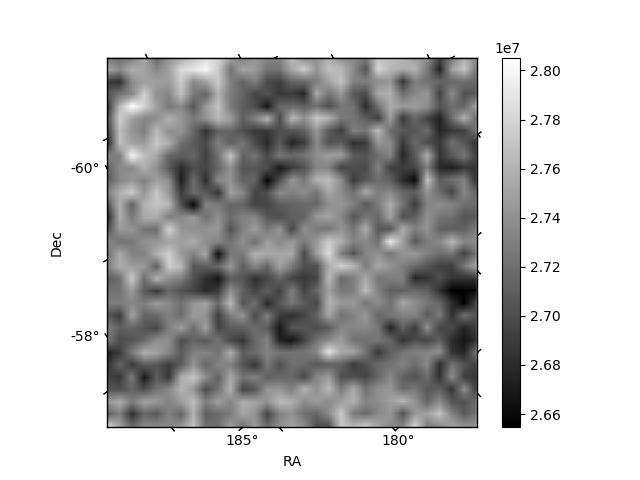
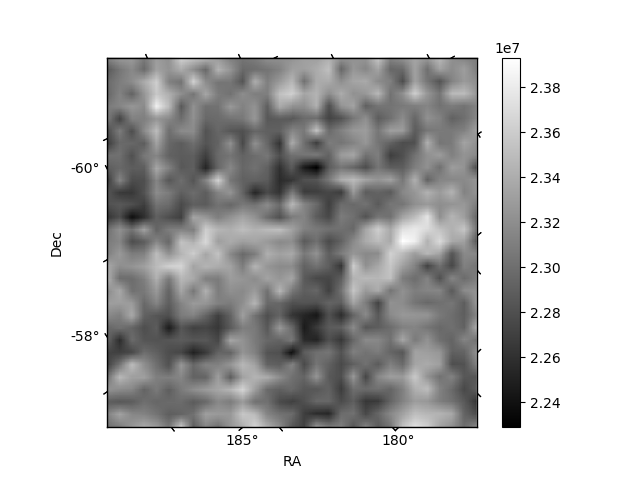
Histogram calculated using DETX and DETY for each event in the final _common_clean file
| Quadrant A | 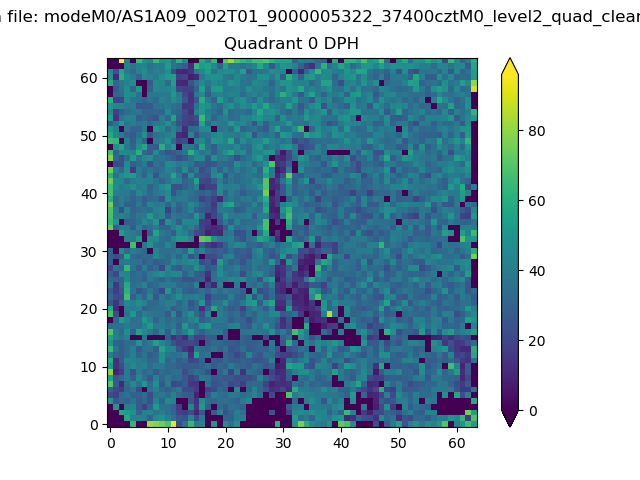 |
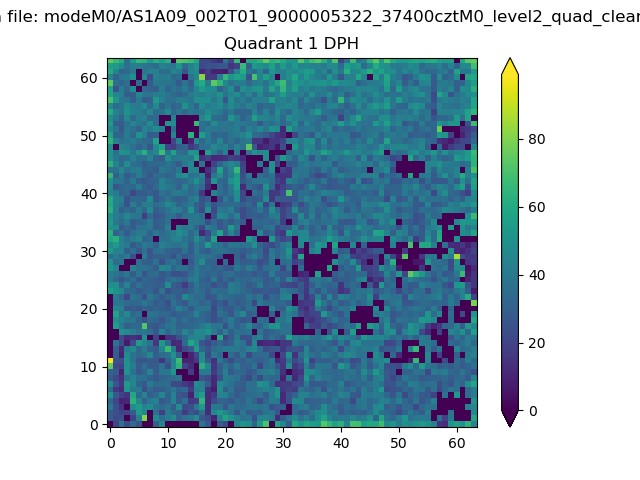 |
Quadrant B |
|---|---|---|---|
| Quadrant D | 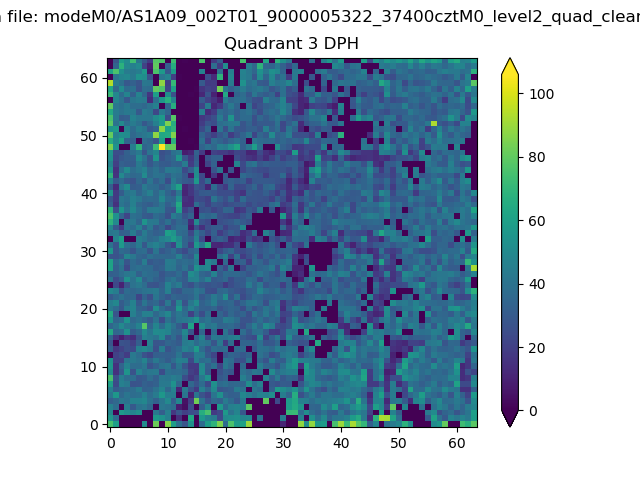 |
 |
Quadrant C |
| Plot type | Count rate plots | Images |
|---|---|---|
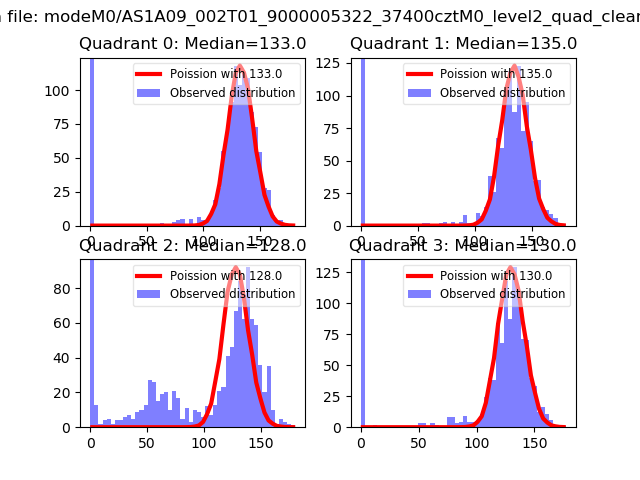
| Comparison with Poisson distribution Blue bars denote a histogram of data divided into 1 sec bins. Red curve is a Poisson curve with rate = median count rate of data. |
 |
 |
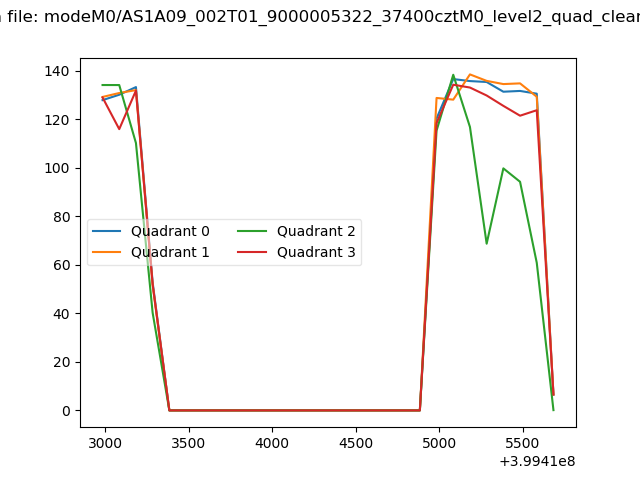
| Quadrant-wise count rates Data is divided into 100 sec bins |
 |
|
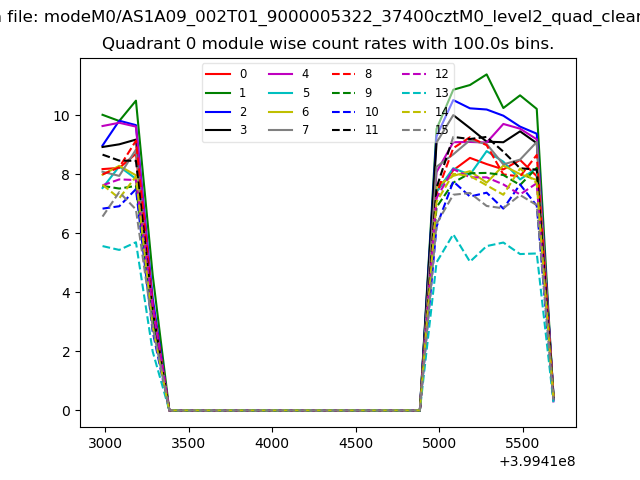
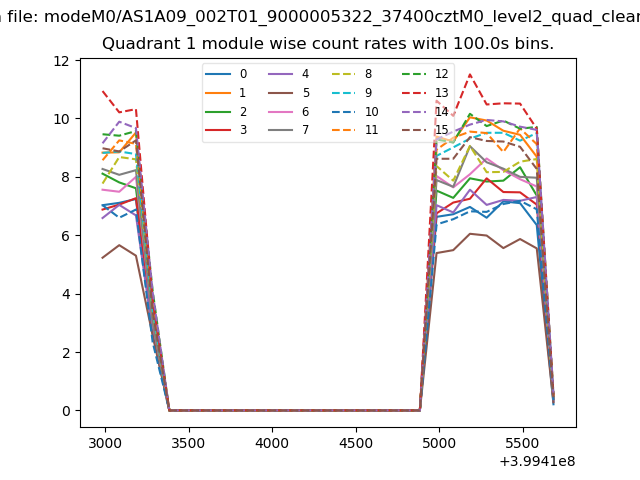
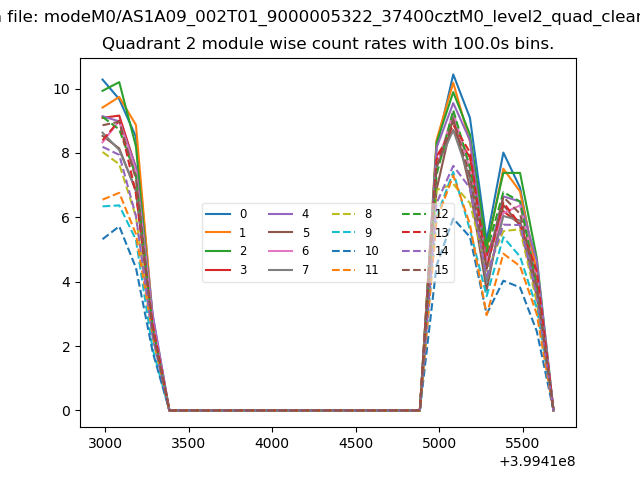
| Module-wise count rates for Quadrant A Data is divided into 100 sec bins |
 |
 |
| Module-wise count rates for Quadrant B Data is divided into 100 sec bins |
 |
 |
| Module-wise count rates for Quadrant C Data is divided into 100 sec bins |
 |
 |
| Module-wise count rates for Quadrant D Data is divided into 100 sec bins |
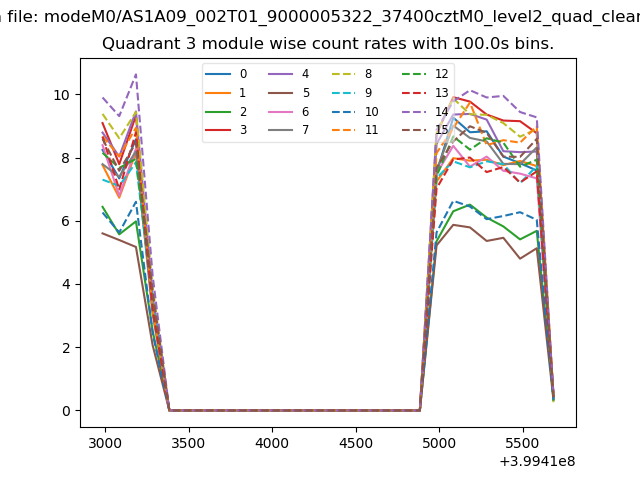 |
 |
| Parameter | Plot |
|---|---|
| CZT HV Monitor | 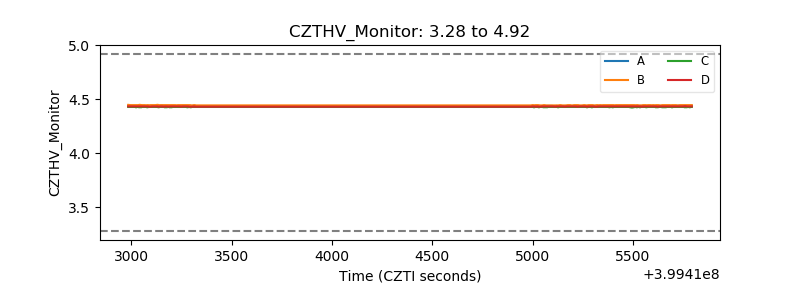 |
| D_VDD | 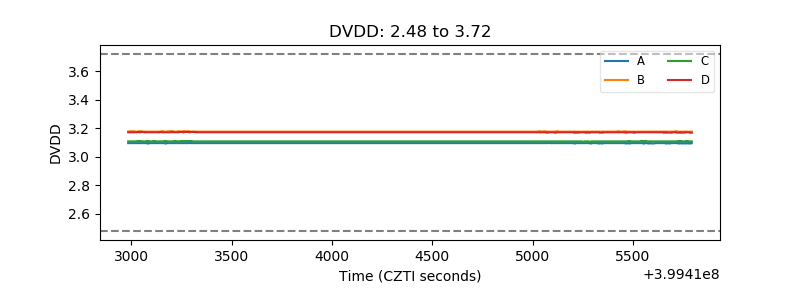 |
| Temperature 1 | 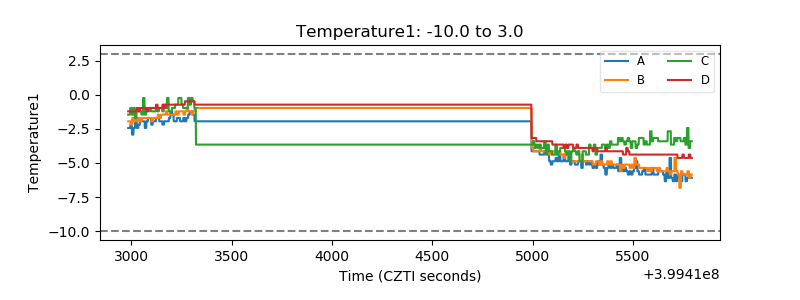 |
| Veto HV Monitor |  |
| Veto LLD | 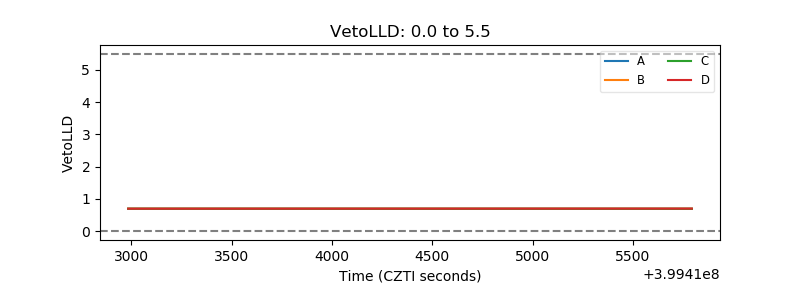 |
| Alpha Counter | 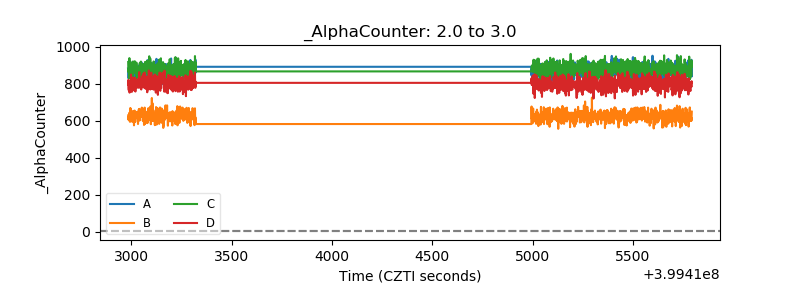 |
| _CPM_Rate | 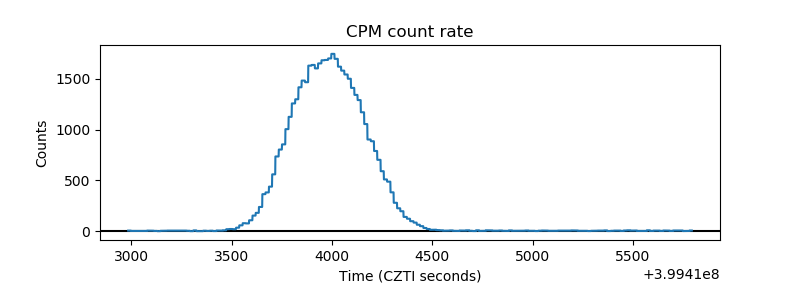 |
| CZT Counter | 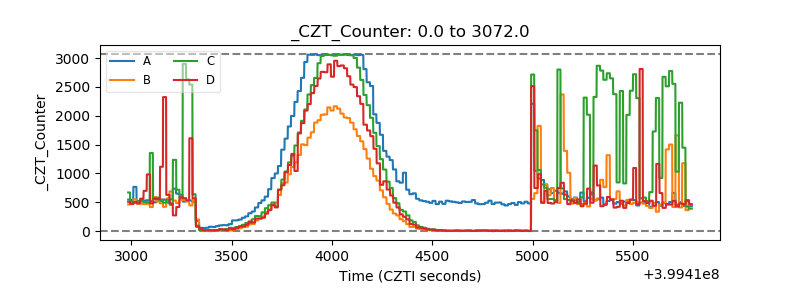 |
| +2.5 Volts monitor | 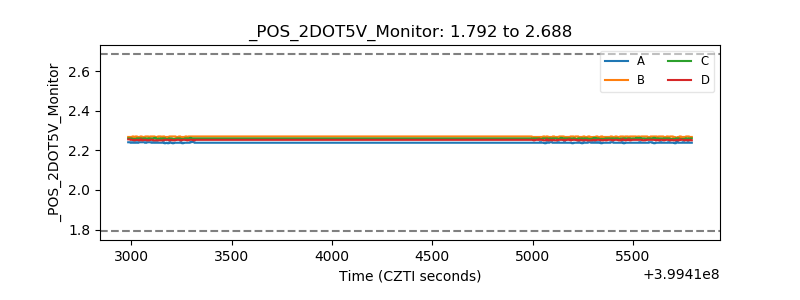 |
| +5 Volts monitor | 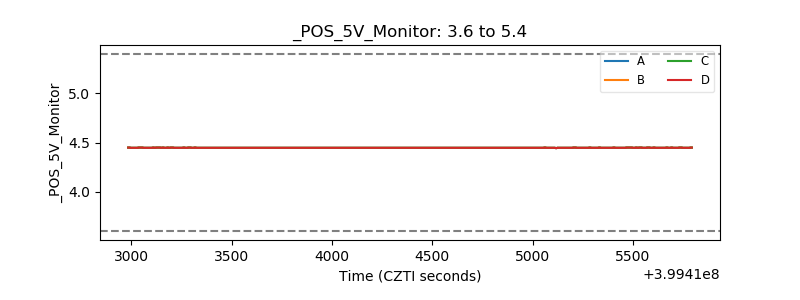 |
| _ROLL_ROT | 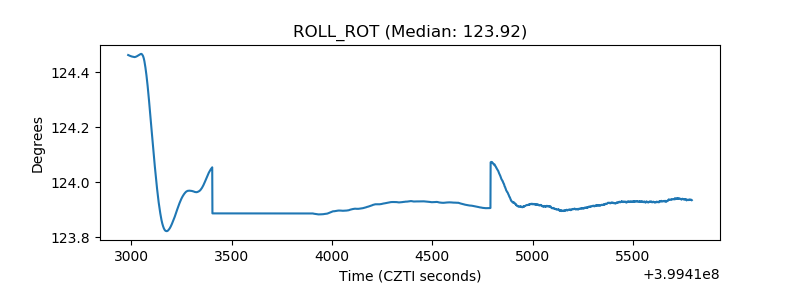 |
| _Roll_DEC | 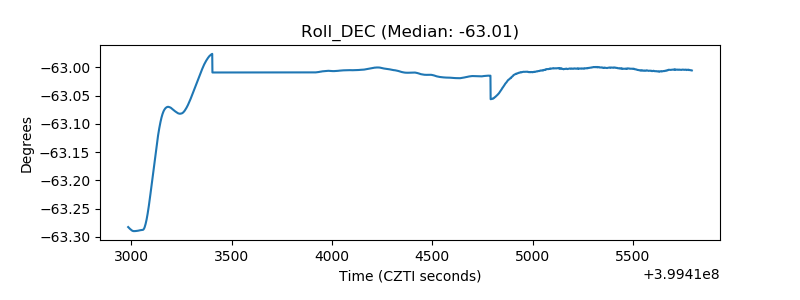 |
| _Roll_RA | 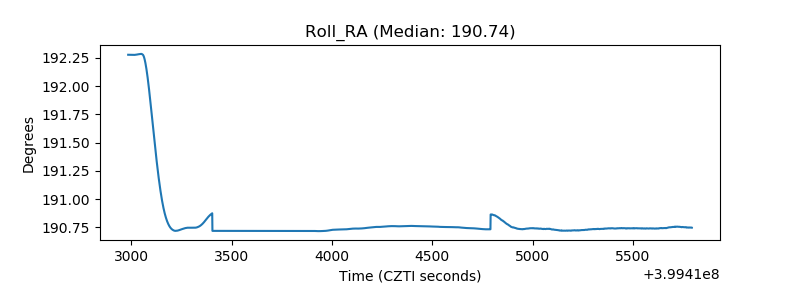 |
| Veto Counter | 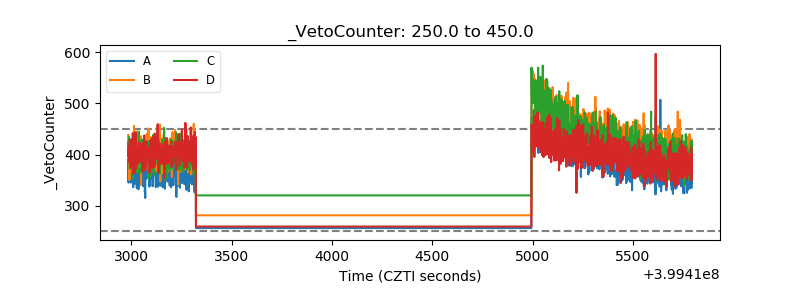 |