| Param | Original file | Final file |
|---|---|---|
| Filename | modeM0/AS1A09_002T01_9000005322_37402cztM0_level2.evt | modeM0/AS1A09_002T01_9000005322_37402cztM0_level2_quad_clean.evt |
| Size (bytes) | 653,469,120 | 62,432,640 |
| Size | 623.2 MB | 59.5 MB |
| Events in quadrant A | 2,787,490 | 441,779 |
| Events in quadrant B | 2,742,804 | 451,341 |
| Events in quadrant C | 9,681,069 | 208,968 |
| Events in quadrant D | 4,217,153 | 413,121 |
| Mode M0 | |||
|---|---|---|---|
| Quadrant | BADHDUFLAG | Total packets | Discarded packets |
| A | 0 | 11641 | 3 |
| B | 0 | 11578 | 2 |
| C | 0 | 32336 | 2 |
| D | 0 | 16135 | 2 |
| Mode M9 | |||
|---|---|---|---|
| Quadrant | BADHDUFLAG | Total packets | Discarded packets |
| A | 0 | 28 | 0 |
| B | 0 | 28 | 0 |
| C | 0 | 28 | 0 |
| D | 0 | 29 | 0 |
| Mode SS | |||
|---|---|---|---|
| Quadrant | BADHDUFLAG | Total packets | Discarded packets |
| A | 0 | 110 | 0 |
| B | 0 | 110 | 0 |
| C | 0 | 110 | 0 |
| D | 0 | 110 | 0 |
| Quadrant | Total seconds | Saturated seconds | Saturation percentage |
|---|---|---|---|
| A | 5336 | 28 | 0.524738% |
| B | 5336 | 49 | 0.918291% |
| C | 5336 | 3454 | 64.730135% |
| D | 5336 | 313 | 5.865817% |
Noise dominated data is calculated using 1-second bins in cleaned event files. If a bin has >2000 counts, and if more than 50% of those come from <1% of pixels, then it is considered to be noise-dominated and hence unusable.
| Quadrant | # 1 sec bins | Bins with >0 counts | Bins with >2000 counts | High rate bins dominated by noise | Noise dominated (total time) | Noise dominated (detector-on time) | Marked lightcurve |
|---|---|---|---|---|---|---|---|
| A | 7128 | 5337 | 20 | 20 | 0.28% | 0.37% | 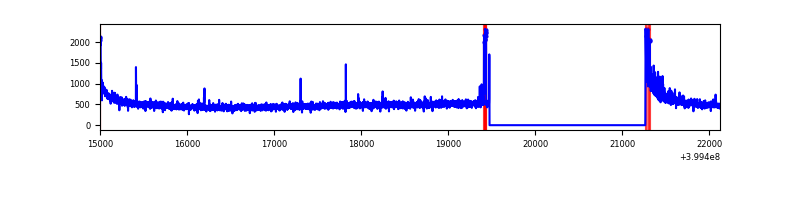 |
| B | 7127 | 5336 | 21 | 21 | 0.29% | 0.39% | 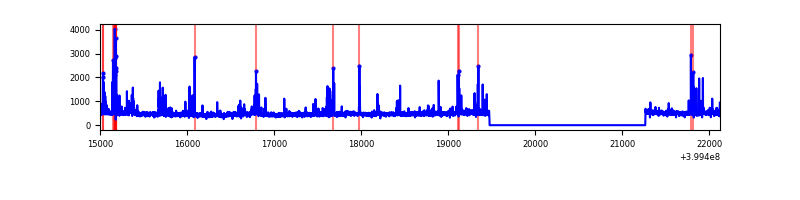 |
| C | 7128 | 5336 | 2735 | 2735 | 38.37% | 51.26% | 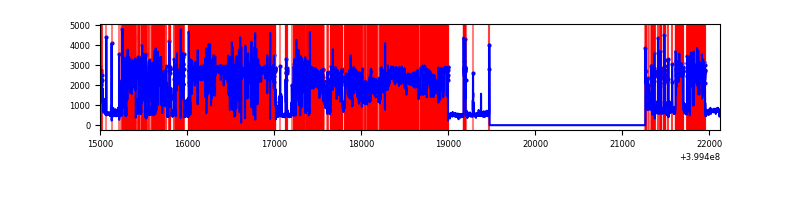 |
| D | 7128 | 5337 | 258 | 258 | 3.62% | 4.83% | 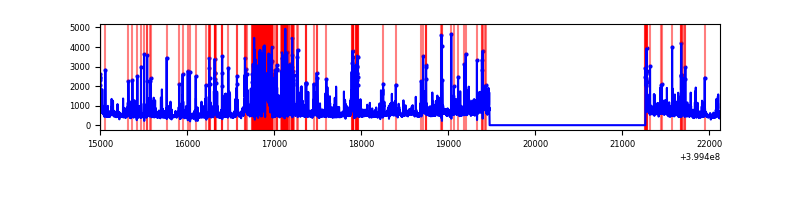 |
Top three noisy pixels from each quadrant. If the there are fewer than three noisy pixels in the level2.evt file, extra rows are filled as -1
| Pixel properties | Quadrant properties | ||||||
|---|---|---|---|---|---|---|---|
| Quadrant | DetID | PixID | Counts | Sigma | Mean | Median | Sigma |
| A | 10 | 83 | 278296 | 2278.74 | 609 | 597 | 121.9 |
| A | 15 | 222 | 77807 | 633.57 | 609 | 597 | 121.9 |
| A | 13 | 248 | 28705 | 230.65 | 609 | 597 | 121.9 |
| B | 5 | 172 | 183602 | 1588.0 | 608 | 593 | 115.2 |
| B | 0 | 229 | 80442 | 692.86 | 608 | 593 | 115.2 |
| B | 0 | 190 | 28490 | 242.07 | 608 | 593 | 115.2 |
| C | 1 | 23 | 8186721 | 114660.41 | 308 | 310 | 71.4 |
| C | 15 | 214 | 124951 | 1745.75 | 308 | 310 | 71.4 |
| C | 0 | 10 | 105552 | 1474.04 | 308 | 310 | 71.4 |
| D | 1 | 47 | 738327 | 5247.14 | 578 | 562 | 140.6 |
| D | 12 | 235 | 380662 | 2703.35 | 578 | 562 | 140.6 |
| D | 13 | 249 | 206042 | 1461.42 | 578 | 562 | 140.6 |
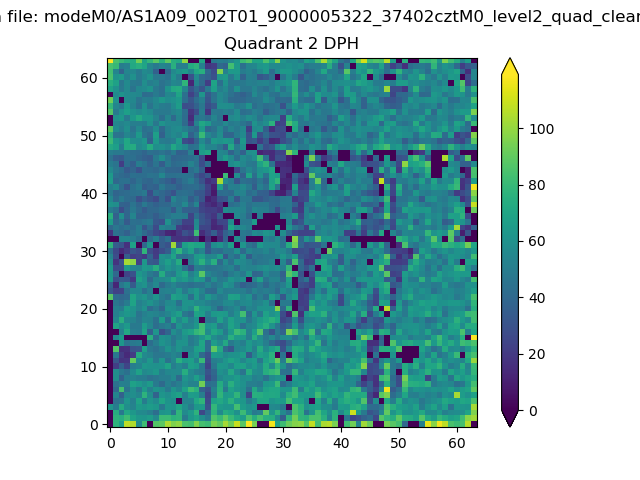
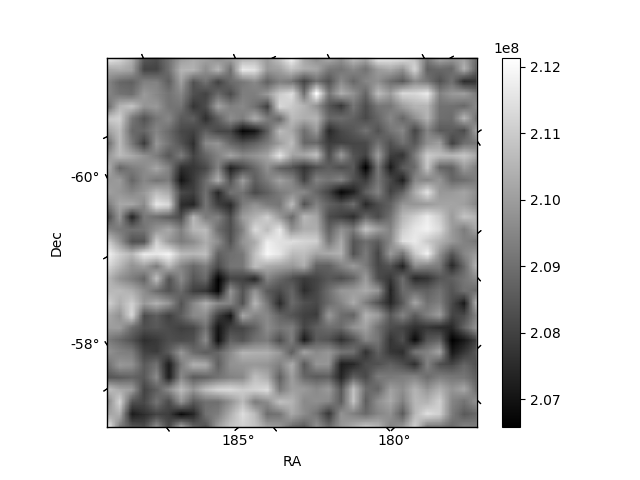
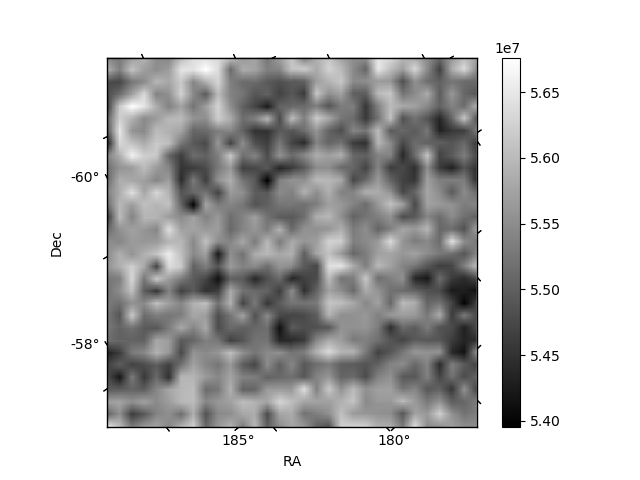
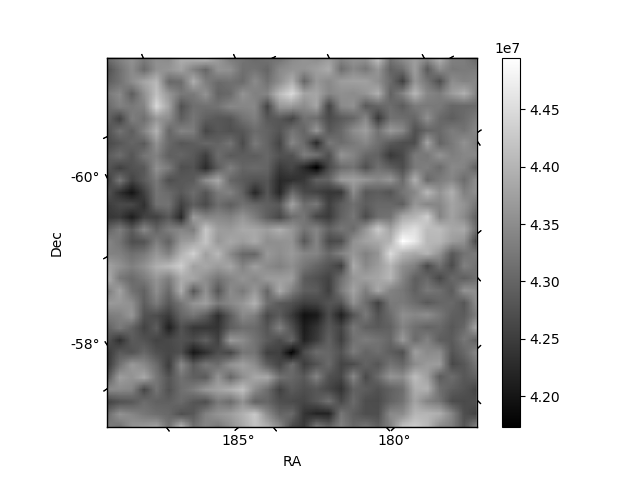
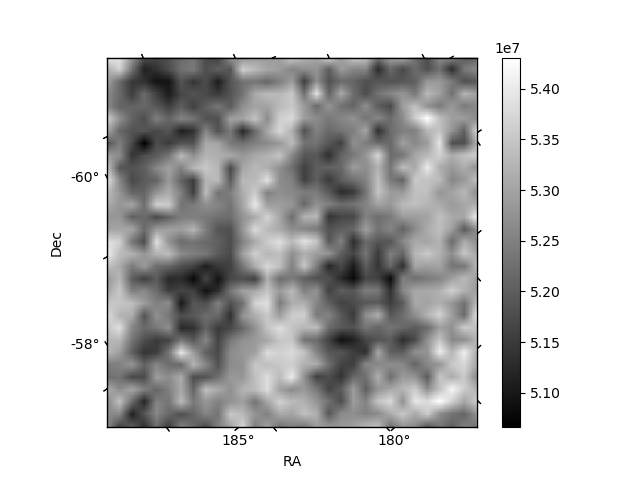
Histogram calculated using DETX and DETY for each event in the final _common_clean file
| Quadrant A | 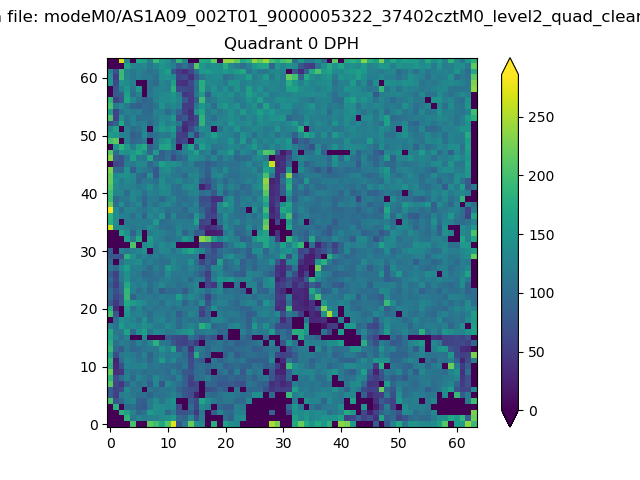 |
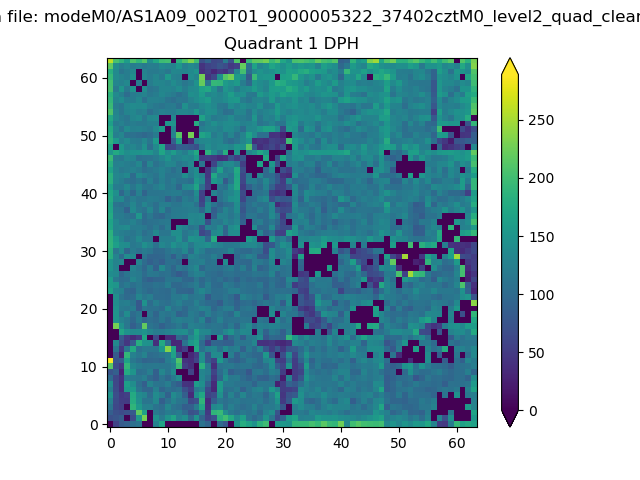 |
Quadrant B |
|---|---|---|---|
| Quadrant D | 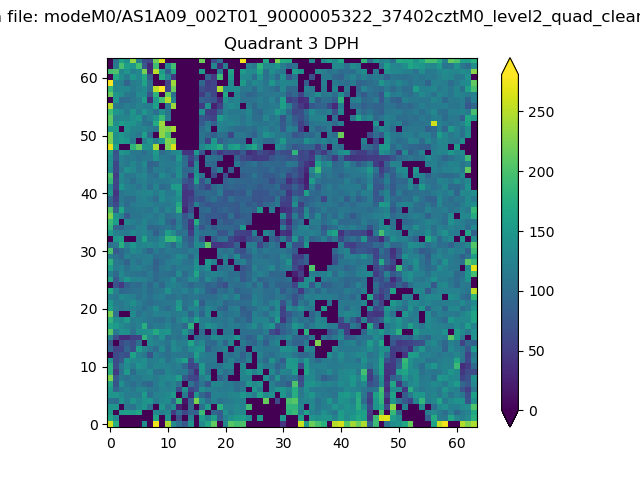 |
 |
Quadrant C |
| Plot type | Count rate plots | Images |
|---|---|---|
| Comparison with Poisson distribution Blue bars denote a histogram of data divided into 1 sec bins. Red curve is a Poisson curve with rate = median count rate of data. |
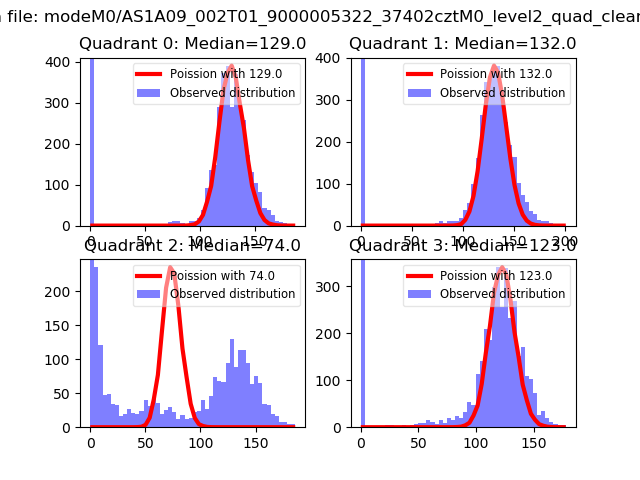 |
 |
| Quadrant-wise count rates Data is divided into 100 sec bins |
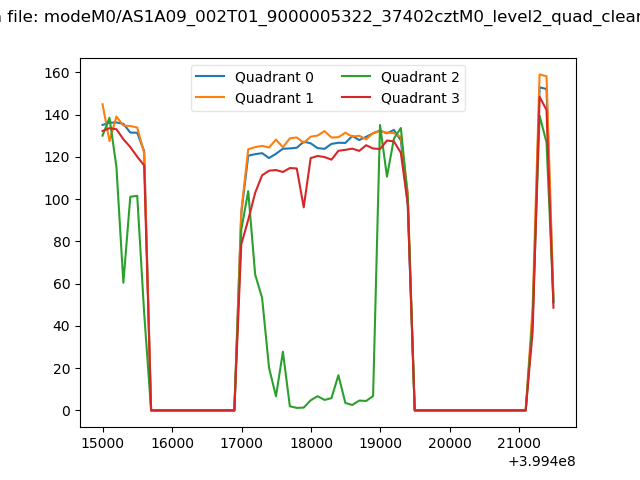 |
|
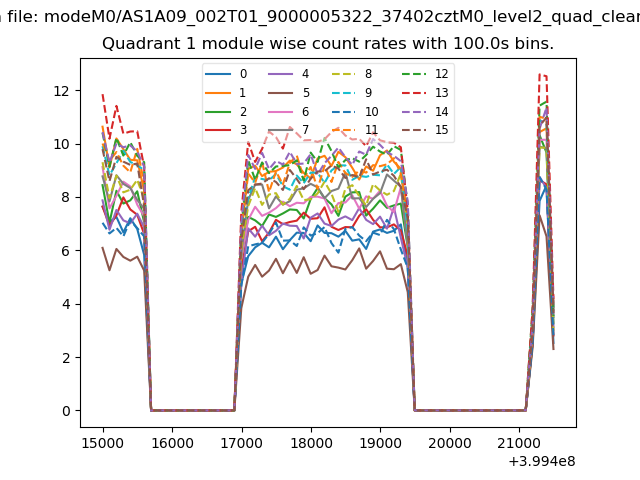
| Module-wise count rates for Quadrant A Data is divided into 100 sec bins |
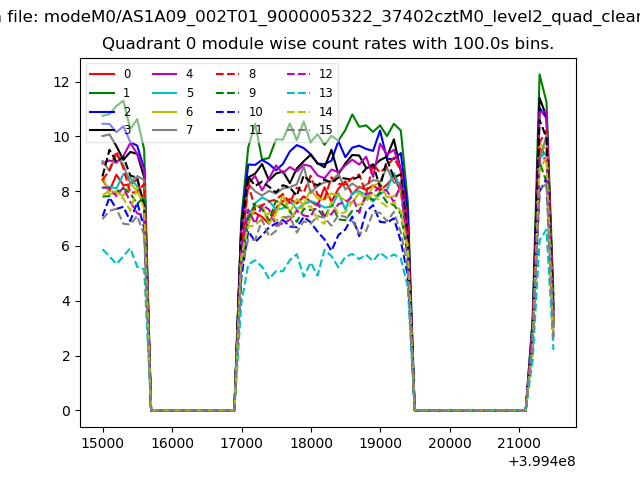 |
 |
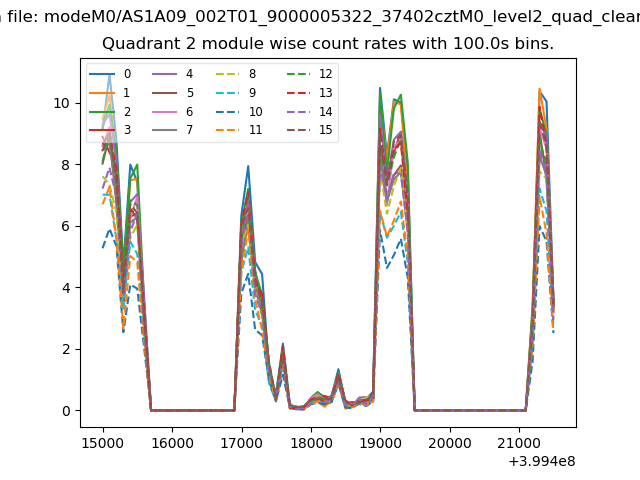
| Module-wise count rates for Quadrant B Data is divided into 100 sec bins |
 |
 |
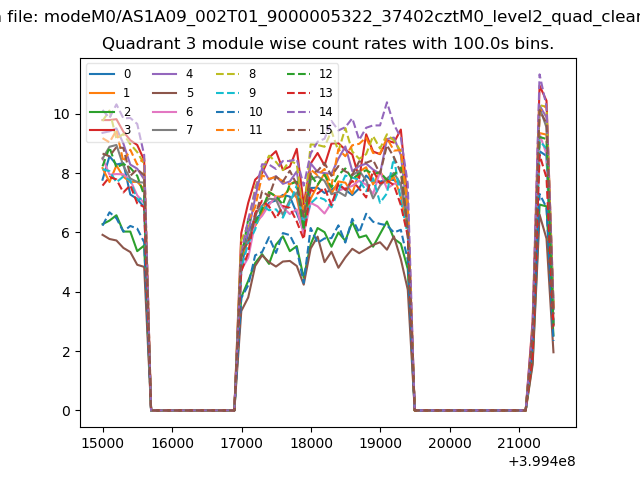
| Module-wise count rates for Quadrant C Data is divided into 100 sec bins |
 |
 |
| Module-wise count rates for Quadrant D Data is divided into 100 sec bins |
 |
 |
| Parameter | Plot |
|---|---|
| CZT HV Monitor | 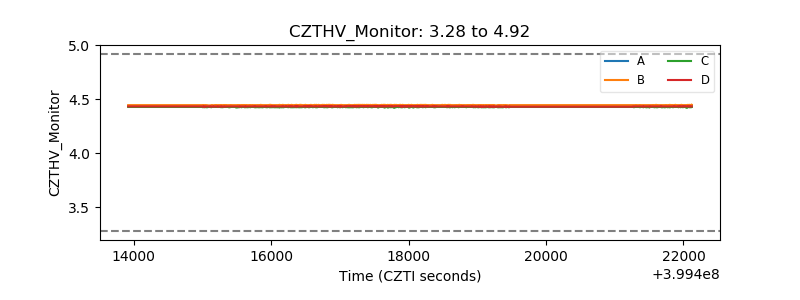 |
| D_VDD | 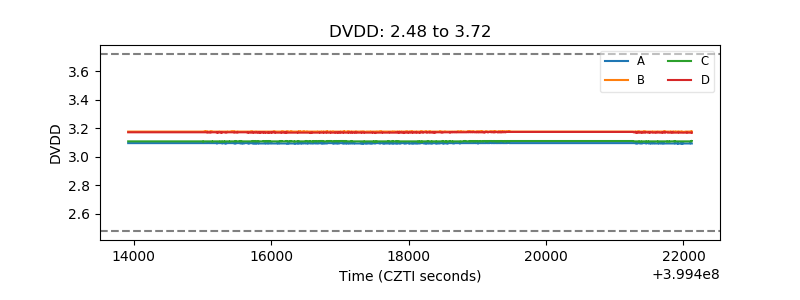 |
| Temperature 1 | 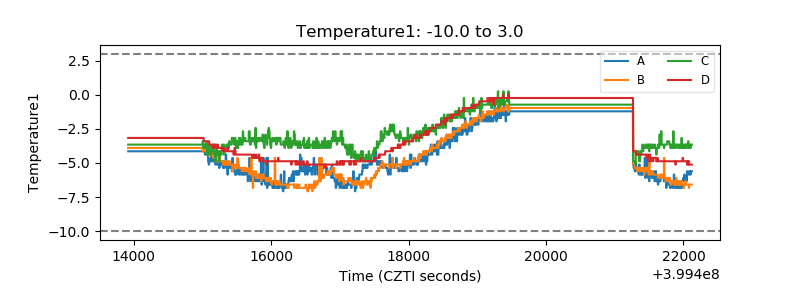 |
| Veto HV Monitor | 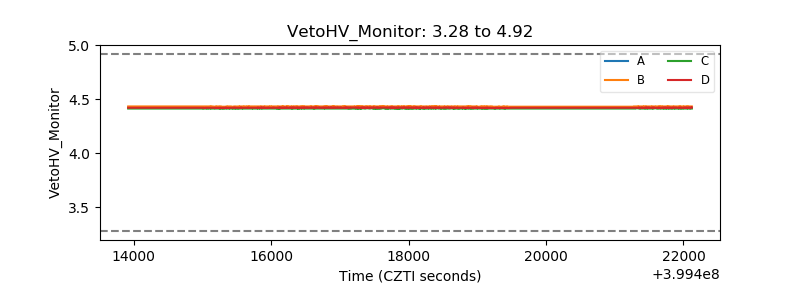 |
| Veto LLD | 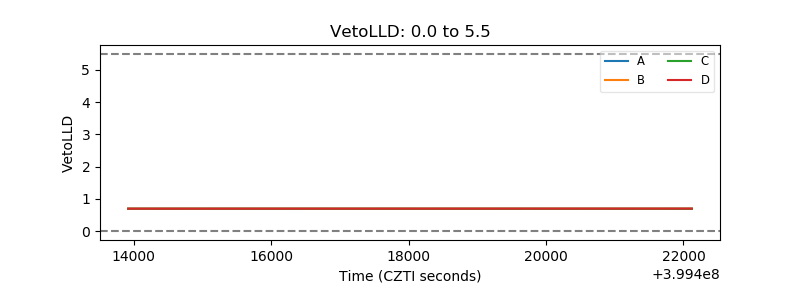 |
| Alpha Counter |  |
| _CPM_Rate | 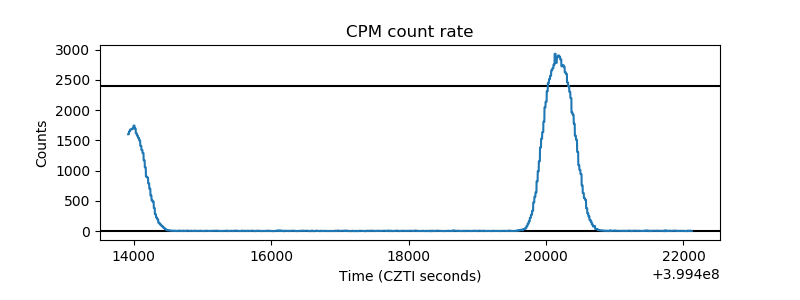 |
| CZT Counter | 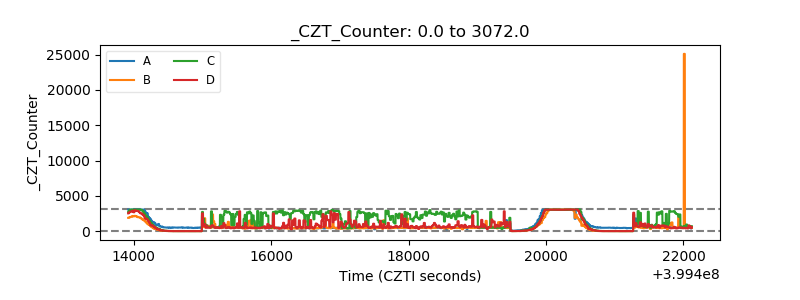 |
| +2.5 Volts monitor | 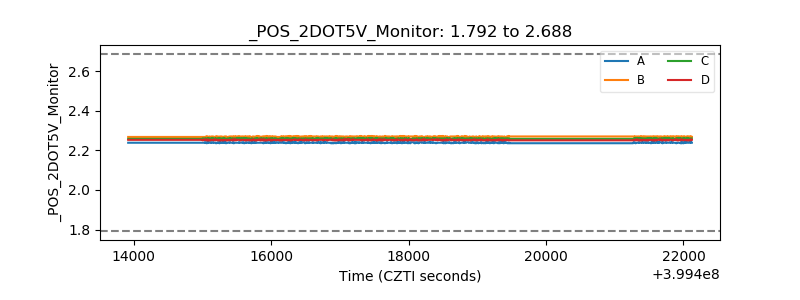 |
| +5 Volts monitor | 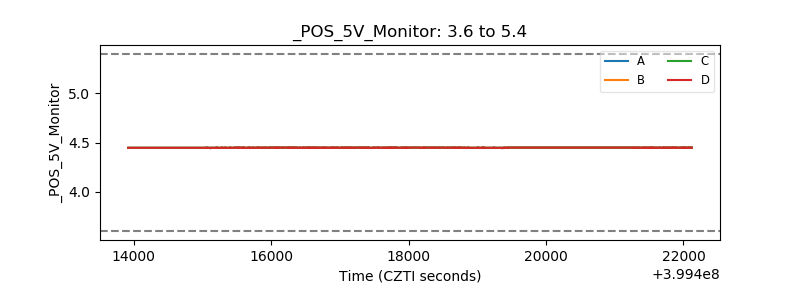 |
| _ROLL_ROT | 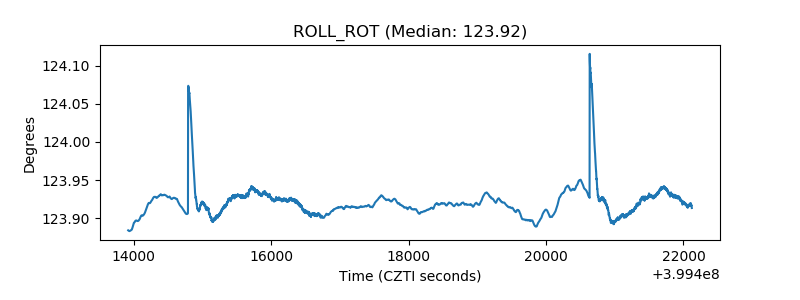 |
| _Roll_DEC | 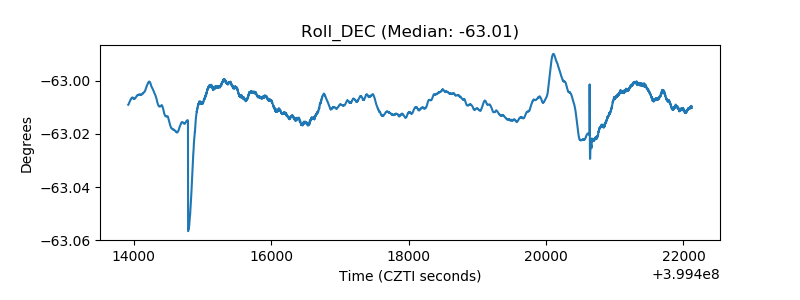 |
| _Roll_RA | 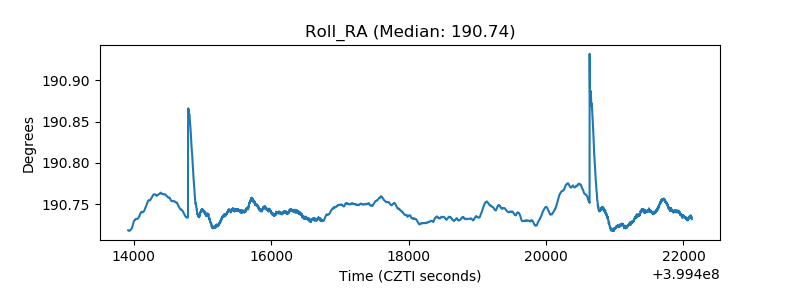 |
| Veto Counter | 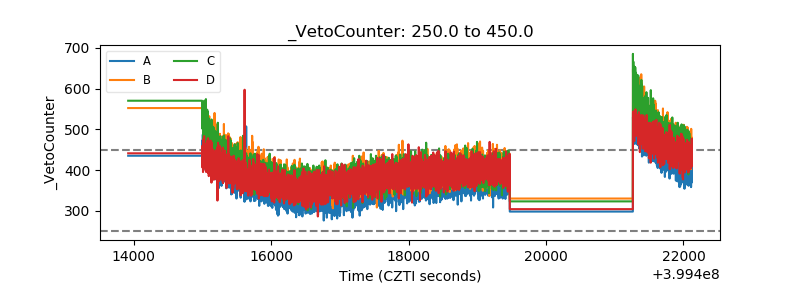 |