| Param | Original file | Final file |
|---|---|---|
| Filename | modeM0/AS1A09_002T01_9000005322_37403cztM0_level2.evt | modeM0/AS1A09_002T01_9000005322_37403cztM0_level2_quad_clean.evt |
| Size (bytes) | 514,310,400 | 62,997,120 |
| Size | 490.5 MB | 60.1 MB |
| Events in quadrant A | 2,771,386 | 396,529 |
| Events in quadrant B | 2,699,280 | 406,164 |
| Events in quadrant C | 5,763,766 | 378,328 |
| Events in quadrant D | 3,996,631 | 369,079 |
| Mode M0 | |||
|---|---|---|---|
| Quadrant | BADHDUFLAG | Total packets | Discarded packets |
| A | 0 | 11312 | 3 |
| B | 0 | 11088 | 2 |
| C | 0 | 20578 | 2 |
| D | 0 | 15399 | 2 |
| Mode M9 | |||
|---|---|---|---|
| Quadrant | BADHDUFLAG | Total packets | Discarded packets |
| A | 0 | 28 | 0 |
| B | 0 | 28 | 0 |
| C | 0 | 28 | 0 |
| D | 0 | 29 | 0 |
| Mode SS | |||
|---|---|---|---|
| Quadrant | BADHDUFLAG | Total packets | Discarded packets |
| A | 0 | 102 | 0 |
| B | 0 | 102 | 0 |
| C | 0 | 102 | 0 |
| D | 0 | 102 | 0 |
| Quadrant | Total seconds | Saturated seconds | Saturation percentage |
|---|---|---|---|
| A | 5102 | 20 | 0.392003% |
| B | 5102 | 55 | 1.078009% |
| C | 5102 | 549 | 10.760486% |
| D | 5102 | 159 | 3.116425% |
Noise dominated data is calculated using 1-second bins in cleaned event files. If a bin has >2000 counts, and if more than 50% of those come from <1% of pixels, then it is considered to be noise-dominated and hence unusable.
| Quadrant | # 1 sec bins | Bins with >0 counts | Bins with >2000 counts | High rate bins dominated by noise | Noise dominated (total time) | Noise dominated (detector-on time) | Marked lightcurve |
|---|---|---|---|---|---|---|---|
| A | 7045 | 5103 | 12 | 12 | 0.17% | 0.24% | 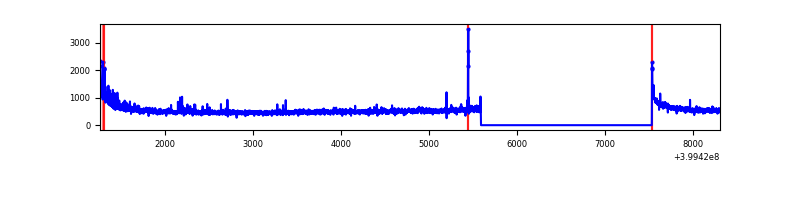 |
| B | 7045 | 5103 | 32 | 32 | 0.45% | 0.63% | 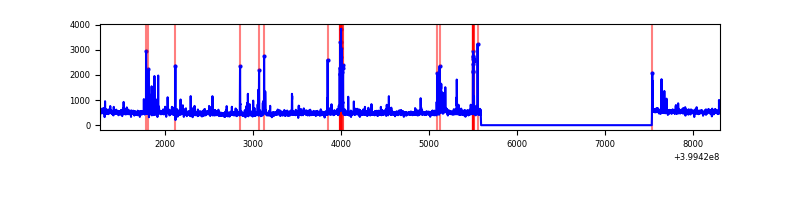 |
| C | 7045 | 5103 | 464 | 464 | 6.59% | 9.09% | 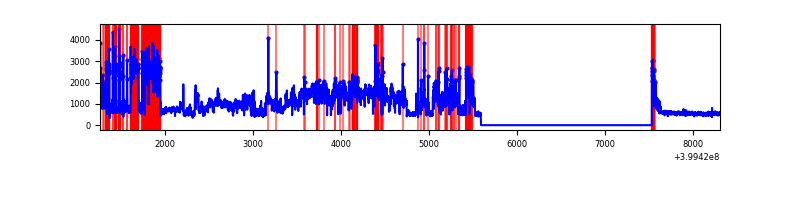 |
| D | 7045 | 5103 | 143 | 143 | 2.03% | 2.80% | 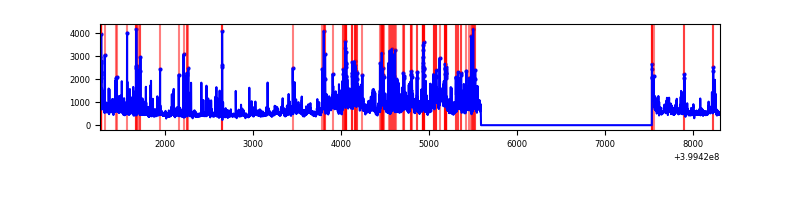 |
Top three noisy pixels from each quadrant. If the there are fewer than three noisy pixels in the level2.evt file, extra rows are filled as -1
| Pixel properties | Quadrant properties | ||||||
|---|---|---|---|---|---|---|---|
| Quadrant | DetID | PixID | Counts | Sigma | Mean | Median | Sigma |
| A | 10 | 83 | 271650 | 2221.4 | 606 | 595 | 122.0 |
| A | 15 | 222 | 81412 | 662.33 | 606 | 595 | 122.0 |
| A | 13 | 248 | 31100 | 250.0 | 606 | 595 | 122.0 |
| B | 5 | 172 | 140391 | 1235.87 | 606 | 592 | 113.1 |
| B | 0 | 190 | 88342 | 775.74 | 606 | 592 | 113.1 |
| B | 0 | 229 | 35786 | 311.13 | 606 | 592 | 113.1 |
| C | 1 | 23 | 3078794 | 23606.03 | 573 | 579 | 130.4 |
| C | 15 | 214 | 210340 | 1608.6 | 573 | 579 | 130.4 |
| C | 0 | 10 | 125456 | 957.65 | 573 | 579 | 130.4 |
| D | 12 | 235 | 885531 | 6289.18 | 588 | 571 | 140.7 |
| D | 2 | 249 | 280113 | 1986.63 | 588 | 571 | 140.7 |
| D | 2 | 250 | 200680 | 1422.12 | 588 | 571 | 140.7 |
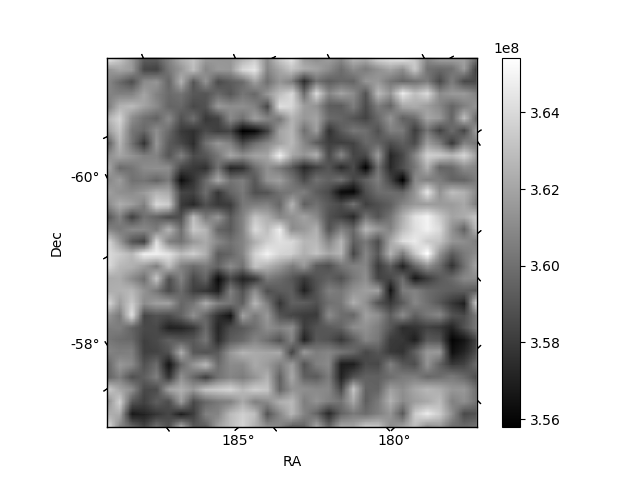
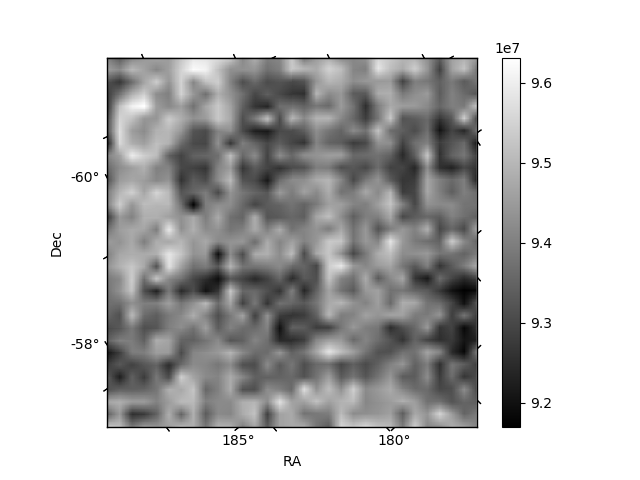
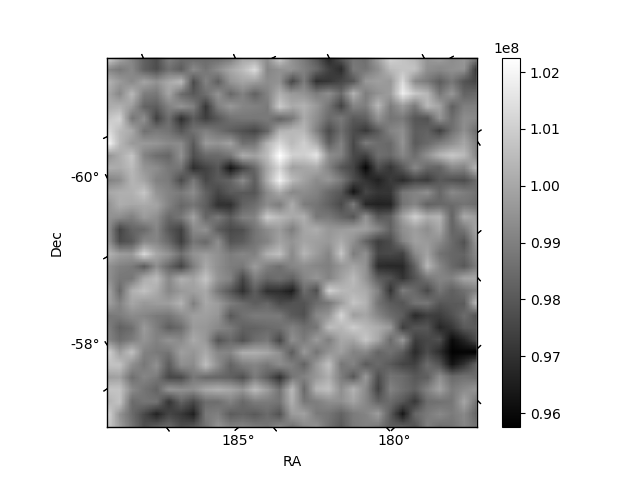
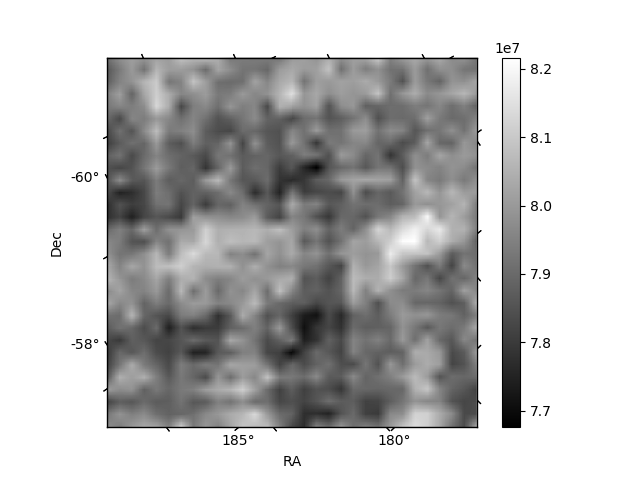
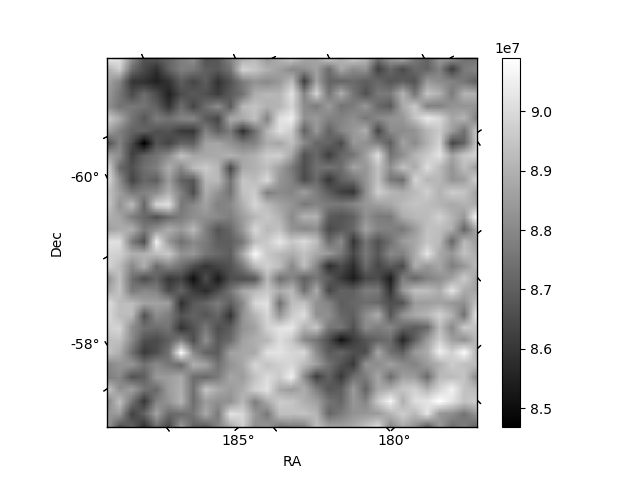
Histogram calculated using DETX and DETY for each event in the final _common_clean file
| Quadrant A | 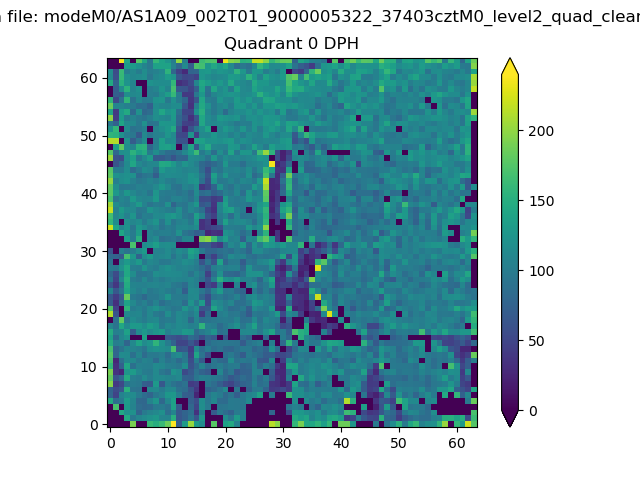 |
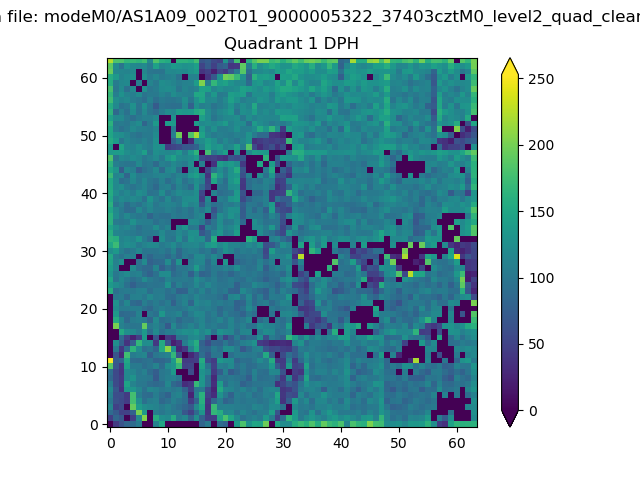 |
Quadrant B |
|---|---|---|---|
| Quadrant D | 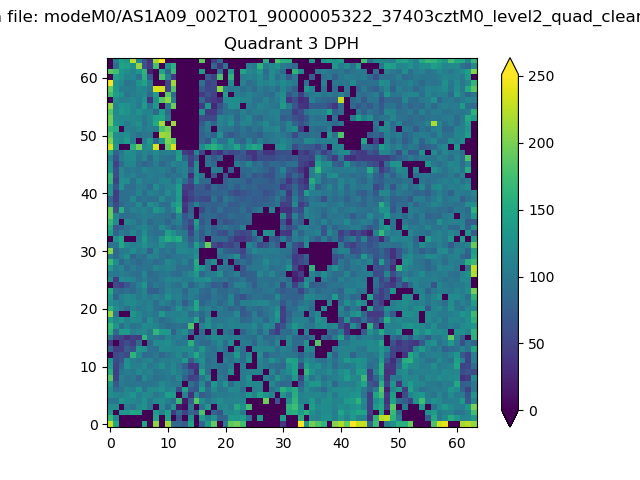 |
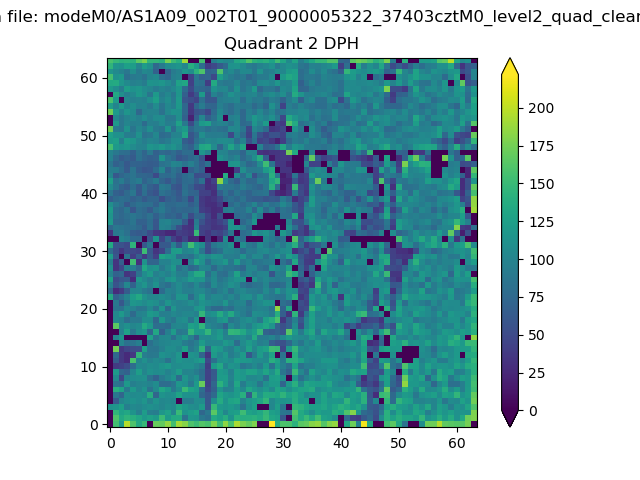 |
Quadrant C |
| Plot type | Count rate plots | Images |
|---|---|---|
| Comparison with Poisson distribution Blue bars denote a histogram of data divided into 1 sec bins. Red curve is a Poisson curve with rate = median count rate of data. |
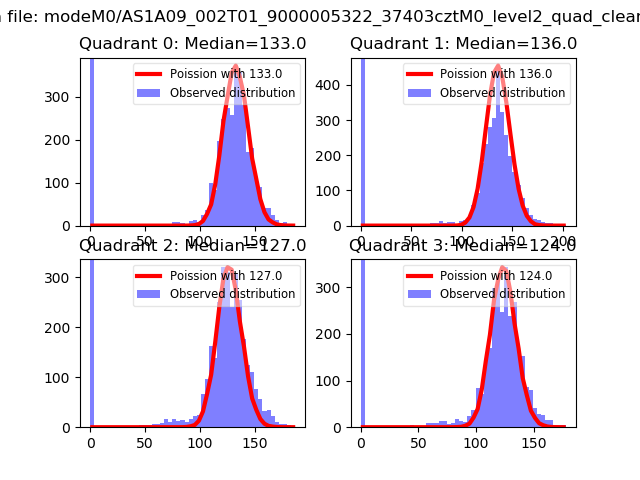 |
 |
| Quadrant-wise count rates Data is divided into 100 sec bins |
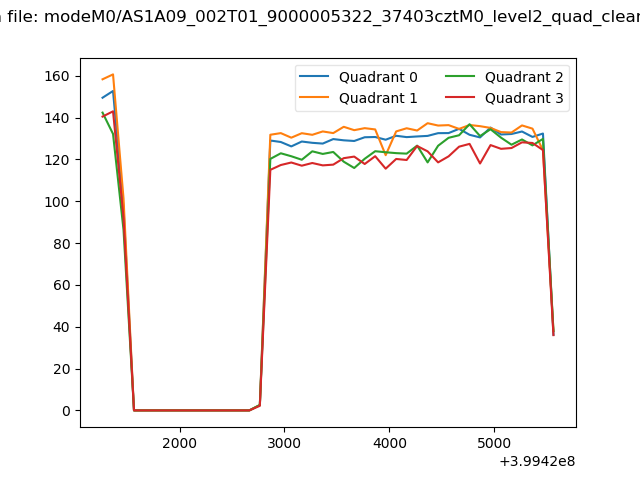 |
|
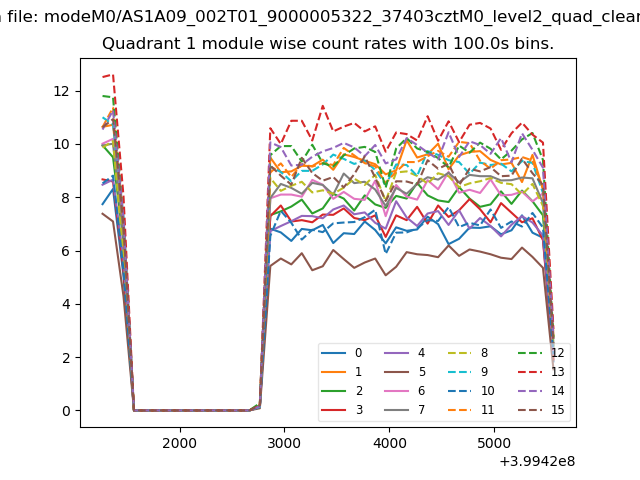
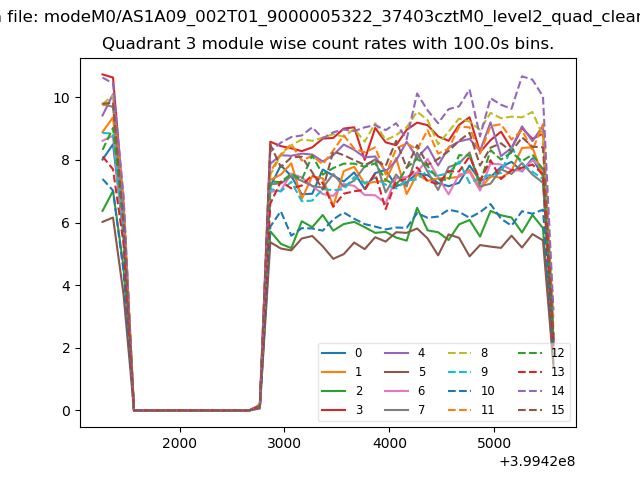
| Module-wise count rates for Quadrant A Data is divided into 100 sec bins |
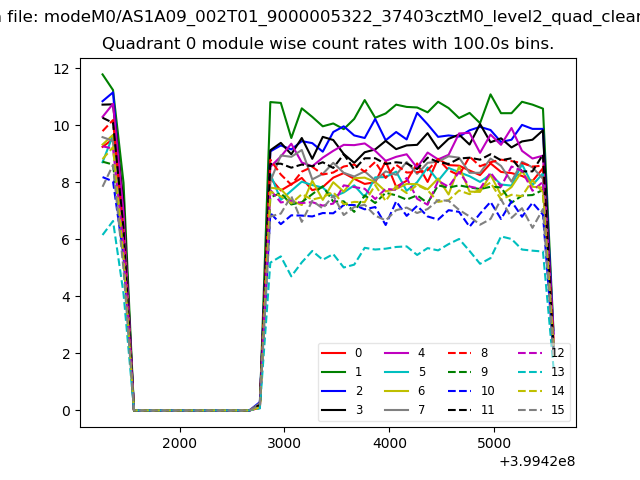 |
 |
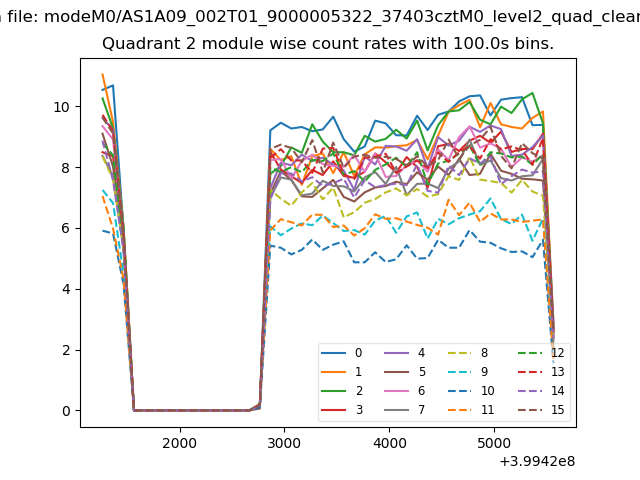
| Module-wise count rates for Quadrant B Data is divided into 100 sec bins |
 |
 |
| Module-wise count rates for Quadrant C Data is divided into 100 sec bins |
 |
 |
| Module-wise count rates for Quadrant D Data is divided into 100 sec bins |
 |
 |
| Parameter | Plot |
|---|---|
| CZT HV Monitor | 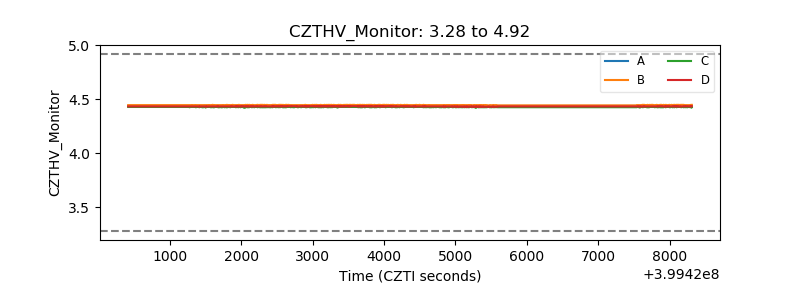 |
| D_VDD | 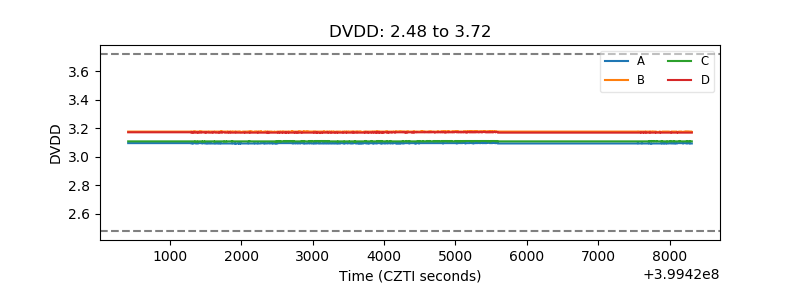 |
| Temperature 1 | 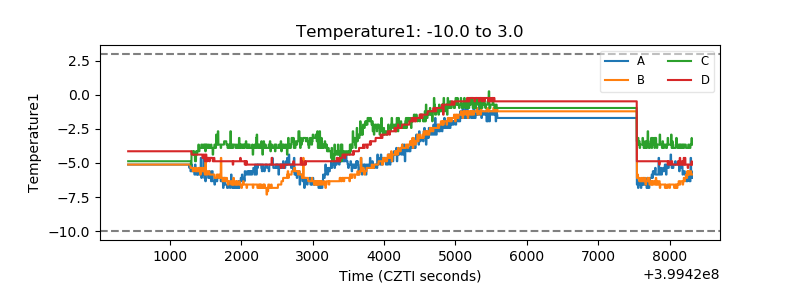 |
| Veto HV Monitor |  |
| Veto LLD | 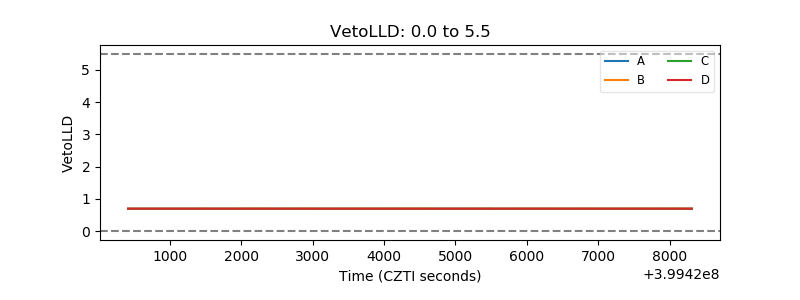 |
| Alpha Counter | 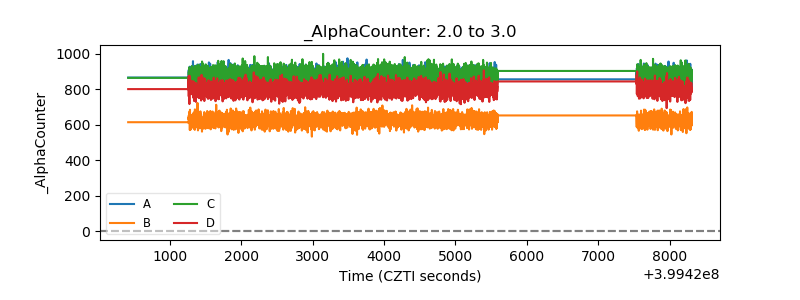 |
| _CPM_Rate | 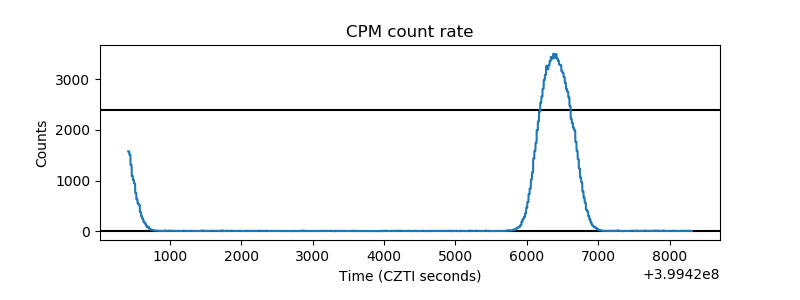 |
| CZT Counter | 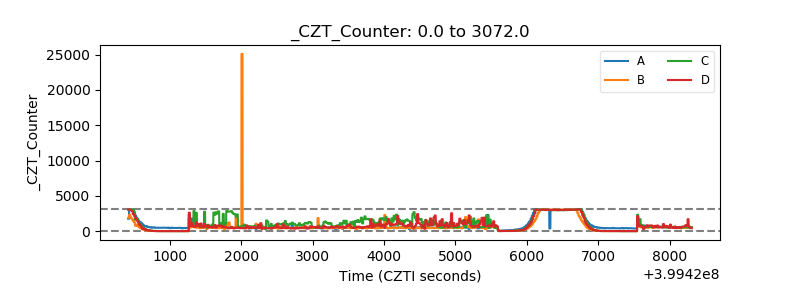 |
| +2.5 Volts monitor | 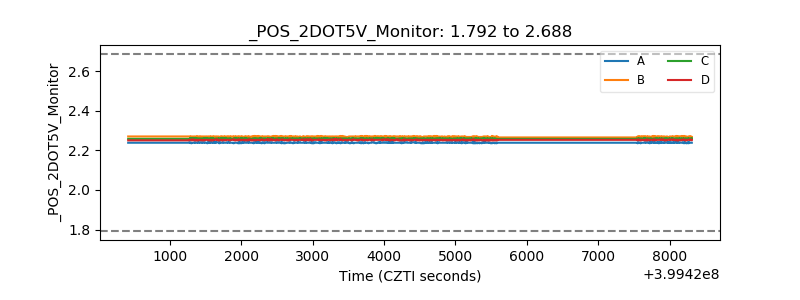 |
| +5 Volts monitor | 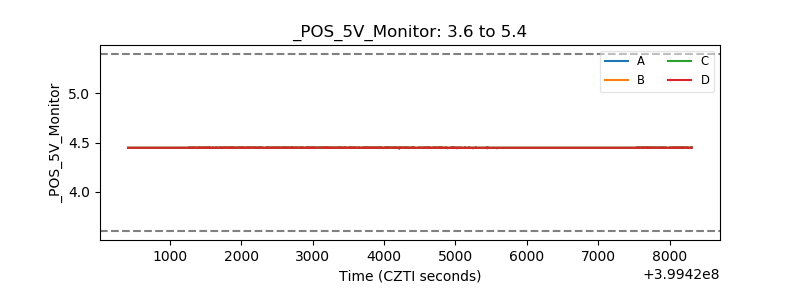 |
| _ROLL_ROT | 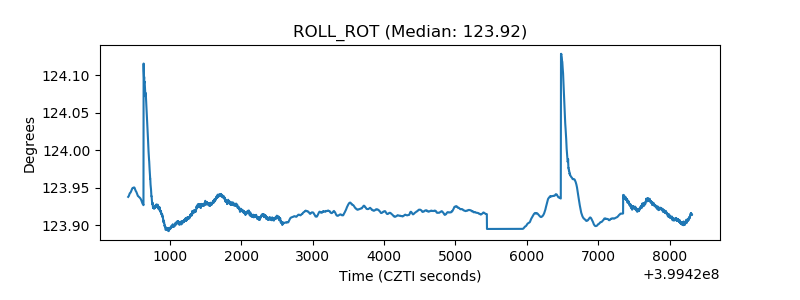 |
| _Roll_DEC | 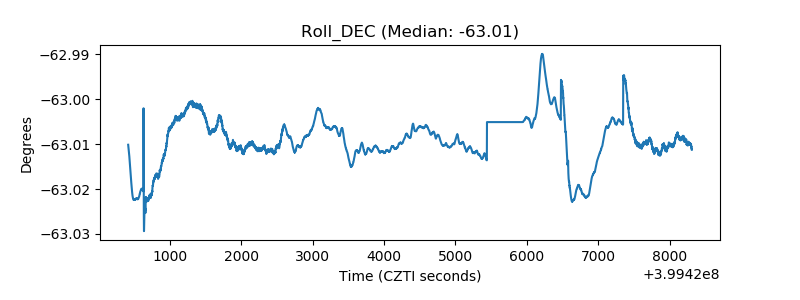 |
| _Roll_RA | 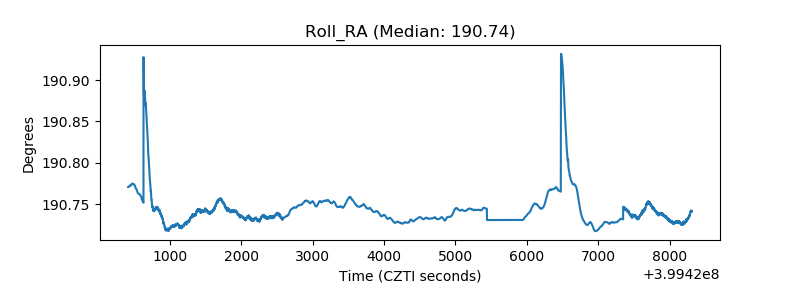 |
| Veto Counter | 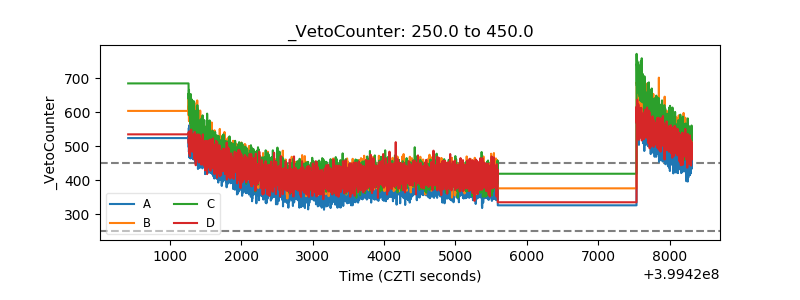 |