| Param | Original file | Final file |
|---|---|---|
| Filename | modeM0/AS1A09_002T01_9000005322_37404cztM0_level2.evt | modeM0/AS1A09_002T01_9000005322_37404cztM0_level2_quad_clean.evt |
| Size (bytes) | 423,838,080 | 73,719,360 |
| Size | 404.2 MB | 70.3 MB |
| Events in quadrant A | 2,900,084 | 467,231 |
| Events in quadrant B | 2,852,844 | 477,471 |
| Events in quadrant C | 2,977,488 | 476,209 |
| Events in quadrant D | 3,747,764 | 442,460 |
| Mode M0 | |||
|---|---|---|---|
| Quadrant | BADHDUFLAG | Total packets | Discarded packets |
| A | 0 | 11647 | 3 |
| B | 0 | 11522 | 2 |
| C | 0 | 11678 | 2 |
| D | 0 | 14545 | 2 |
| Mode M9 | |||
|---|---|---|---|
| Quadrant | BADHDUFLAG | Total packets | Discarded packets |
| A | 0 | 35 | 0 |
| B | 0 | 35 | 0 |
| C | 0 | 35 | 0 |
| D | 0 | 36 | 0 |
| Mode SS | |||
|---|---|---|---|
| Quadrant | BADHDUFLAG | Total packets | Discarded packets |
| A | 0 | 108 | 0 |
| B | 0 | 108 | 0 |
| C | 0 | 108 | 0 |
| D | 0 | 108 | 0 |
| Quadrant | Total seconds | Saturated seconds | Saturation percentage |
|---|---|---|---|
| A | 5265 | 14 | 0.265907% |
| B | 5265 | 37 | 0.702754% |
| C | 5265 | 57 | 1.082621% |
| D | 5265 | 135 | 2.564103% |
Noise dominated data is calculated using 1-second bins in cleaned event files. If a bin has >2000 counts, and if more than 50% of those come from <1% of pixels, then it is considered to be noise-dominated and hence unusable.
| Quadrant | # 1 sec bins | Bins with >0 counts | Bins with >2000 counts | High rate bins dominated by noise | Noise dominated (total time) | Noise dominated (detector-on time) | Marked lightcurve |
|---|---|---|---|---|---|---|---|
| A | 7328 | 5266 | 5 | 5 | 0.07% | 0.09% | 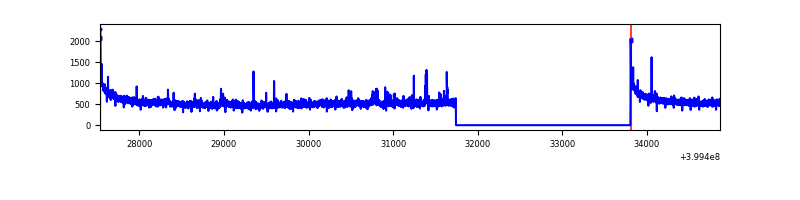 |
| B | 7328 | 5266 | 17 | 17 | 0.23% | 0.32% | 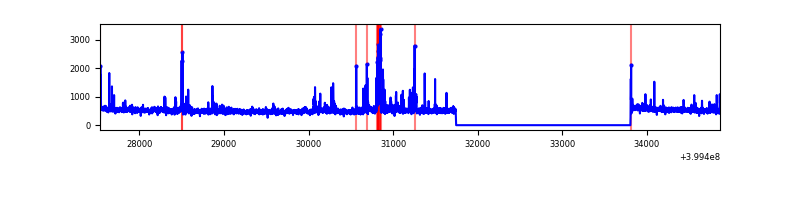 |
| C | 7328 | 5266 | 45 | 45 | 0.61% | 0.85% | 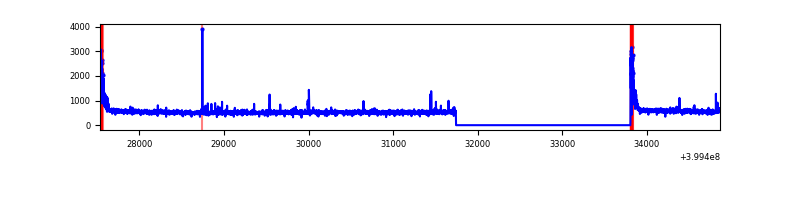 |
| D | 7328 | 5266 | 100 | 100 | 1.36% | 1.90% | 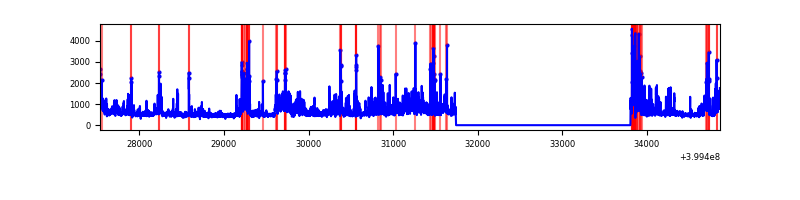 |
Top three noisy pixels from each quadrant. If the there are fewer than three noisy pixels in the level2.evt file, extra rows are filled as -1
| Pixel properties | Quadrant properties | ||||||
|---|---|---|---|---|---|---|---|
| Quadrant | DetID | PixID | Counts | Sigma | Mean | Median | Sigma |
| A | 10 | 83 | 274815 | 2122.31 | 654 | 644 | 129.2 |
| A | 15 | 222 | 54736 | 418.72 | 654 | 644 | 129.2 |
| A | 9 | 143 | 16705 | 124.33 | 654 | 644 | 129.2 |
| B | 5 | 172 | 143689 | 1189.16 | 654 | 640 | 120.3 |
| B | 0 | 190 | 47115 | 386.35 | 654 | 640 | 120.3 |
| B | 4 | 232 | 27430 | 222.7 | 654 | 640 | 120.3 |
| C | 15 | 214 | 224580 | 1522.76 | 648 | 654 | 147.1 |
| C | 0 | 10 | 162467 | 1100.37 | 648 | 654 | 147.1 |
| C | 14 | 254 | 42660 | 285.65 | 648 | 654 | 147.1 |
| D | 2 | 249 | 327857 | 2140.81 | 640 | 624 | 152.9 |
| D | 1 | 47 | 194787 | 1270.24 | 640 | 624 | 152.9 |
| D | 12 | 227 | 173374 | 1130.16 | 640 | 624 | 152.9 |
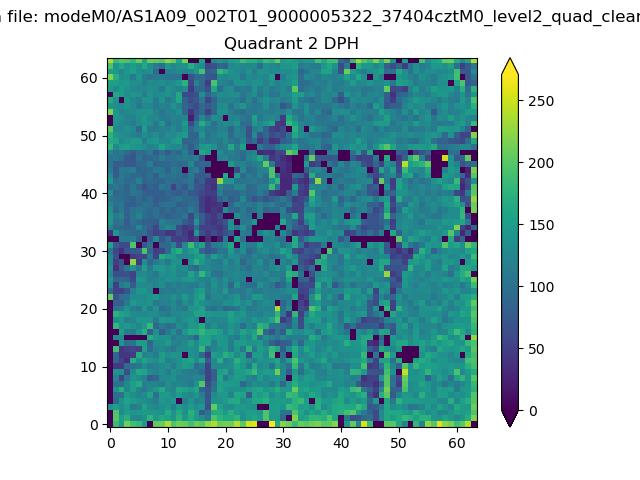
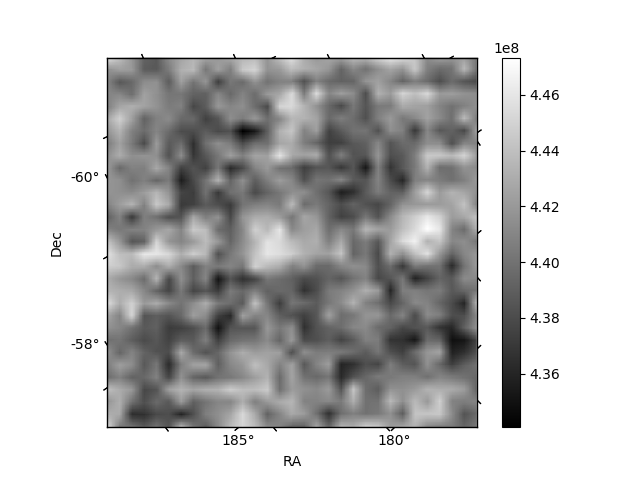
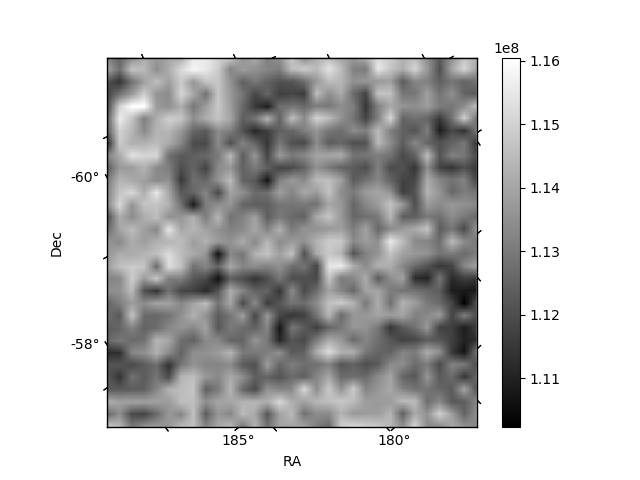
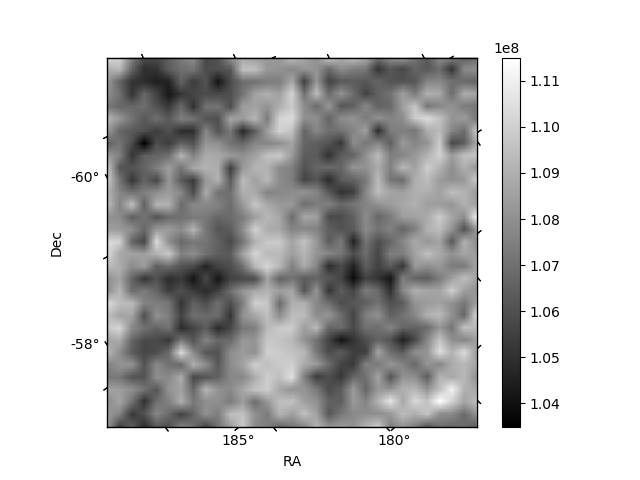
Histogram calculated using DETX and DETY for each event in the final _common_clean file
| Quadrant A | 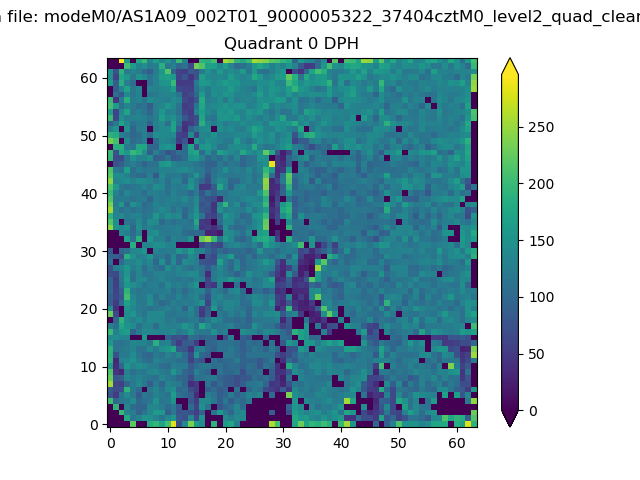 |
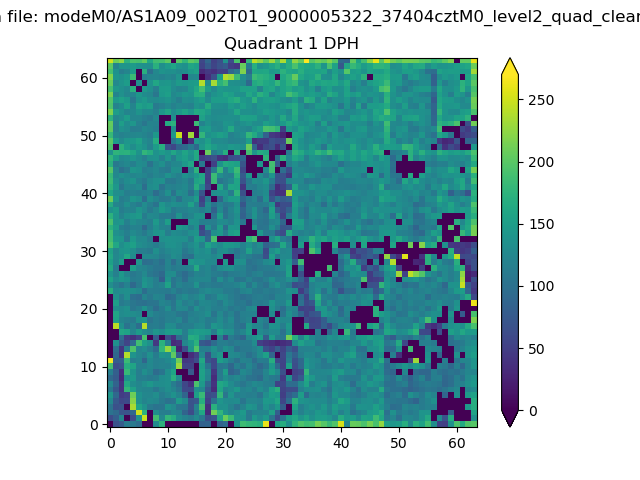 |
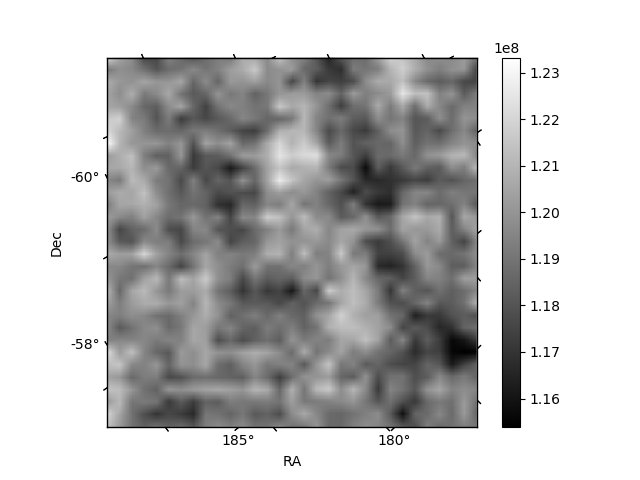
Quadrant B |
|---|---|---|---|
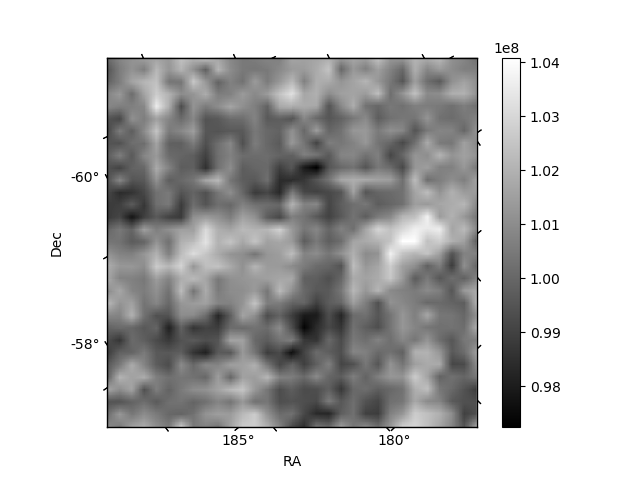
| Quadrant D | 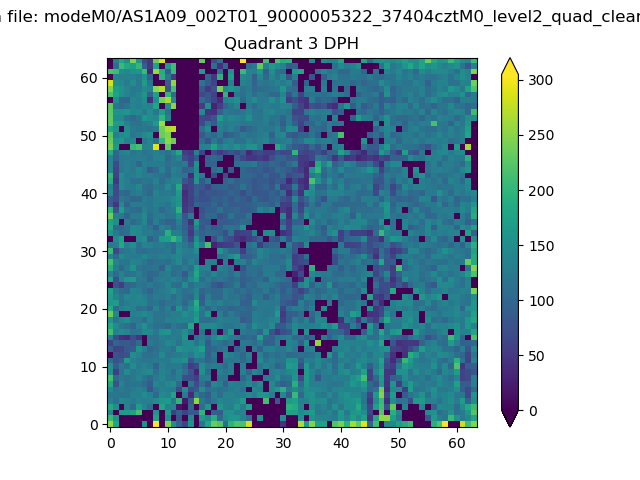 |
 |
Quadrant C |
| Plot type | Count rate plots | Images |
|---|---|---|
| Comparison with Poisson distribution Blue bars denote a histogram of data divided into 1 sec bins. Red curve is a Poisson curve with rate = median count rate of data. |
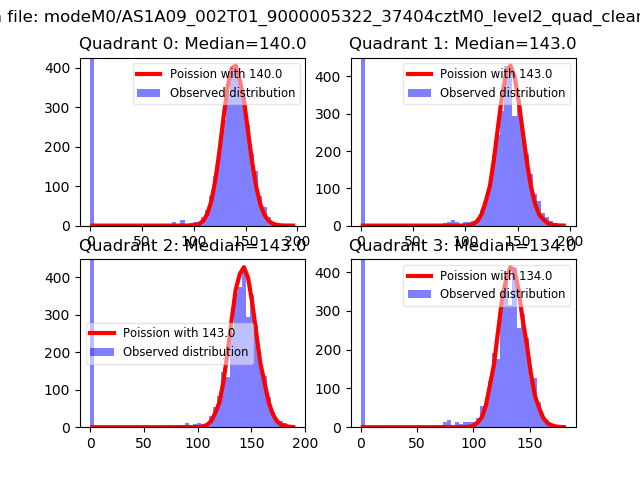 |
 |
| Quadrant-wise count rates Data is divided into 100 sec bins |
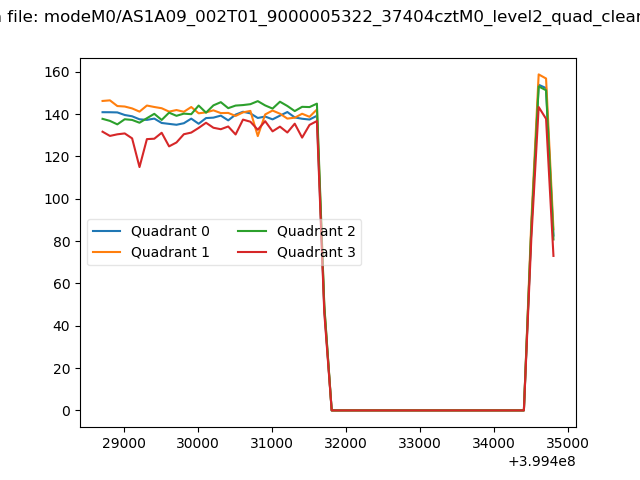 |
|
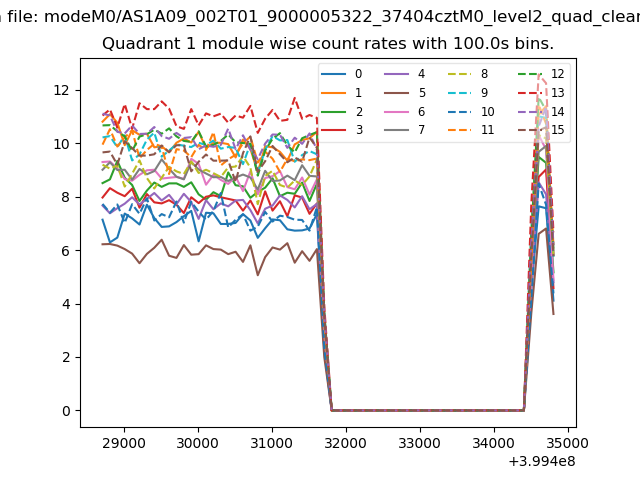
| Module-wise count rates for Quadrant A Data is divided into 100 sec bins |
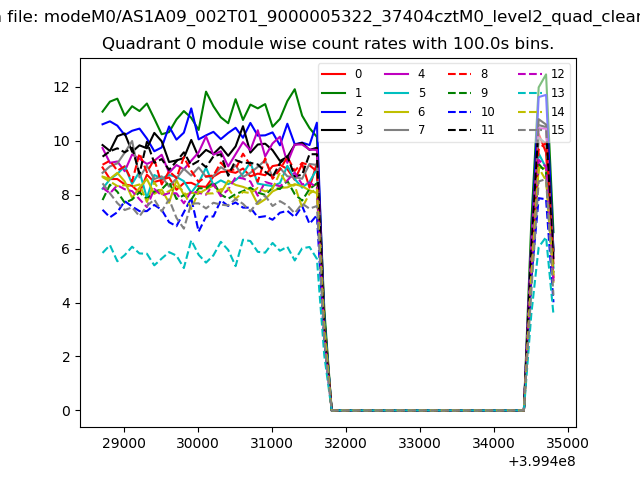 |
 |
| Module-wise count rates for Quadrant B Data is divided into 100 sec bins |
 |
 |
| Module-wise count rates for Quadrant C Data is divided into 100 sec bins |
 |
 |
| Module-wise count rates for Quadrant D Data is divided into 100 sec bins |
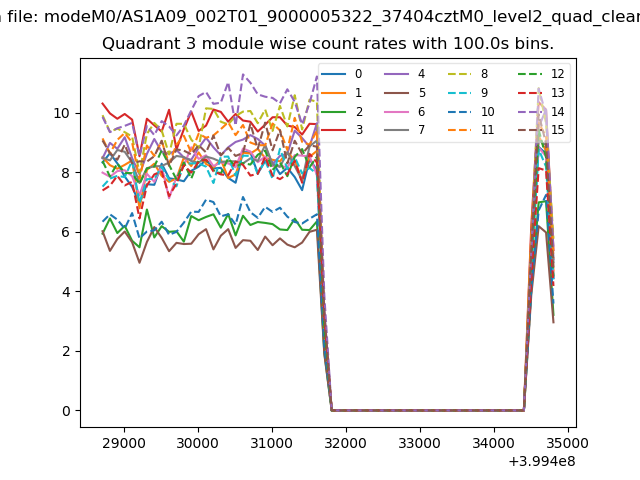 |
 |
| Parameter | Plot |
|---|---|
| CZT HV Monitor | 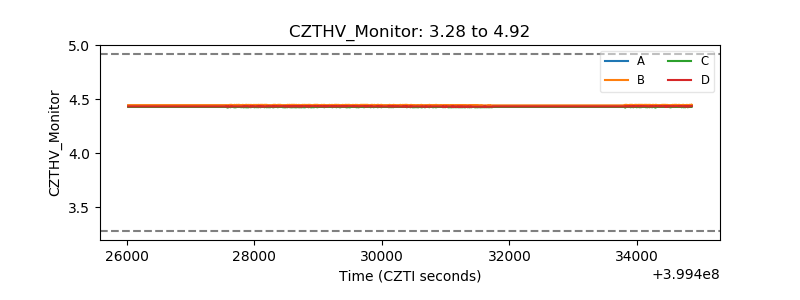 |
| D_VDD | 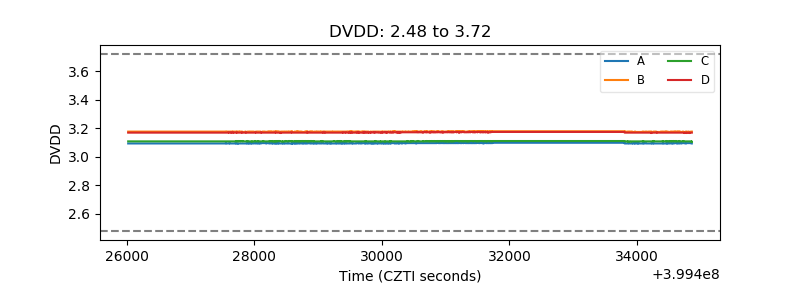 |
| Temperature 1 | 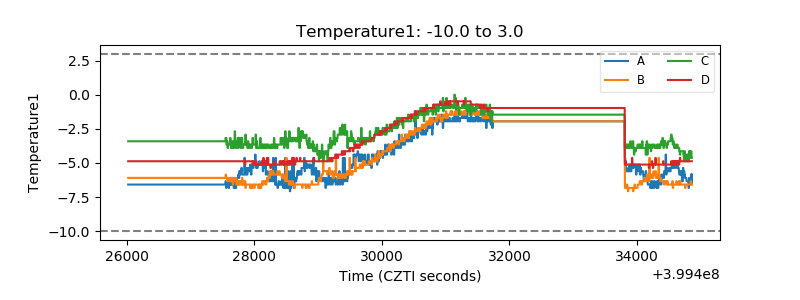 |
| Veto HV Monitor | 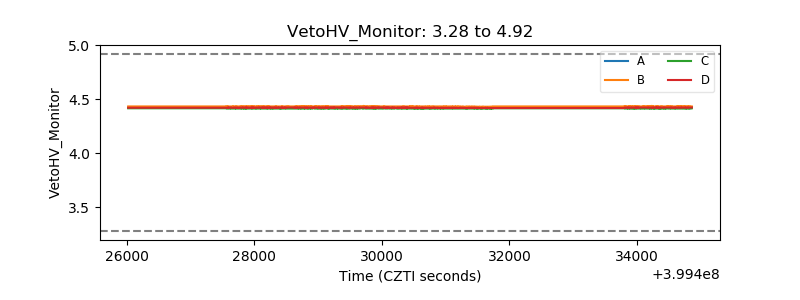 |
| Veto LLD | 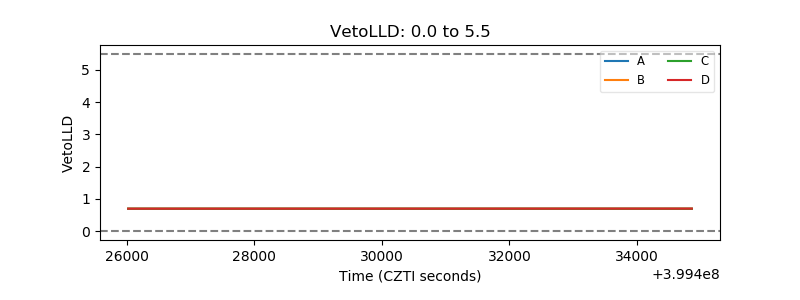 |
| Alpha Counter | 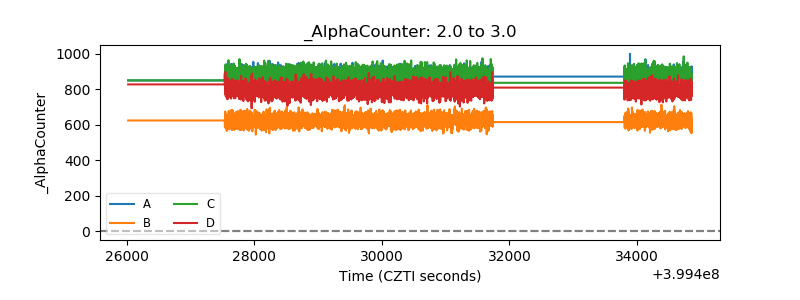 |
| _CPM_Rate | 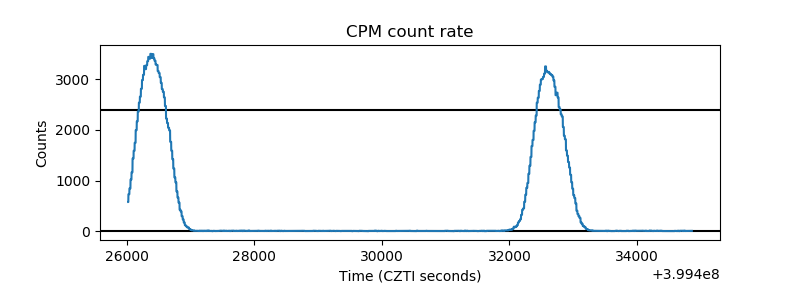 |
| CZT Counter | 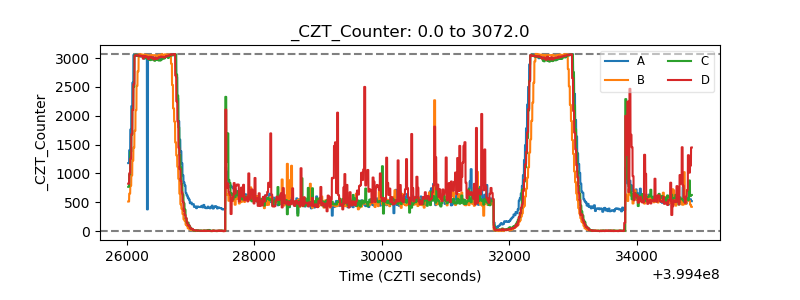 |
| +2.5 Volts monitor | 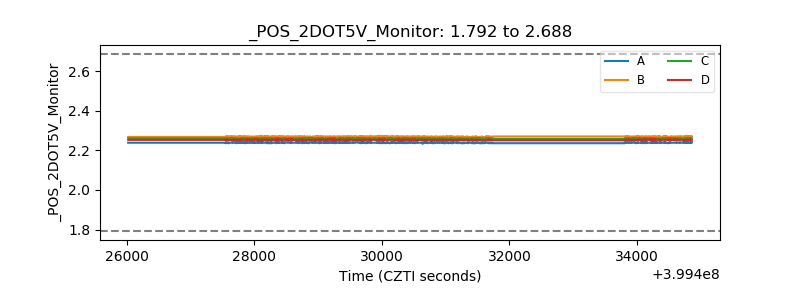 |
| +5 Volts monitor | 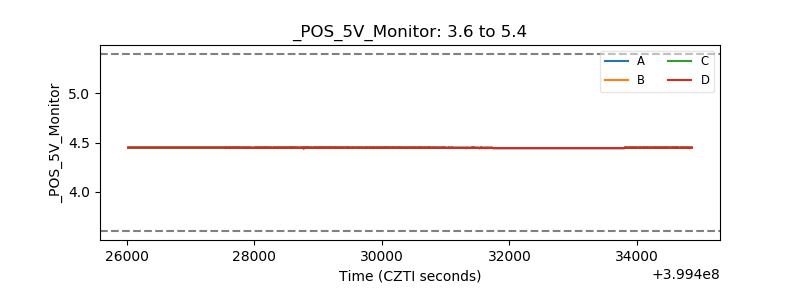 |
| _ROLL_ROT | 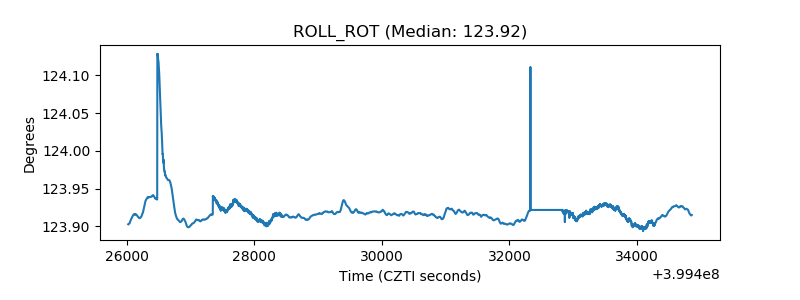 |
| _Roll_DEC | 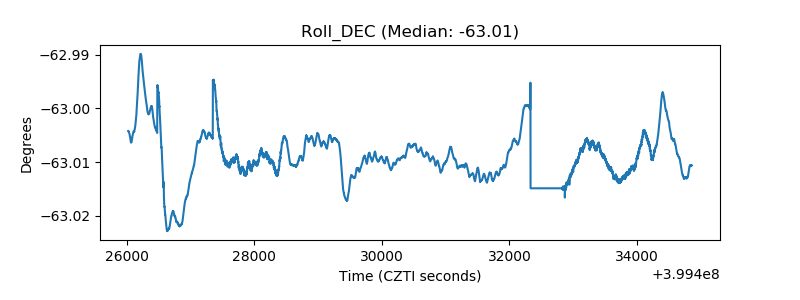 |
| _Roll_RA | 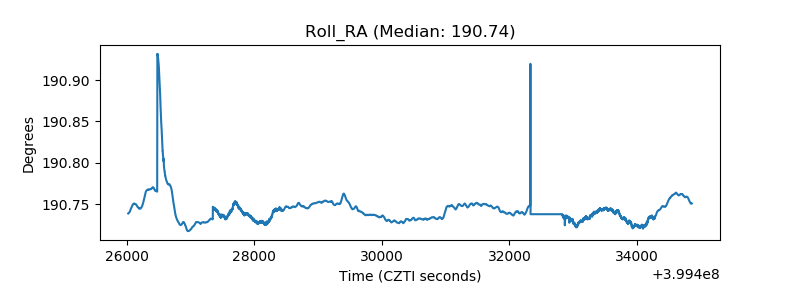 |
| Veto Counter | 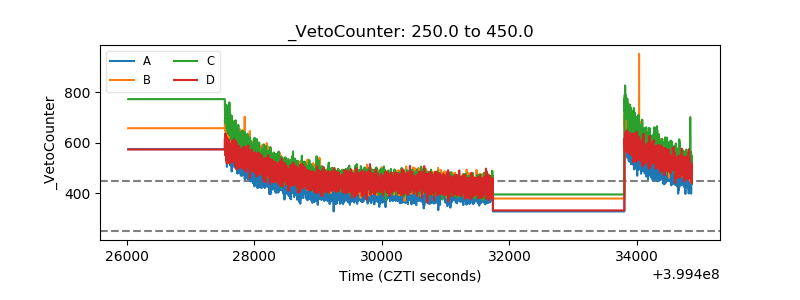 |