| Param | Original file | Final file |
|---|---|---|
| Filename | modeM0/AS1A09_002T01_9000005322_37405cztM0_level2.evt | modeM0/AS1A09_002T01_9000005322_37405cztM0_level2_quad_clean.evt |
| Size (bytes) | 444,150,720 | 84,934,080 |
| Size | 423.6 MB | 81.0 MB |
| Events in quadrant A | 2,740,412 | 558,044 |
| Events in quadrant B | 2,639,353 | 574,385 |
| Events in quadrant C | 2,908,678 | 571,926 |
| Events in quadrant D | 4,826,886 | 520,321 |
| Mode M0 | |||
|---|---|---|---|
| Quadrant | BADHDUFLAG | Total packets | Discarded packets |
| A | 0 | 10927 | 3 |
| B | 0 | 10694 | 2 |
| C | 0 | 11392 | 2 |
| D | 0 | 17732 | 9 |
| Mode M9 | |||
|---|---|---|---|
| Quadrant | BADHDUFLAG | Total packets | Discarded packets |
| A | 0 | 29 | 0 |
| B | 0 | 29 | 0 |
| C | 0 | 29 | 0 |
| D | 0 | 30 | 0 |
| Mode SS | |||
|---|---|---|---|
| Quadrant | BADHDUFLAG | Total packets | Discarded packets |
| A | 0 | 102 | 0 |
| B | 0 | 102 | 0 |
| C | 0 | 102 | 0 |
| D | 0 | 102 | 0 |
| Quadrant | Total seconds | Saturated seconds | Saturation percentage |
|---|---|---|---|
| A | 4949 | 13 | 0.262679% |
| B | 4949 | 24 | 0.484946% |
| C | 4949 | 59 | 1.192160% |
| D | 4948 | 280 | 5.658852% |
Noise dominated data is calculated using 1-second bins in cleaned event files. If a bin has >2000 counts, and if more than 50% of those come from <1% of pixels, then it is considered to be noise-dominated and hence unusable.
| Quadrant | # 1 sec bins | Bins with >0 counts | Bins with >2000 counts | High rate bins dominated by noise | Noise dominated (total time) | Noise dominated (detector-on time) | Marked lightcurve |
|---|---|---|---|---|---|---|---|
| A | 7072 | 4950 | 4 | 4 | 0.06% | 0.08% | 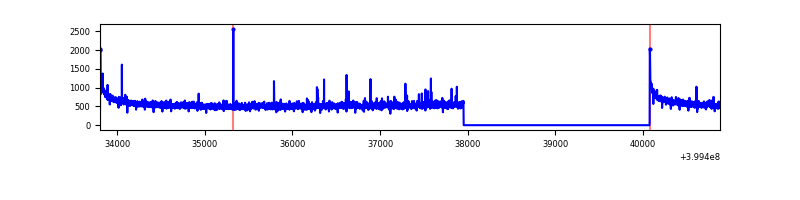 |
| B | 7072 | 4950 | 9 | 9 | 0.13% | 0.18% | 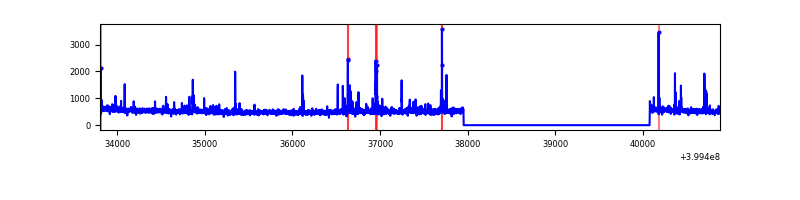 |
| C | 7072 | 4950 | 51 | 51 | 0.72% | 1.03% | 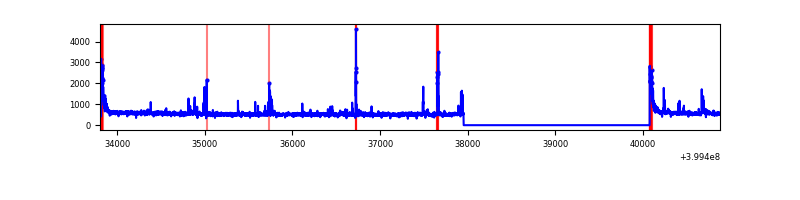 |
| D | 7072 | 4950 | 268 | 268 | 3.79% | 5.41% | 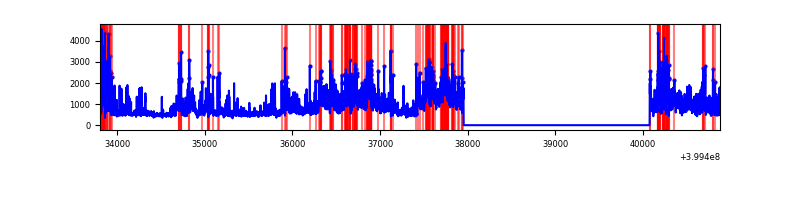 |
Top three noisy pixels from each quadrant. If the there are fewer than three noisy pixels in the level2.evt file, extra rows are filled as -1
| Pixel properties | Quadrant properties | ||||||
|---|---|---|---|---|---|---|---|
| Quadrant | DetID | PixID | Counts | Sigma | Mean | Median | Sigma |
| A | 10 | 83 | 272038 | 2220.97 | 622 | 611 | 122.2 |
| A | 12 | 189 | 13444 | 105.01 | 622 | 611 | 122.2 |
| A | 15 | 222 | 13120 | 102.36 | 622 | 611 | 122.2 |
| B | 5 | 172 | 85893 | 742.96 | 620 | 606 | 114.8 |
| B | 0 | 190 | 29306 | 250.01 | 620 | 606 | 114.8 |
| B | 0 | 229 | 23986 | 203.67 | 620 | 606 | 114.8 |
| C | 15 | 214 | 211908 | 1513.38 | 616 | 622 | 139.6 |
| C | 0 | 10 | 145725 | 1039.33 | 616 | 622 | 139.6 |
| C | 14 | 254 | 54998 | 389.48 | 616 | 622 | 139.6 |
| D | 1 | 52 | 786996 | 5350.84 | 605 | 589 | 147.0 |
| D | 12 | 227 | 674744 | 4587.06 | 605 | 589 | 147.0 |
| D | 2 | 249 | 269953 | 1832.8 | 605 | 589 | 147.0 |
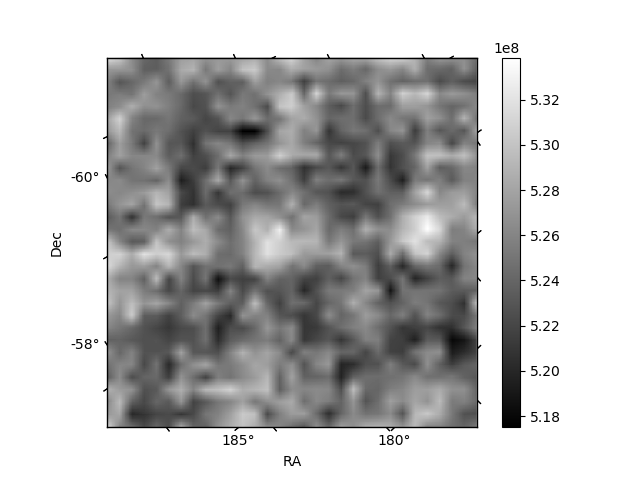
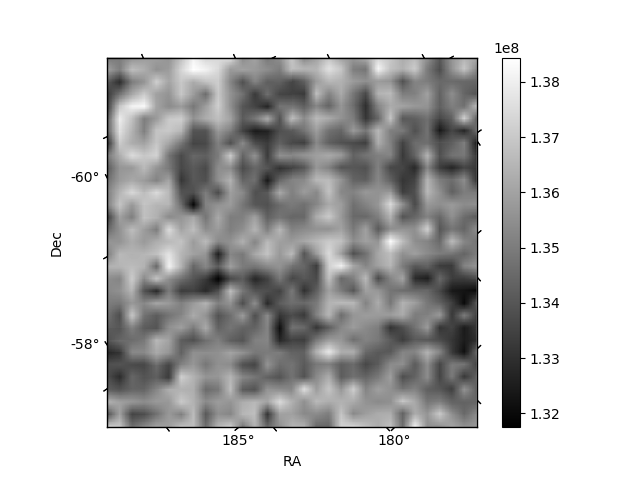
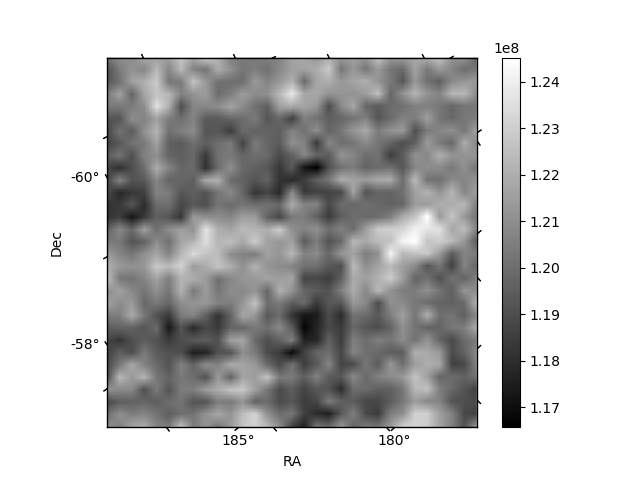
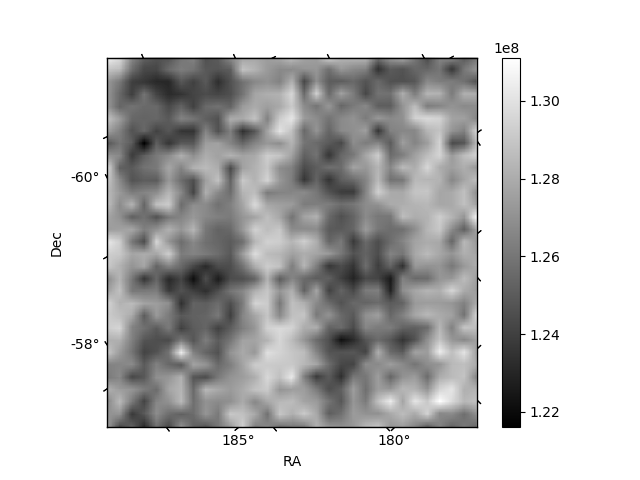
Histogram calculated using DETX and DETY for each event in the final _common_clean file
| Quadrant A | 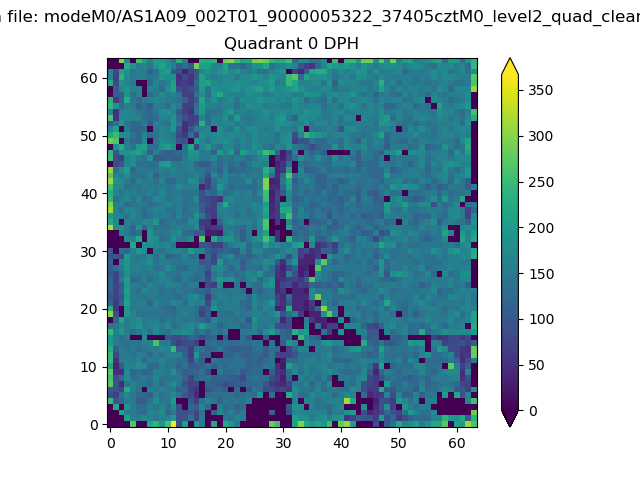 |
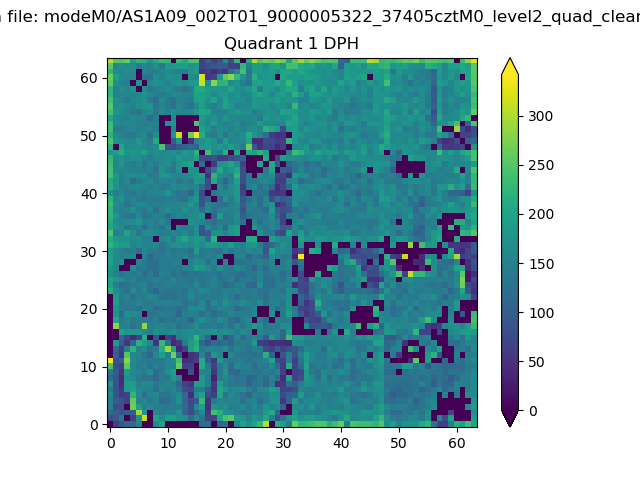 |
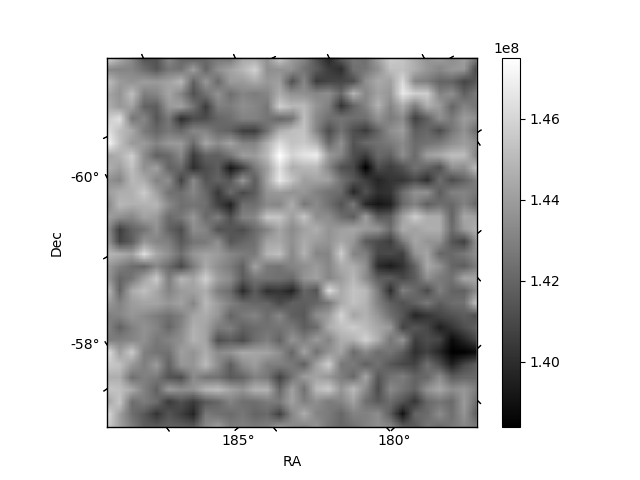
Quadrant B |
|---|---|---|---|
| Quadrant D | 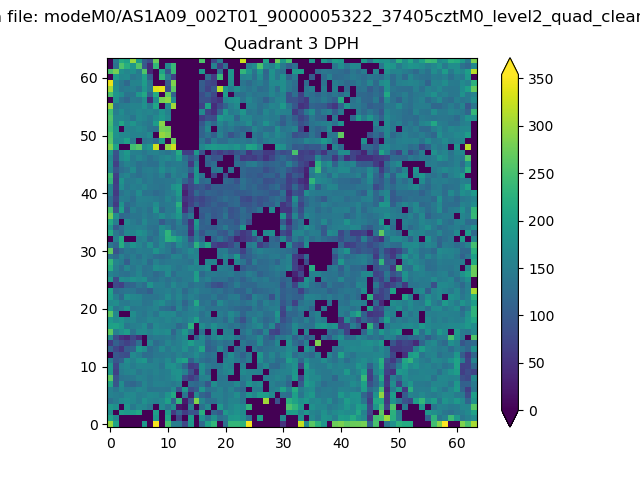 |
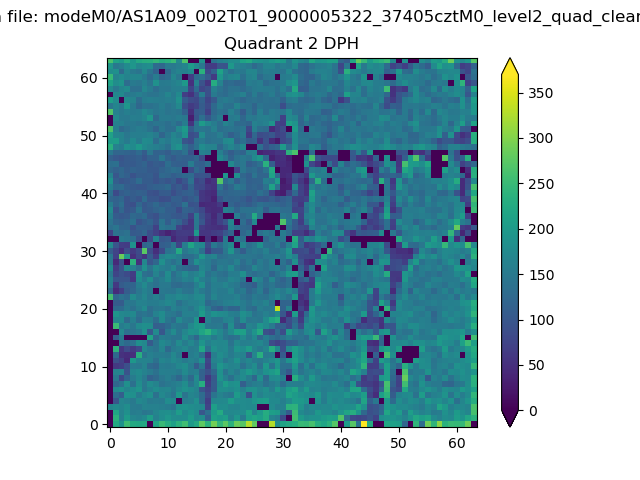 |
Quadrant C |
| Plot type | Count rate plots | Images |
|---|---|---|
| Comparison with Poisson distribution Blue bars denote a histogram of data divided into 1 sec bins. Red curve is a Poisson curve with rate = median count rate of data. |
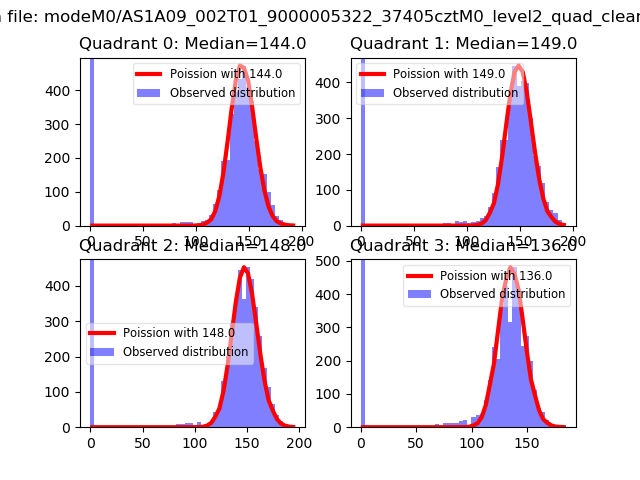 |
 |
| Quadrant-wise count rates Data is divided into 100 sec bins |
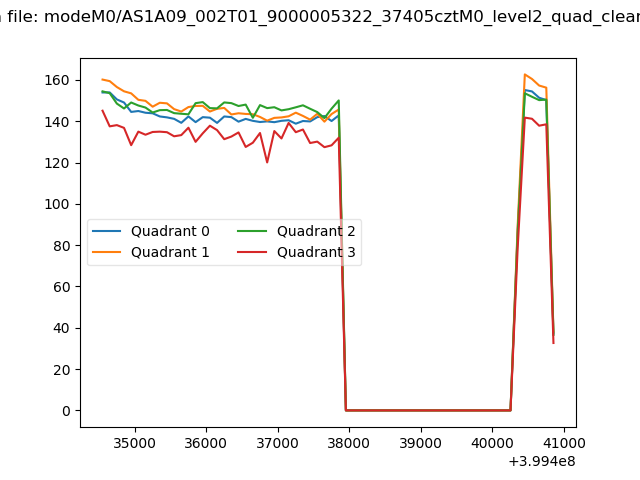 |
|
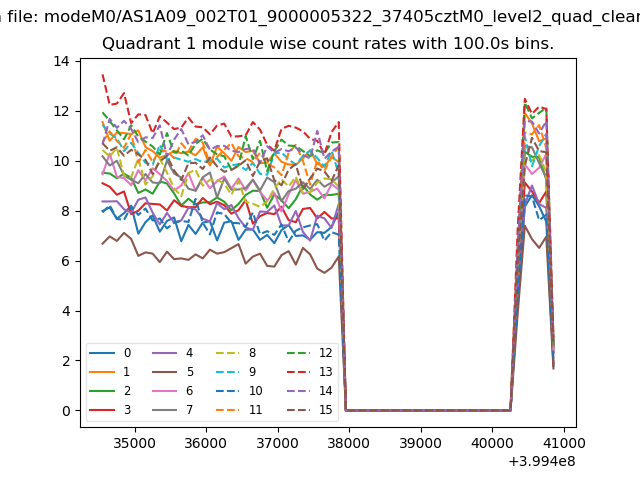
| Module-wise count rates for Quadrant A Data is divided into 100 sec bins |
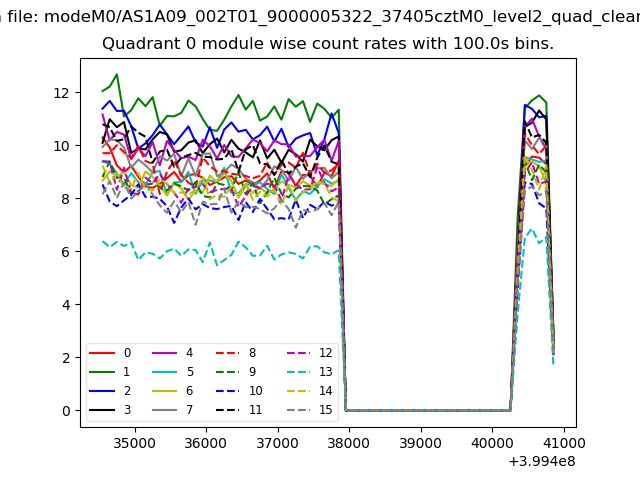 |
 |
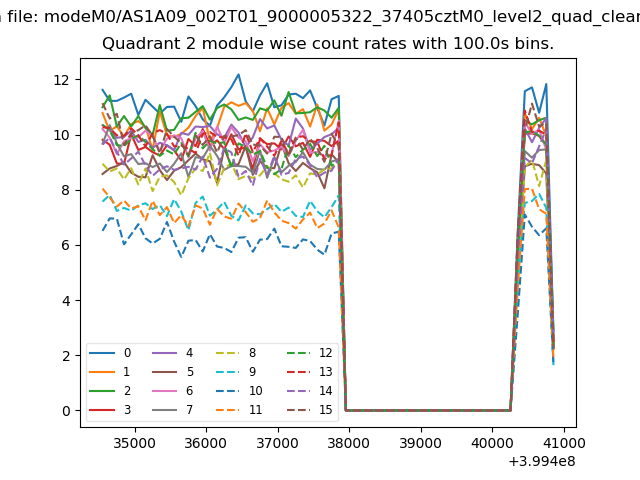
| Module-wise count rates for Quadrant B Data is divided into 100 sec bins |
 |
 |
| Module-wise count rates for Quadrant C Data is divided into 100 sec bins |
 |
 |
| Module-wise count rates for Quadrant D Data is divided into 100 sec bins |
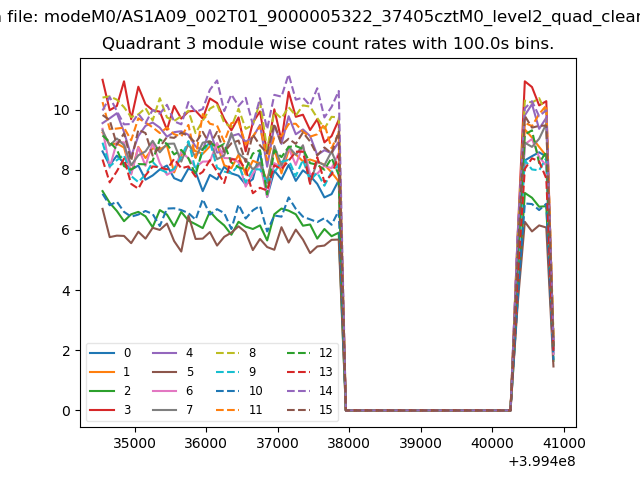 |
 |
| Parameter | Plot |
|---|---|
| CZT HV Monitor | 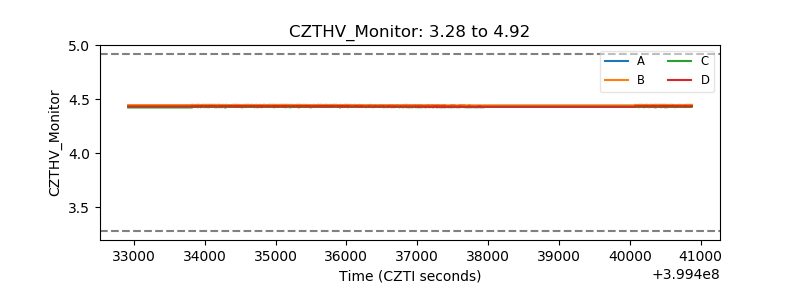 |
| D_VDD | 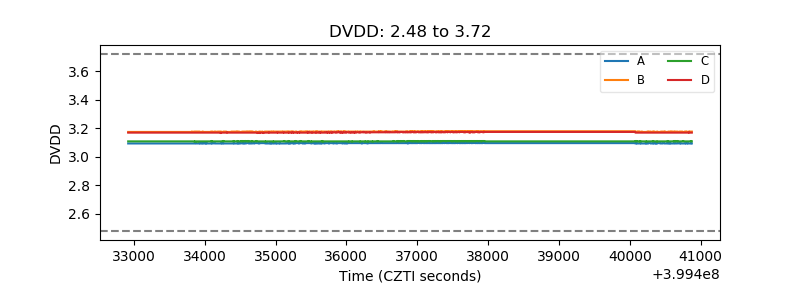 |
| Temperature 1 | 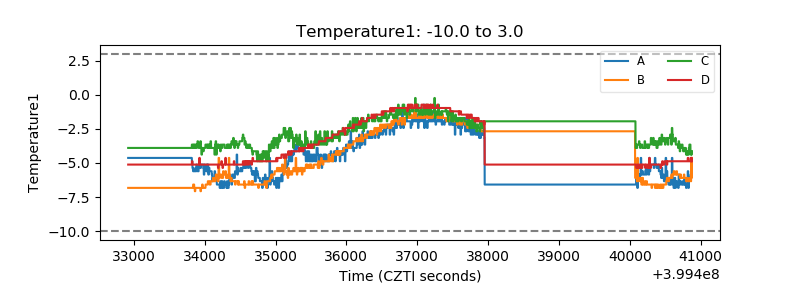 |
| Veto HV Monitor | 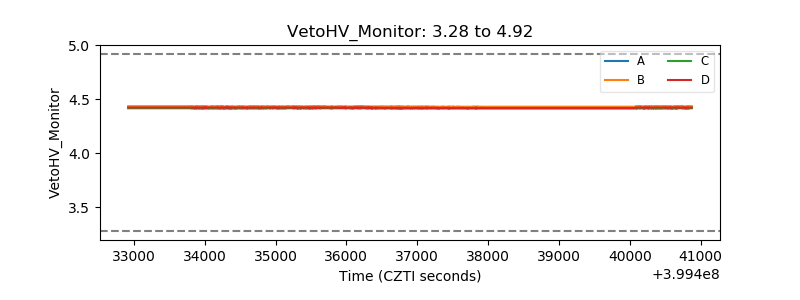 |
| Veto LLD | 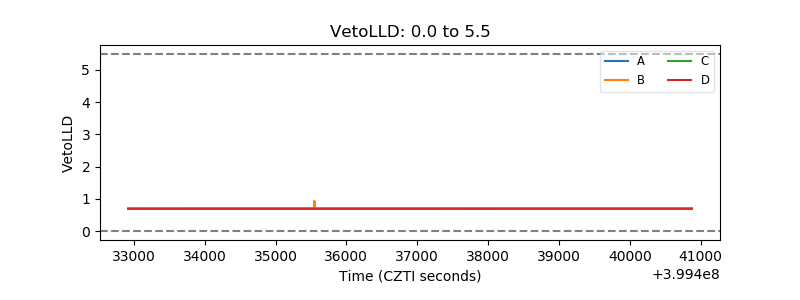 |
| Alpha Counter | 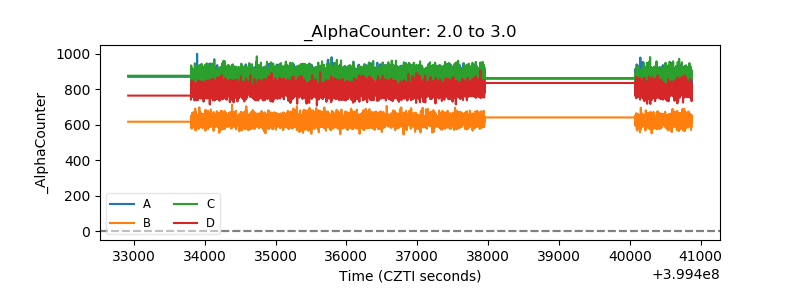 |
| _CPM_Rate |  |
| CZT Counter | 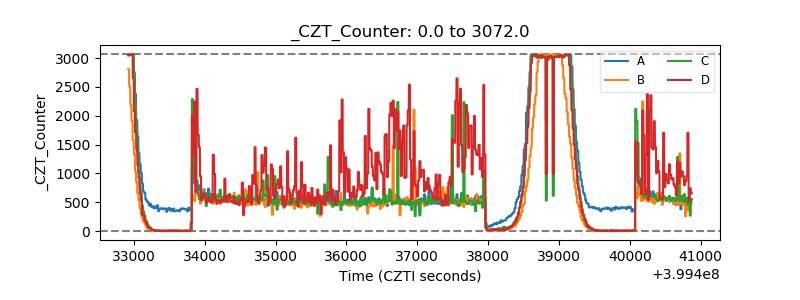 |
| +2.5 Volts monitor | 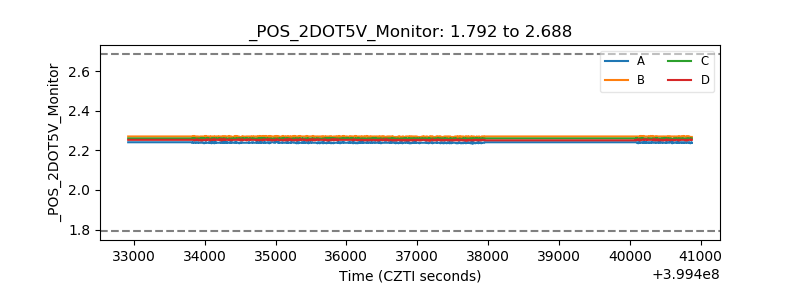 |
| +5 Volts monitor | 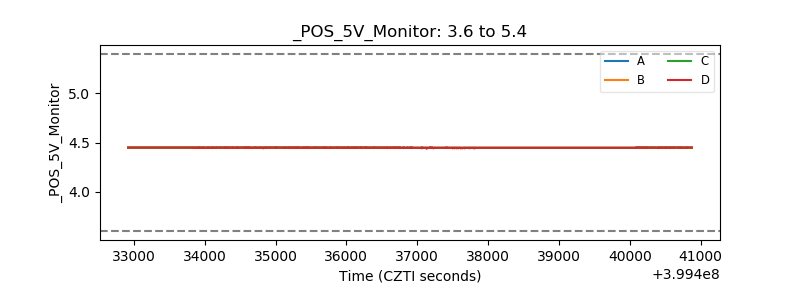 |
| _ROLL_ROT | 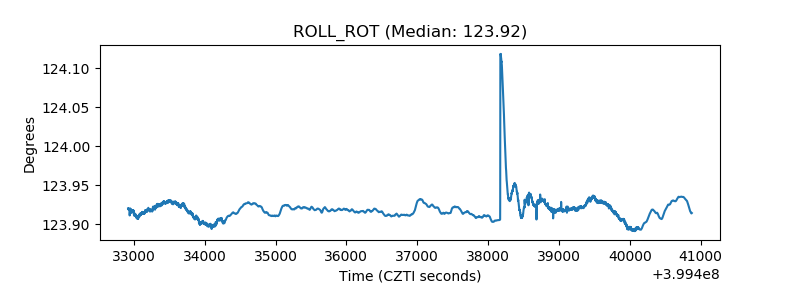 |
| _Roll_DEC | 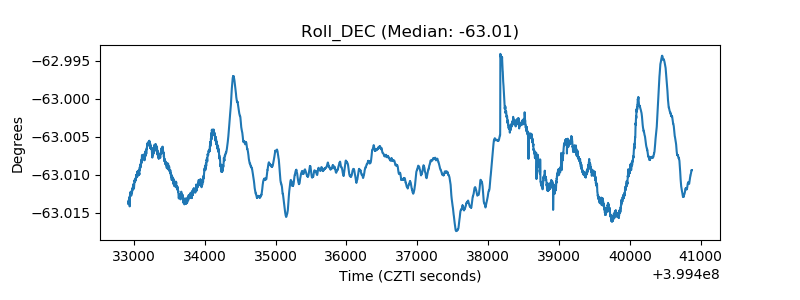 |
| _Roll_RA | 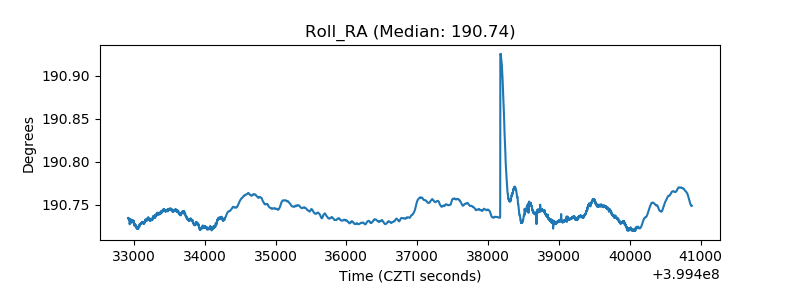 |
| Veto Counter | 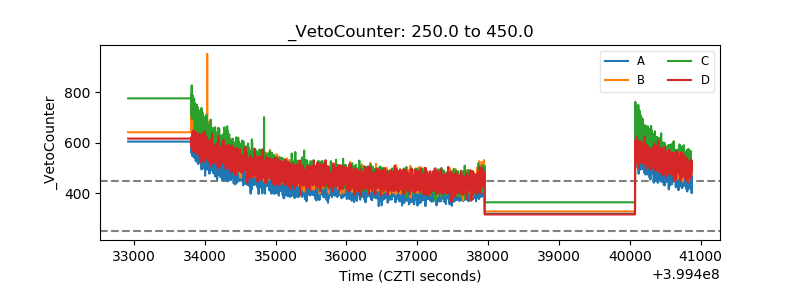 |