| Param | Original file | Final file |
|---|---|---|
| Filename | modeM0/AS1A09_002T01_9000005322_37406cztM0_level2.evt | modeM0/AS1A09_002T01_9000005322_37406cztM0_level2_quad_clean.evt |
| Size (bytes) | 430,104,960 | 98,910,720 |
| Size | 410.2 MB | 94.3 MB |
| Events in quadrant A | 3,154,660 | 650,778 |
| Events in quadrant B | 2,525,350 | 685,602 |
| Events in quadrant C | 2,707,980 | 681,925 |
| Events in quadrant D | 4,300,706 | 629,126 |
| Mode M0 | |||
|---|---|---|---|
| Quadrant | BADHDUFLAG | Total packets | Discarded packets |
| A | 0 | 12251 | 2 |
| B | 0 | 10457 | 1 |
| C | 0 | 10745 | 1 |
| D | 0 | 16157 | 1 |
| Mode M9 | |||
|---|---|---|---|
| Quadrant | BADHDUFLAG | Total packets | Discarded packets |
| A | 0 | 22 | 0 |
| B | 0 | 22 | 0 |
| C | 0 | 22 | 0 |
| D | 0 | 22 | 0 |
| Mode SS | |||
|---|---|---|---|
| Quadrant | BADHDUFLAG | Total packets | Discarded packets |
| A | 0 | 100 | 0 |
| B | 0 | 100 | 0 |
| C | 0 | 100 | 0 |
| D | 0 | 100 | 0 |
| Quadrant | Total seconds | Saturated seconds | Saturation percentage |
|---|---|---|---|
| A | 4970 | 234 | 4.708249% |
| B | 4970 | 26 | 0.523139% |
| C | 4970 | 18 | 0.362173% |
| D | 4970 | 153 | 3.078471% |
Noise dominated data is calculated using 1-second bins in cleaned event files. If a bin has >2000 counts, and if more than 50% of those come from <1% of pixels, then it is considered to be noise-dominated and hence unusable.
| Quadrant | # 1 sec bins | Bins with >0 counts | Bins with >2000 counts | High rate bins dominated by noise | Noise dominated (total time) | Noise dominated (detector-on time) | Marked lightcurve |
|---|---|---|---|---|---|---|---|
| A | 7124 | 4971 | 174 | 174 | 2.44% | 3.50% | 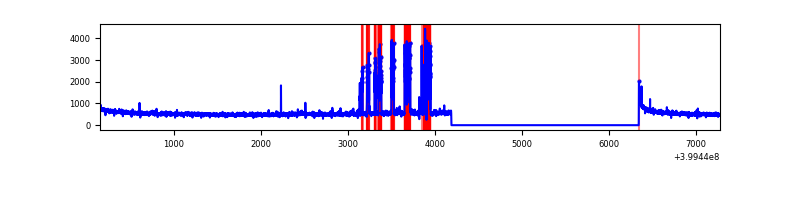 |
| B | 7124 | 4971 | 14 | 14 | 0.20% | 0.28% | 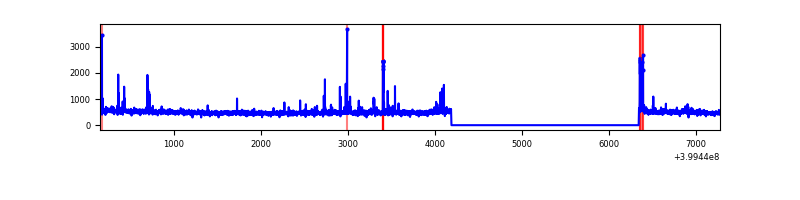 |
| C | 7124 | 4971 | 13 | 13 | 0.18% | 0.26% | 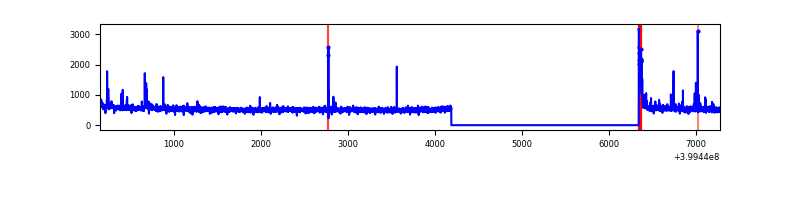 |
| D | 7124 | 4971 | 150 | 150 | 2.11% | 3.02% |  |
Top three noisy pixels from each quadrant. If the there are fewer than three noisy pixels in the level2.evt file, extra rows are filled as -1
| Pixel properties | Quadrant properties | ||||||
|---|---|---|---|---|---|---|---|
| Quadrant | DetID | PixID | Counts | Sigma | Mean | Median | Sigma |
| A | 15 | 222 | 563671 | 4762.64 | 598 | 590 | 118.2 |
| A | 10 | 83 | 243479 | 2054.4 | 598 | 590 | 118.2 |
| A | 13 | 6 | 13395 | 108.31 | 598 | 590 | 118.2 |
| B | 0 | 229 | 47707 | 415.39 | 603 | 588 | 113.4 |
| B | 5 | 172 | 38761 | 336.53 | 603 | 588 | 113.4 |
| B | 0 | 183 | 22087 | 189.53 | 603 | 588 | 113.4 |
| C | 15 | 214 | 214863 | 1567.28 | 600 | 605 | 136.7 |
| C | 0 | 10 | 68010 | 493.06 | 600 | 605 | 136.7 |
| C | 12 | 250 | 25361 | 181.09 | 600 | 605 | 136.7 |
| D | 1 | 52 | 1206446 | 8444.43 | 595 | 580 | 142.8 |
| D | 1 | 47 | 238594 | 1666.76 | 595 | 580 | 142.8 |
| D | 12 | 227 | 186529 | 1302.16 | 595 | 580 | 142.8 |
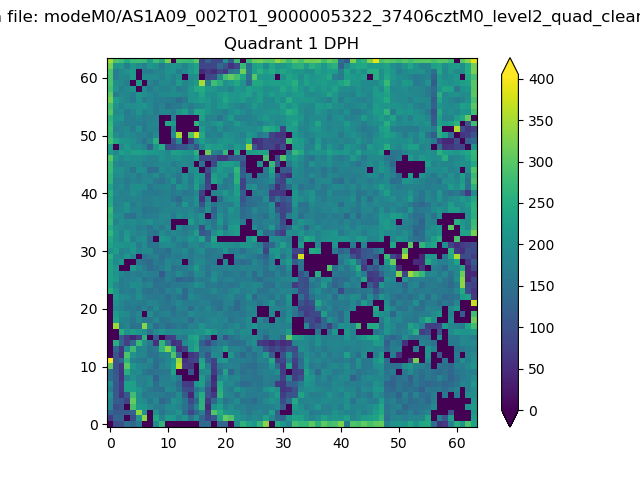
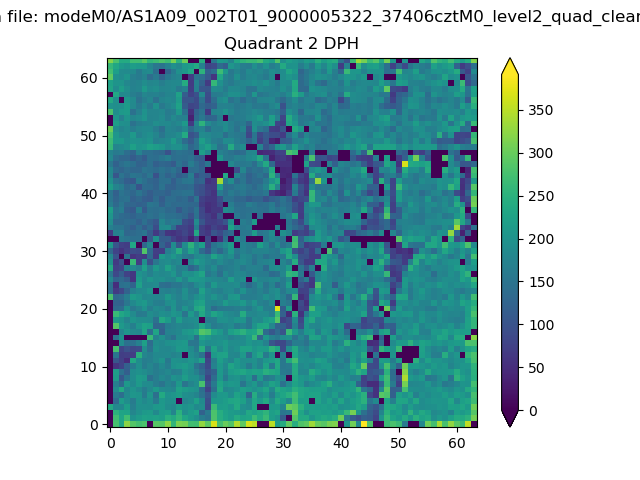
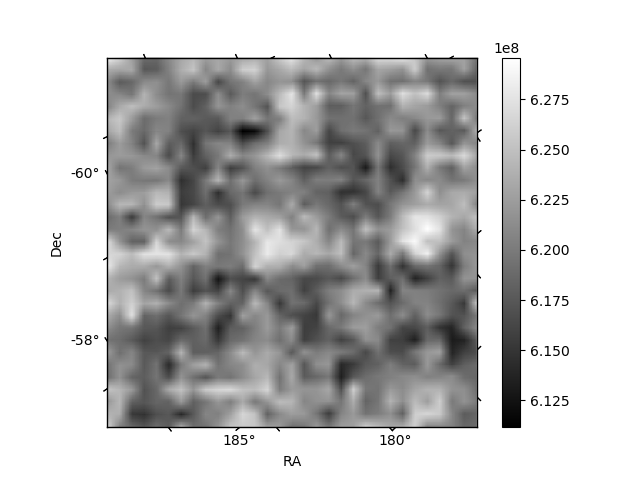
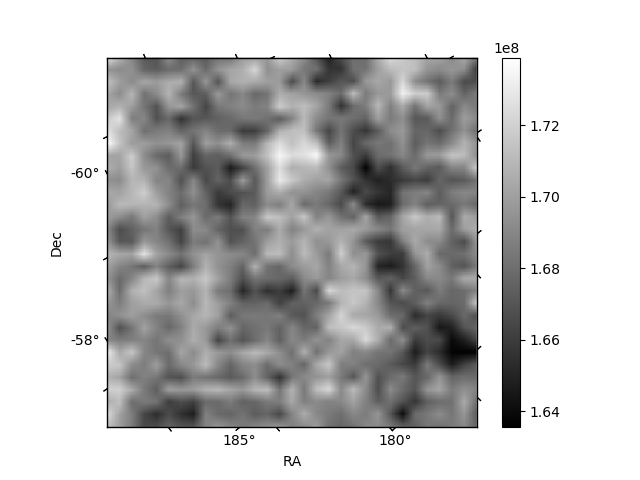
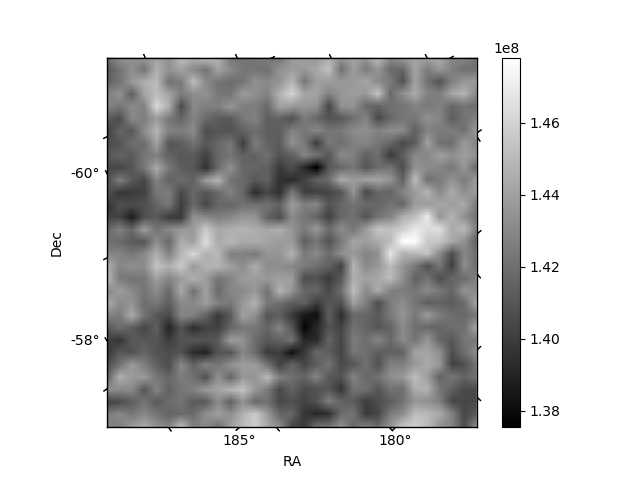
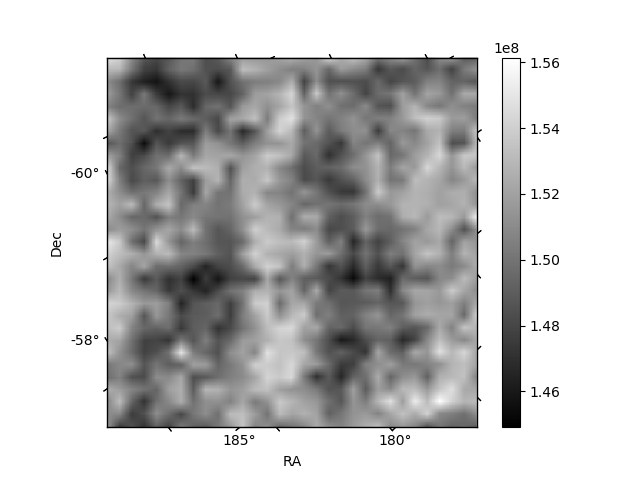
Histogram calculated using DETX and DETY for each event in the final _common_clean file
| Quadrant A | 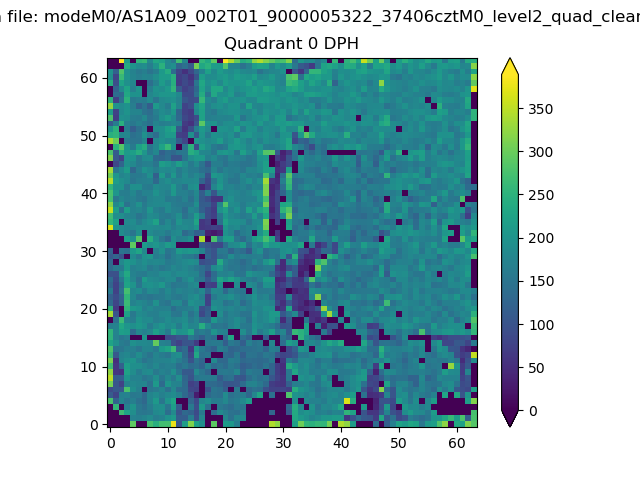 |
 |
Quadrant B |
|---|---|---|---|
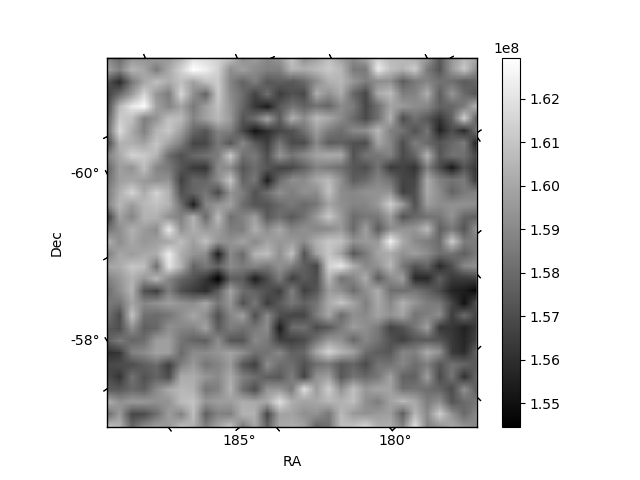
| Quadrant D | 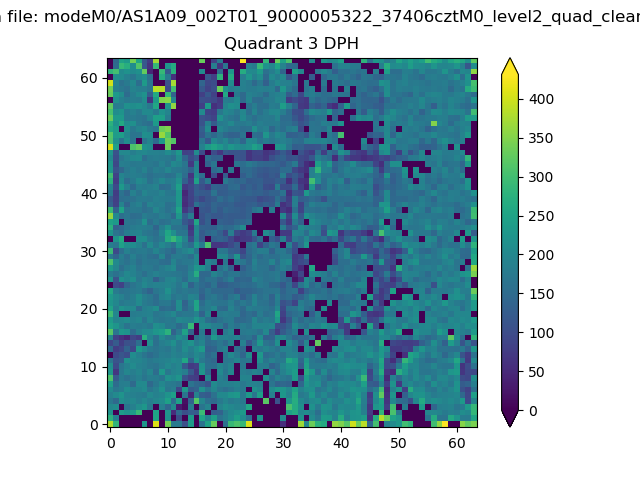 |
 |
Quadrant C |
| Plot type | Count rate plots | Images |
|---|---|---|
| Comparison with Poisson distribution Blue bars denote a histogram of data divided into 1 sec bins. Red curve is a Poisson curve with rate = median count rate of data. |
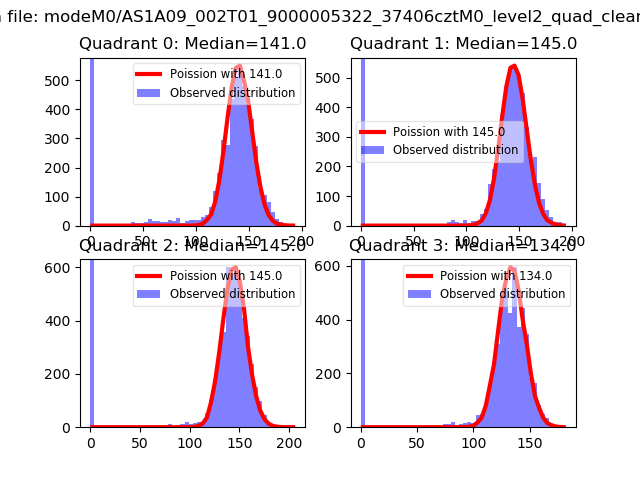 |
 |
| Quadrant-wise count rates Data is divided into 100 sec bins |
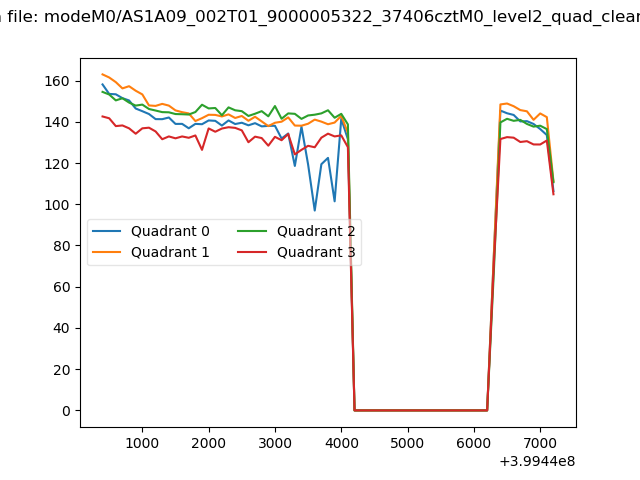 |
|
| Module-wise count rates for Quadrant A Data is divided into 100 sec bins |
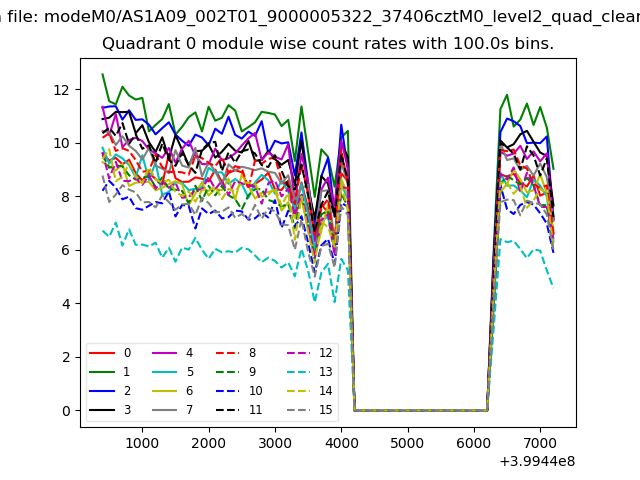 |
 |
| Module-wise count rates for Quadrant B Data is divided into 100 sec bins |
 |
 |
| Module-wise count rates for Quadrant C Data is divided into 100 sec bins |
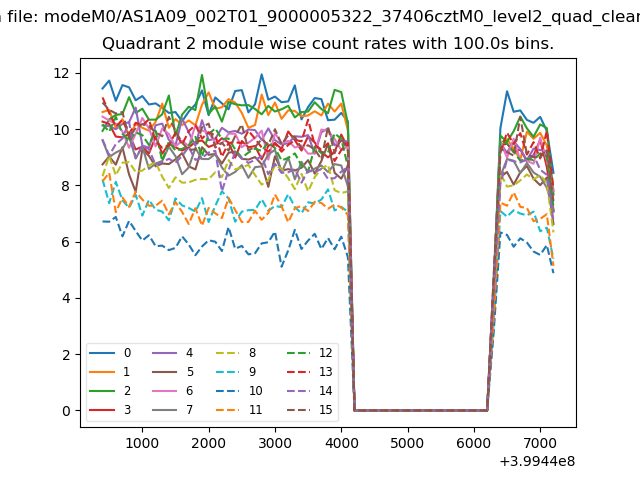 |
 |
| Module-wise count rates for Quadrant D Data is divided into 100 sec bins |
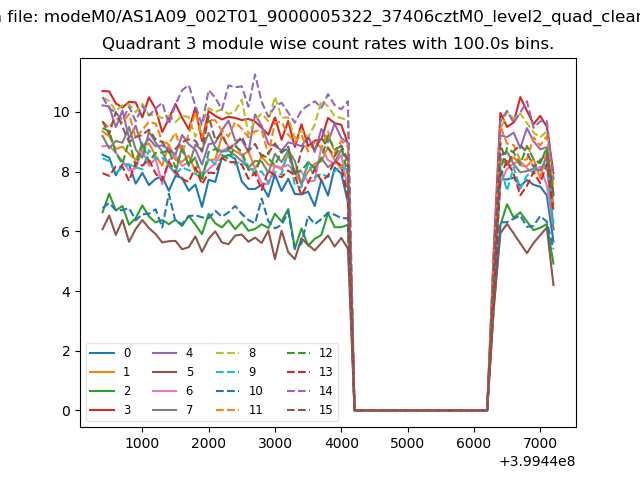 |
 |
| Parameter | Plot |
|---|---|
| CZT HV Monitor |  |
| D_VDD | 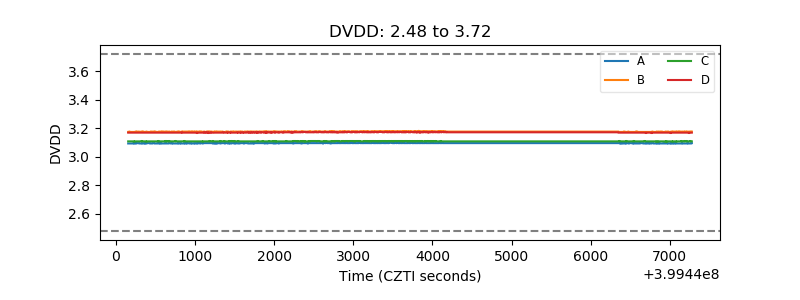 |
| Temperature 1 | 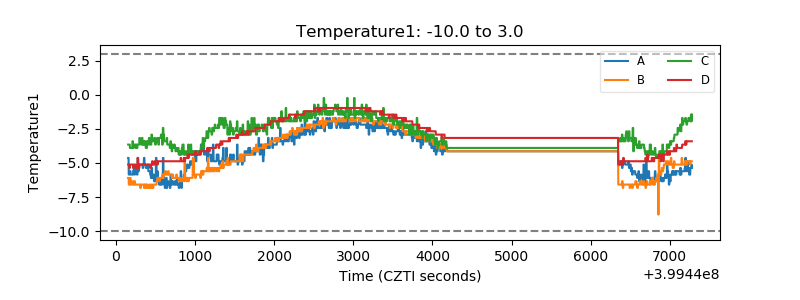 |
| Veto HV Monitor | 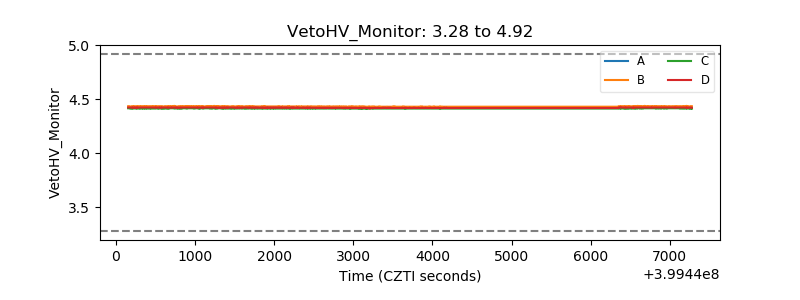 |
| Veto LLD | 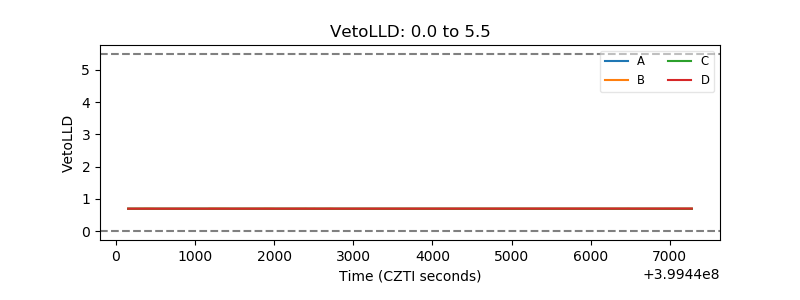 |
| Alpha Counter | 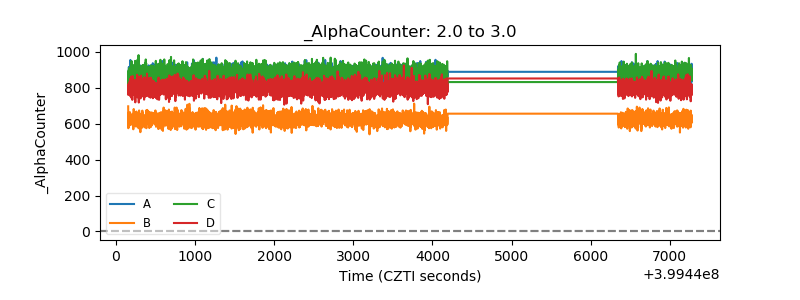 |
| _CPM_Rate | 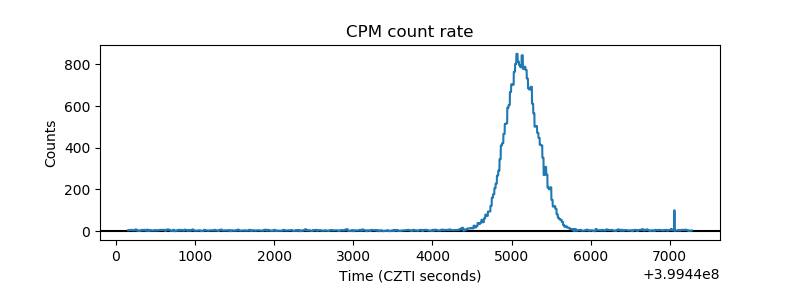 |
| CZT Counter | 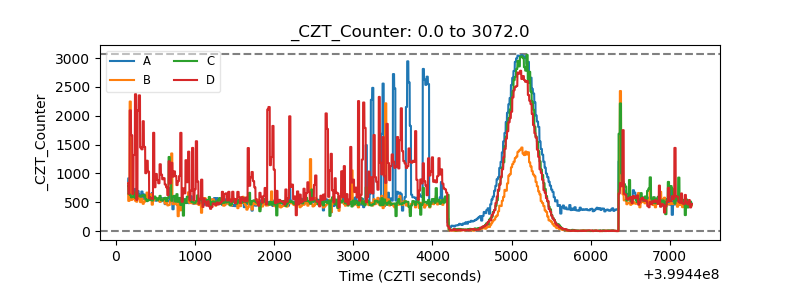 |
| +2.5 Volts monitor | 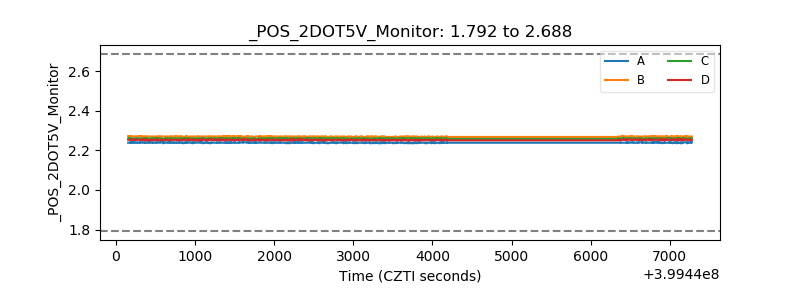 |
| +5 Volts monitor | 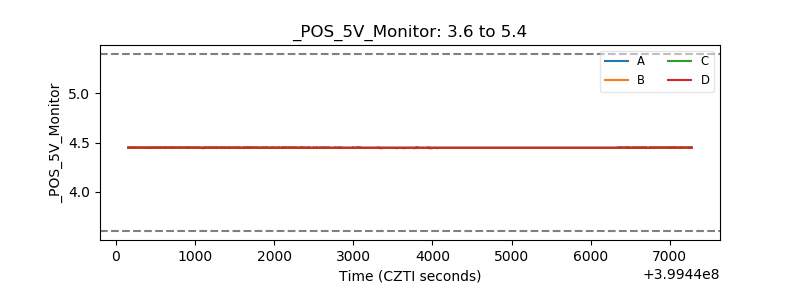 |
| _ROLL_ROT | 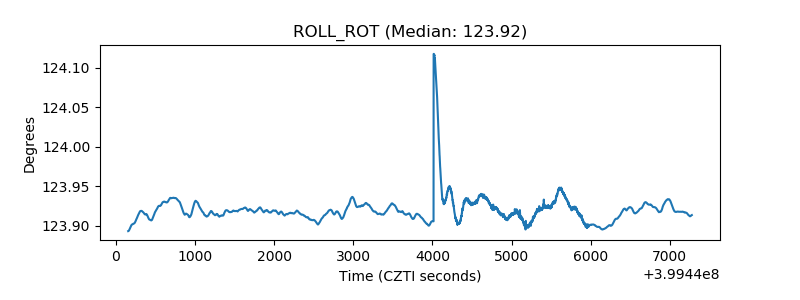 |
| _Roll_DEC | 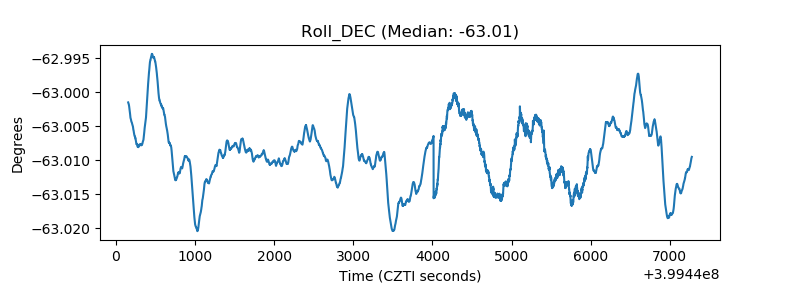 |
| _Roll_RA | 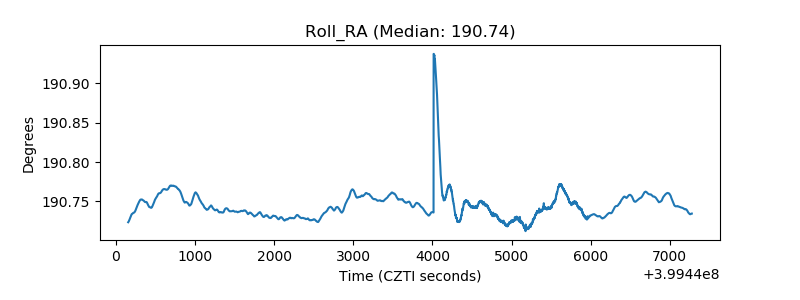 |
| Veto Counter | 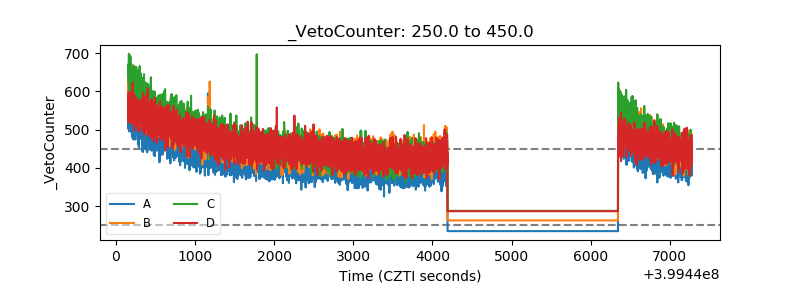 |