| Param | Original file | Final file |
|---|---|---|
| Filename | modeM0/AS1A09_002T01_9000005322_37407cztM0_level2.evt | modeM0/AS1A09_002T01_9000005322_37407cztM0_level2_quad_clean.evt |
| Size (bytes) | 426,830,400 | 98,435,520 |
| Size | 407.1 MB | 93.9 MB |
| Events in quadrant A | 3,130,743 | 646,909 |
| Events in quadrant B | 2,671,799 | 673,424 |
| Events in quadrant C | 2,717,219 | 681,353 |
| Events in quadrant D | 4,066,531 | 628,083 |
| Mode M0 | |||
|---|---|---|---|
| Quadrant | BADHDUFLAG | Total packets | Discarded packets |
| A | 0 | 12354 | 3 |
| B | 0 | 11103 | 2 |
| C | 0 | 10927 | 2 |
| D | 0 | 15294 | 2 |
| Mode M9 | |||
|---|---|---|---|
| Quadrant | BADHDUFLAG | Total packets | Discarded packets |
| A | 0 | 23 | 0 |
| B | 0 | 23 | 0 |
| C | 0 | 23 | 0 |
| D | 0 | 24 | 0 |
| Mode SS | |||
|---|---|---|---|
| Quadrant | BADHDUFLAG | Total packets | Discarded packets |
| A | 0 | 102 | 0 |
| B | 0 | 102 | 0 |
| C | 0 | 102 | 0 |
| D | 0 | 102 | 0 |
| Quadrant | Total seconds | Saturated seconds | Saturation percentage |
|---|---|---|---|
| A | 5009 | 253 | 5.050908% |
| B | 5009 | 115 | 2.295867% |
| C | 5009 | 42 | 0.838491% |
| D | 5009 | 320 | 6.388501% |
Noise dominated data is calculated using 1-second bins in cleaned event files. If a bin has >2000 counts, and if more than 50% of those come from <1% of pixels, then it is considered to be noise-dominated and hence unusable.
| Quadrant | # 1 sec bins | Bins with >0 counts | Bins with >2000 counts | High rate bins dominated by noise | Noise dominated (total time) | Noise dominated (detector-on time) | Marked lightcurve |
|---|---|---|---|---|---|---|---|
| A | 7072 | 5010 | 220 | 220 | 3.11% | 4.39% | 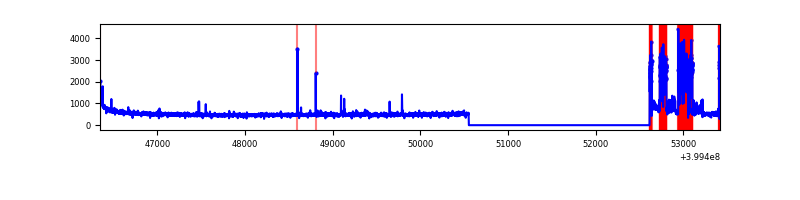 |
| B | 7072 | 5010 | 71 | 71 | 1.00% | 1.42% | 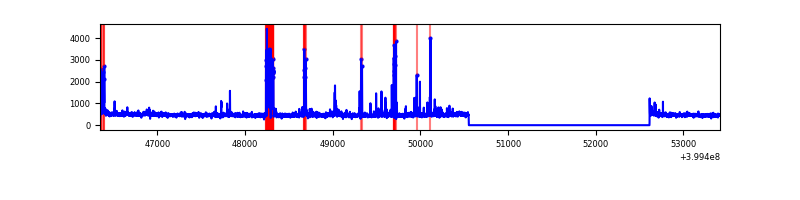 |
| C | 7072 | 5010 | 31 | 31 | 0.44% | 0.62% | 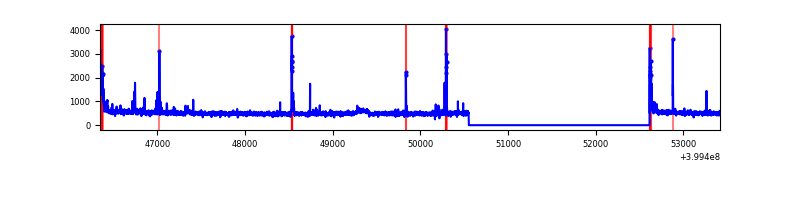 |
| D | 7072 | 5010 | 285 | 285 | 4.03% | 5.69% | 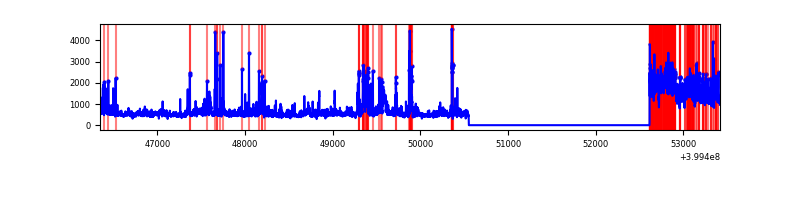 |
Top three noisy pixels from each quadrant. If the there are fewer than three noisy pixels in the level2.evt file, extra rows are filled as -1
| Pixel properties | Quadrant properties | ||||||
|---|---|---|---|---|---|---|---|
| Quadrant | DetID | PixID | Counts | Sigma | Mean | Median | Sigma |
| A | 15 | 222 | 607138 | 5334.87 | 569 | 559 | 113.7 |
| A | 10 | 83 | 256329 | 2249.5 | 569 | 559 | 113.7 |
| A | 5 | 168 | 23046 | 197.77 | 569 | 559 | 113.7 |
| B | 0 | 229 | 205485 | 1884.39 | 575 | 561 | 108.7 |
| B | 5 | 255 | 101088 | 924.4 | 575 | 561 | 108.7 |
| B | 5 | 172 | 69063 | 629.91 | 575 | 561 | 108.7 |
| C | 15 | 214 | 217424 | 1662.5 | 573 | 579 | 130.4 |
| C | 0 | 10 | 109063 | 831.72 | 573 | 579 | 130.4 |
| C | 14 | 254 | 40884 | 309.01 | 573 | 579 | 130.4 |
| D | 12 | 227 | 1062822 | 7676.12 | 568 | 554 | 138.4 |
| D | 12 | 235 | 161449 | 1162.65 | 568 | 554 | 138.4 |
| D | 1 | 52 | 149985 | 1079.81 | 568 | 554 | 138.4 |
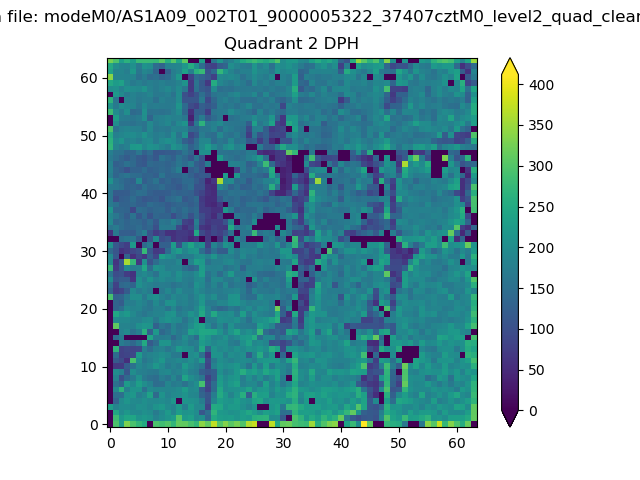
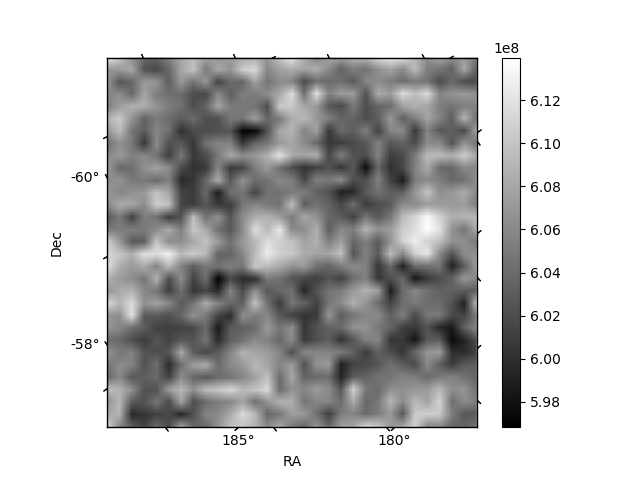
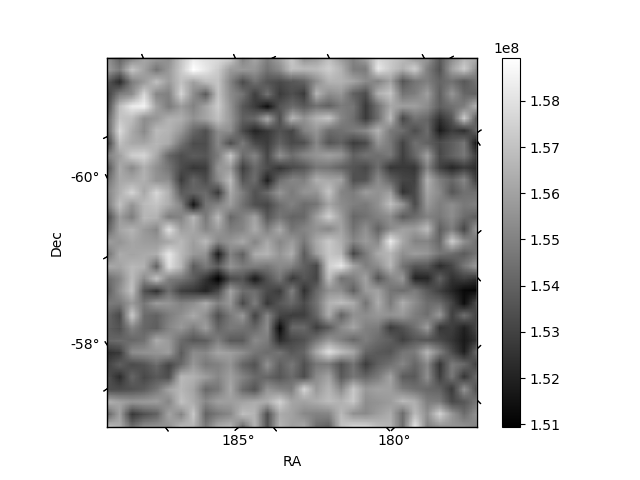
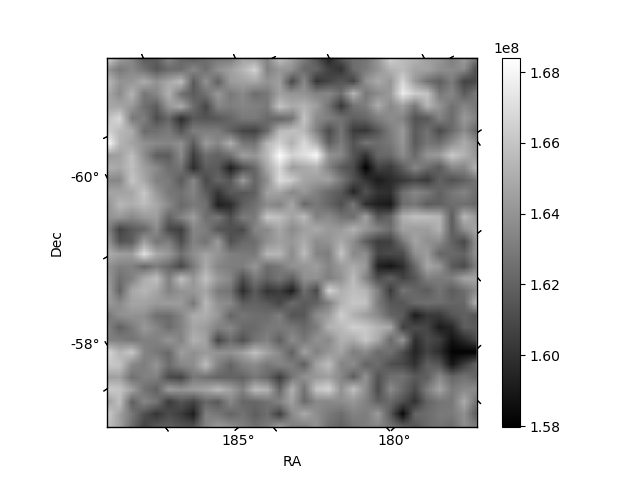
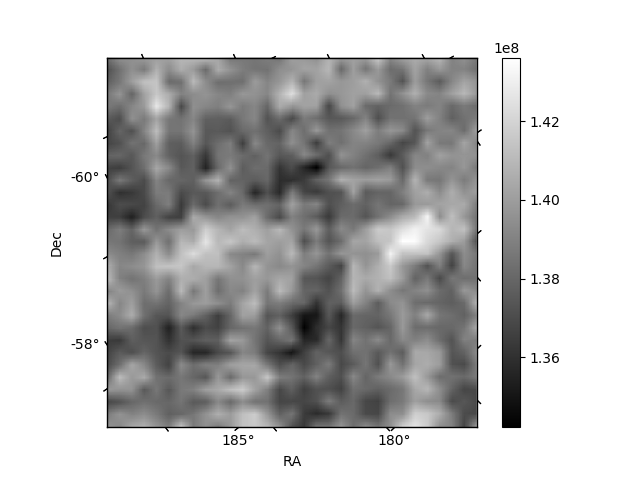
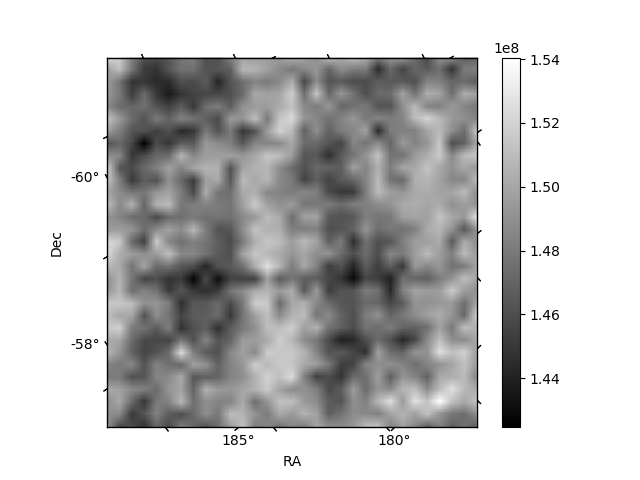
Histogram calculated using DETX and DETY for each event in the final _common_clean file
| Quadrant A | 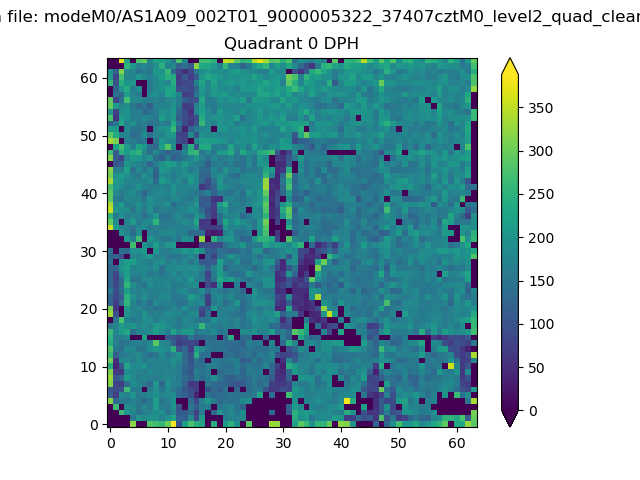 |
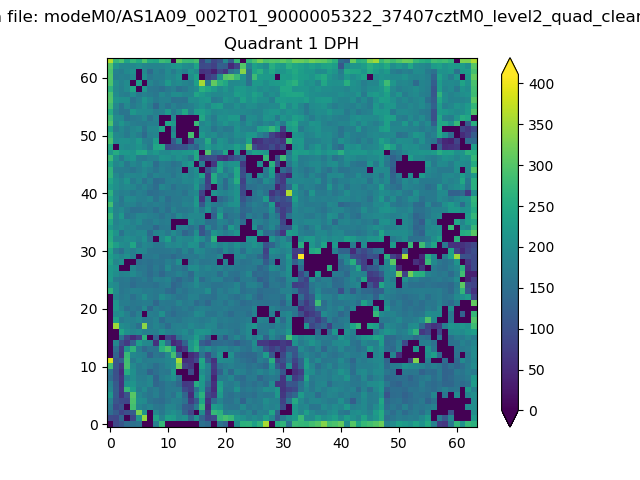 |
Quadrant B |
|---|---|---|---|
| Quadrant D | 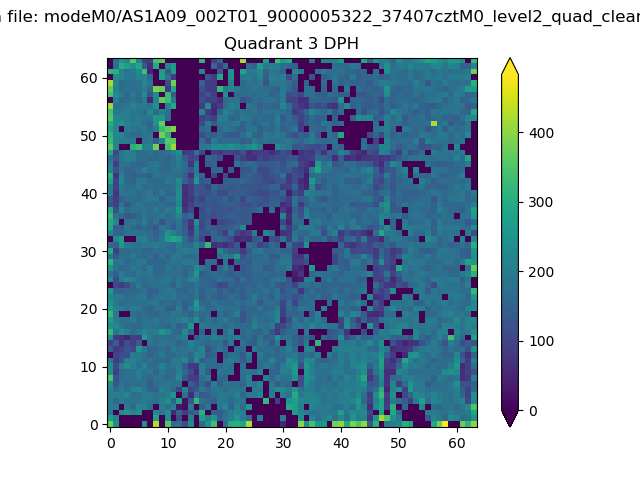 |
 |
Quadrant C |
| Plot type | Count rate plots | Images |
|---|---|---|
| Comparison with Poisson distribution Blue bars denote a histogram of data divided into 1 sec bins. Red curve is a Poisson curve with rate = median count rate of data. |
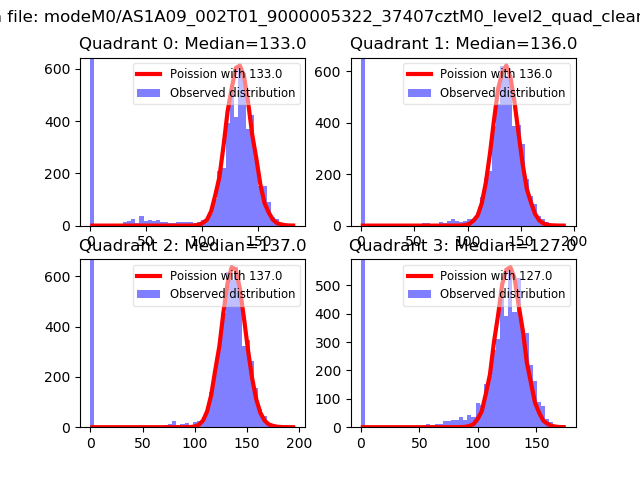 |
 |
| Quadrant-wise count rates Data is divided into 100 sec bins |
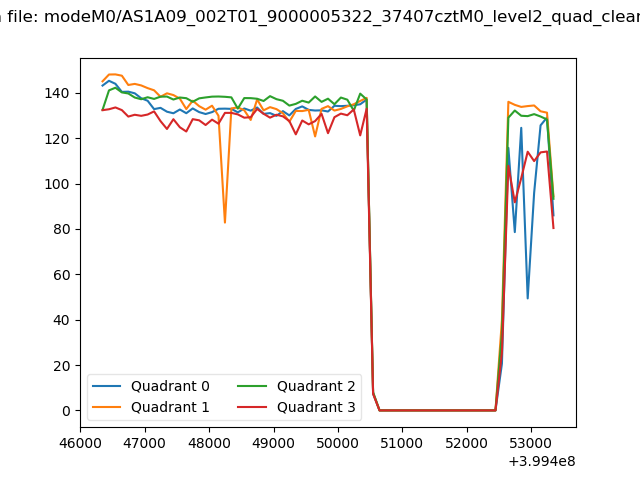 |
|
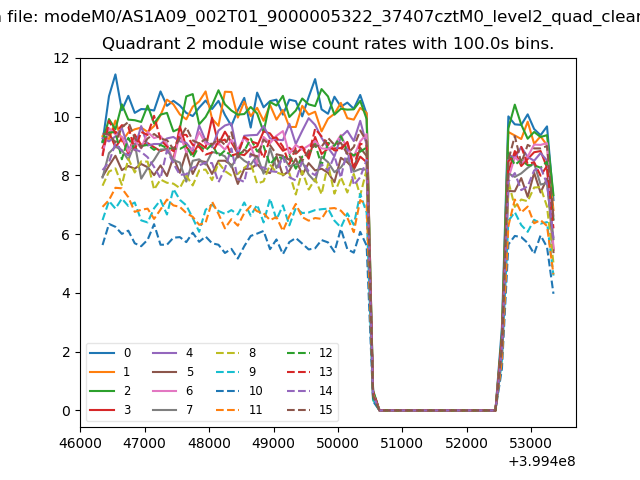
| Module-wise count rates for Quadrant A Data is divided into 100 sec bins |
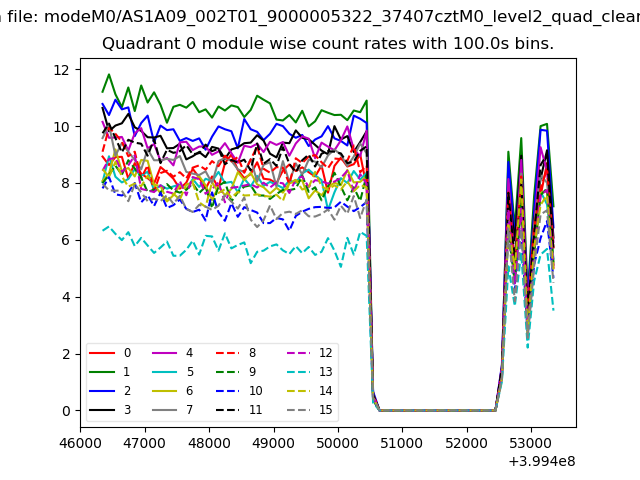 |
 |
| Module-wise count rates for Quadrant B Data is divided into 100 sec bins |
 |
 |
| Module-wise count rates for Quadrant C Data is divided into 100 sec bins |
 |
 |
| Module-wise count rates for Quadrant D Data is divided into 100 sec bins |
 |
 |
| Parameter | Plot |
|---|---|
| CZT HV Monitor | 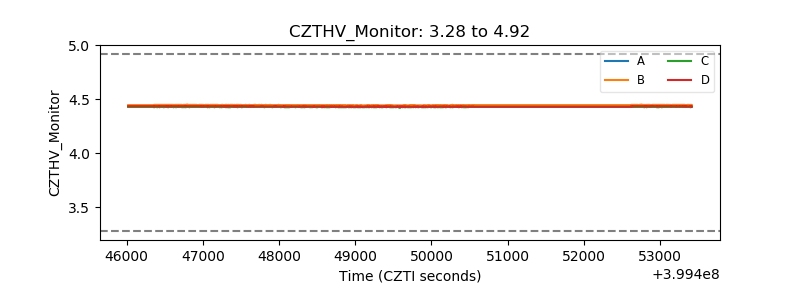 |
| D_VDD | 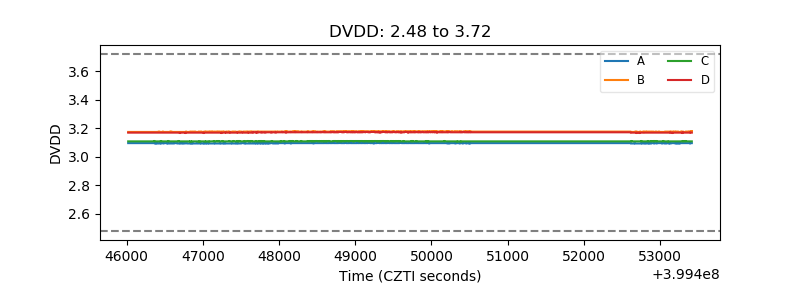 |
| Temperature 1 | 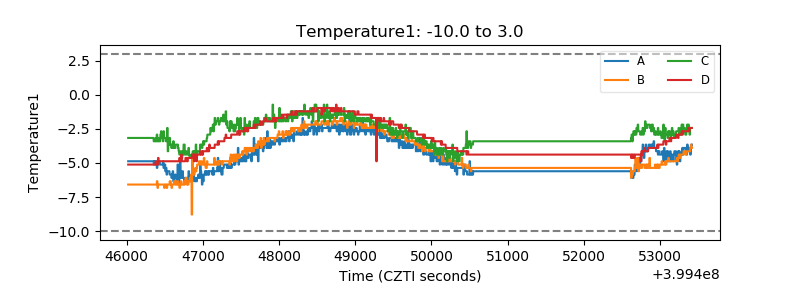 |
| Veto HV Monitor | 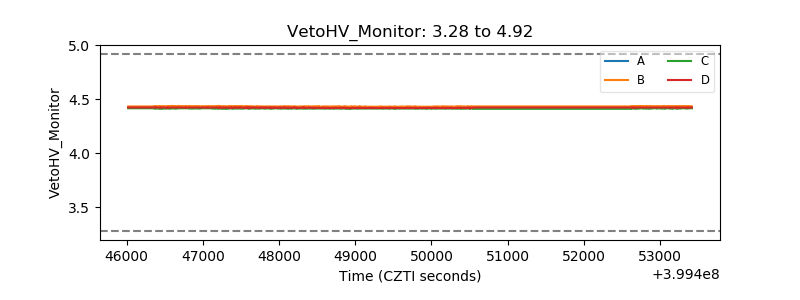 |
| Veto LLD | 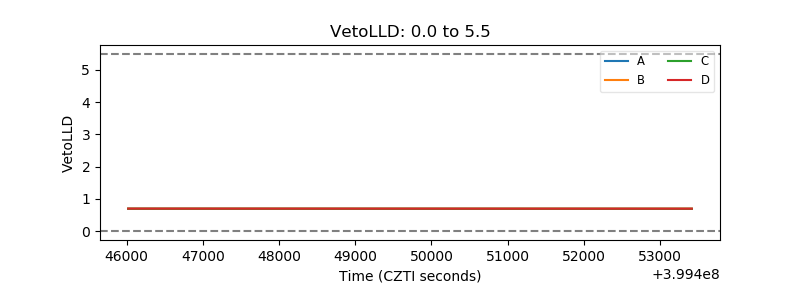 |
| Alpha Counter | 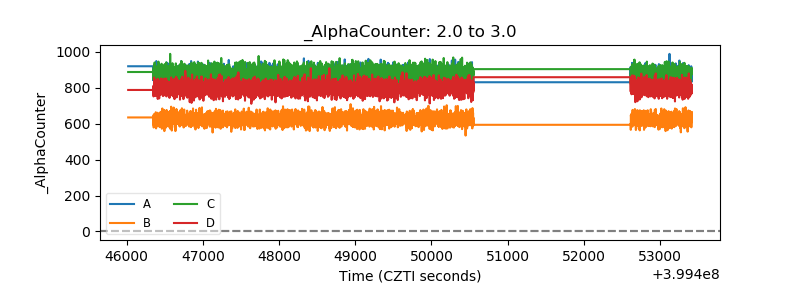 |
| _CPM_Rate | 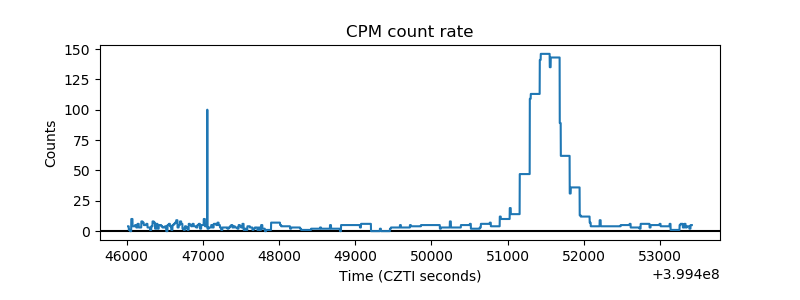 |
| CZT Counter | 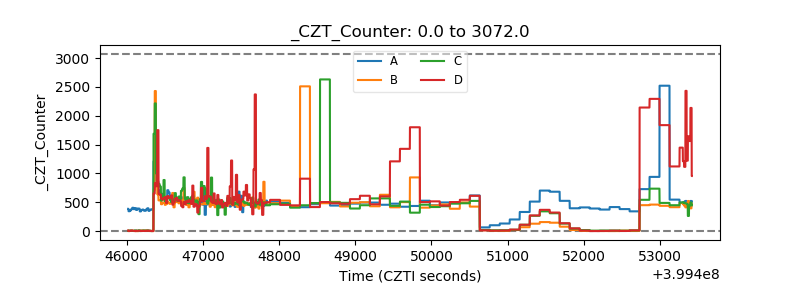 |
| +2.5 Volts monitor | 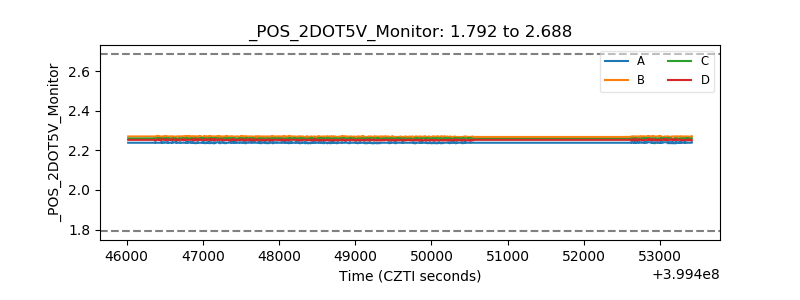 |
| +5 Volts monitor | 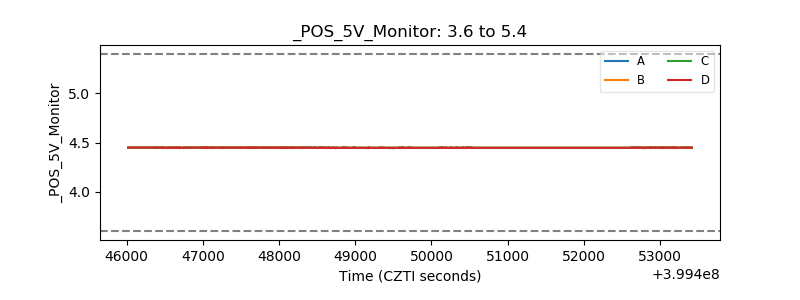 |
| _ROLL_ROT |  |
| _Roll_DEC | 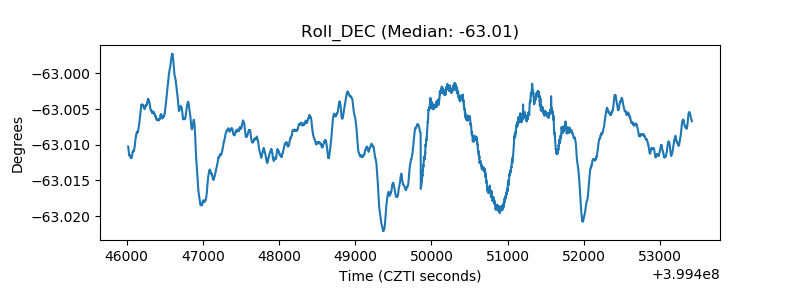 |
| _Roll_RA | 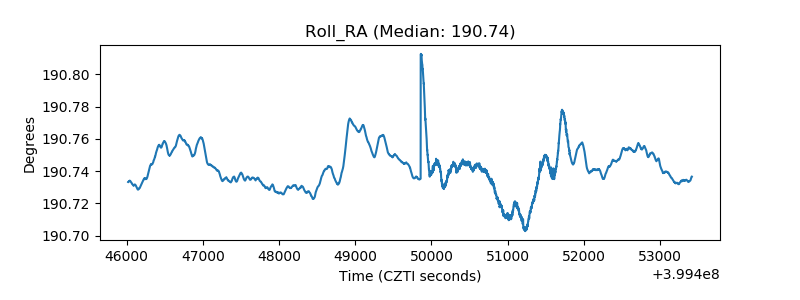 |
| Veto Counter | 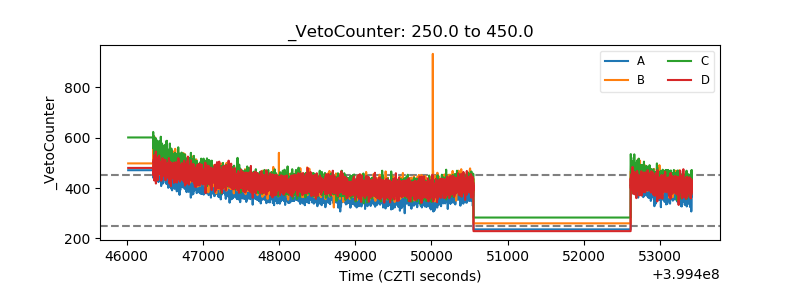 |