| Param | Original file | Final file |
|---|---|---|
| Filename | modeM0/AS1A09_002T01_9000005322_37408cztM0_level2.evt | modeM0/AS1A09_002T01_9000005322_37408cztM0_level2_quad_clean.evt |
| Size (bytes) | 545,388,480 | 89,726,400 |
| Size | 520.1 MB | 85.6 MB |
| Events in quadrant A | 3,472,336 | 570,745 |
| Events in quadrant B | 2,567,053 | 612,948 |
| Events in quadrant C | 3,083,574 | 610,639 |
| Events in quadrant D | 7,032,794 | 548,620 |
| Mode M0 | |||
|---|---|---|---|
| Quadrant | BADHDUFLAG | Total packets | Discarded packets |
| A | 0 | 13598 | 3 |
| B | 0 | 11215 | 2 |
| C | 0 | 12362 | 2 |
| D | 0 | 24654 | 2 |
| Mode M9 | |||
|---|---|---|---|
| Quadrant | BADHDUFLAG | Total packets | Discarded packets |
| A | 0 | 21 | 0 |
| B | 0 | 21 | 0 |
| C | 0 | 21 | 0 |
| D | 0 | 22 | 0 |
| Mode SS | |||
|---|---|---|---|
| Quadrant | BADHDUFLAG | Total packets | Discarded packets |
| A | 0 | 110 | 0 |
| B | 0 | 110 | 0 |
| C | 0 | 110 | 0 |
| D | 0 | 110 | 0 |
| Quadrant | Total seconds | Saturated seconds | Saturation percentage |
|---|---|---|---|
| A | 5334 | 356 | 6.674166% |
| B | 5334 | 32 | 0.599925% |
| C | 5334 | 140 | 2.624672% |
| D | 5334 | 614 | 11.511061% |
Noise dominated data is calculated using 1-second bins in cleaned event files. If a bin has >2000 counts, and if more than 50% of those come from <1% of pixels, then it is considered to be noise-dominated and hence unusable.
| Quadrant | # 1 sec bins | Bins with >0 counts | Bins with >2000 counts | High rate bins dominated by noise | Noise dominated (total time) | Noise dominated (detector-on time) | Marked lightcurve |
|---|---|---|---|---|---|---|---|
| A | 7067 | 5335 | 314 | 314 | 4.44% | 5.89% | 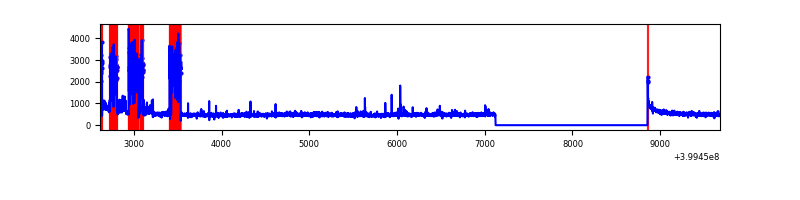 |
| B | 7067 | 5335 | 27 | 27 | 0.38% | 0.51% | 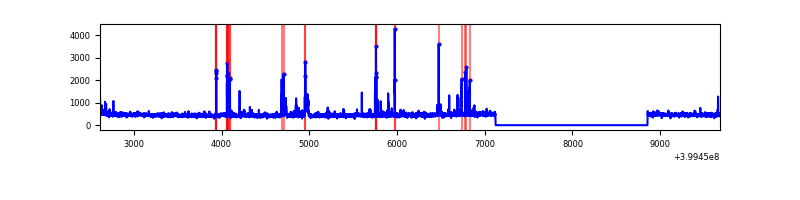 |
| C | 7067 | 5335 | 109 | 109 | 1.54% | 2.04% | 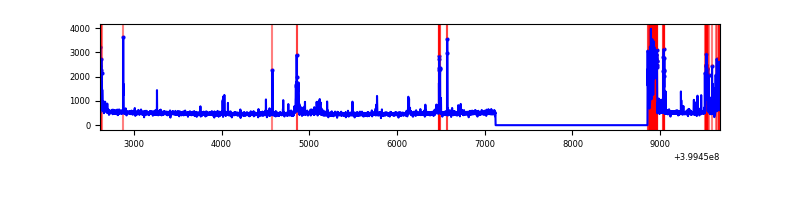 |
| D | 7067 | 5335 | 611 | 611 | 8.65% | 11.45% | 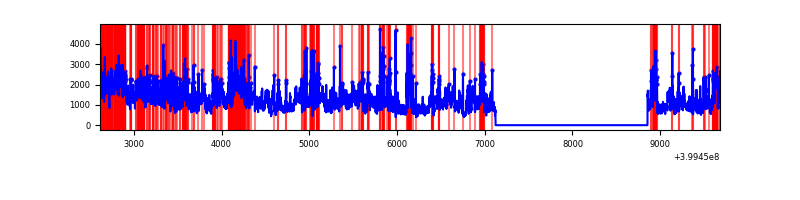 |
Top three noisy pixels from each quadrant. If the there are fewer than three noisy pixels in the level2.evt file, extra rows are filled as -1
| Pixel properties | Quadrant properties | ||||||
|---|---|---|---|---|---|---|---|
| Quadrant | DetID | PixID | Counts | Sigma | Mean | Median | Sigma |
| A | 15 | 222 | 867985 | 7386.47 | 580 | 569 | 117.4 |
| A | 10 | 83 | 274600 | 2333.51 | 580 | 569 | 117.4 |
| A | 5 | 168 | 23199 | 192.71 | 580 | 569 | 117.4 |
| B | 5 | 172 | 122320 | 1070.15 | 596 | 581 | 113.8 |
| B | 5 | 255 | 46385 | 402.64 | 596 | 581 | 113.8 |
| B | 5 | 184 | 20865 | 178.31 | 596 | 581 | 113.8 |
| C | 14 | 254 | 473694 | 3499.05 | 584 | 589 | 135.2 |
| C | 15 | 214 | 228190 | 1683.32 | 584 | 589 | 135.2 |
| C | 0 | 10 | 71058 | 521.18 | 584 | 589 | 135.2 |
| D | 12 | 227 | 3700528 | 26073.21 | 575 | 558 | 141.9 |
| D | 10 | 199 | 212879 | 1496.2 | 575 | 558 | 141.9 |
| D | 13 | 249 | 181532 | 1275.3 | 575 | 558 | 141.9 |
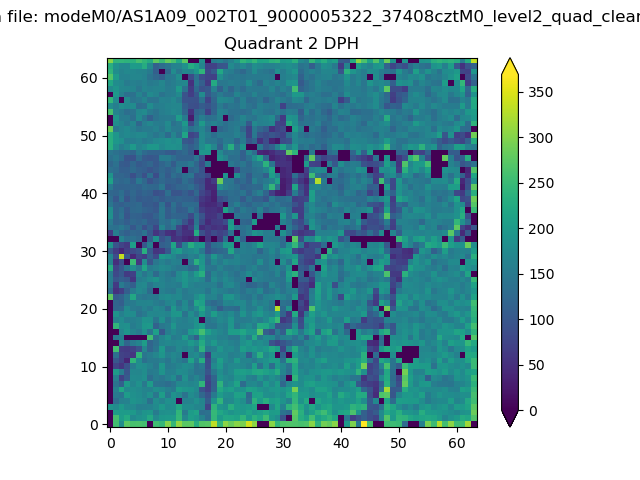
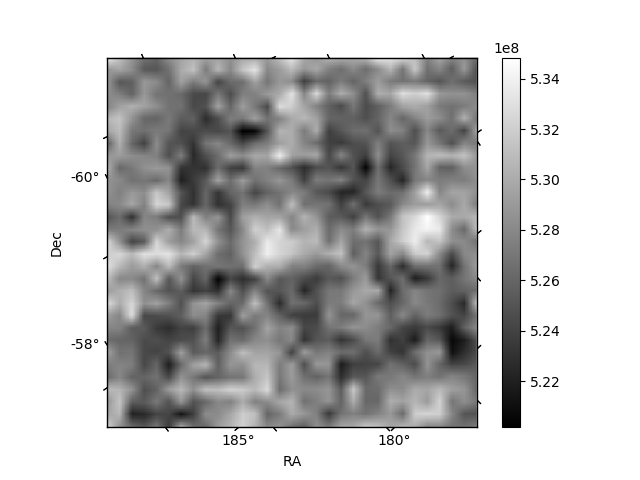
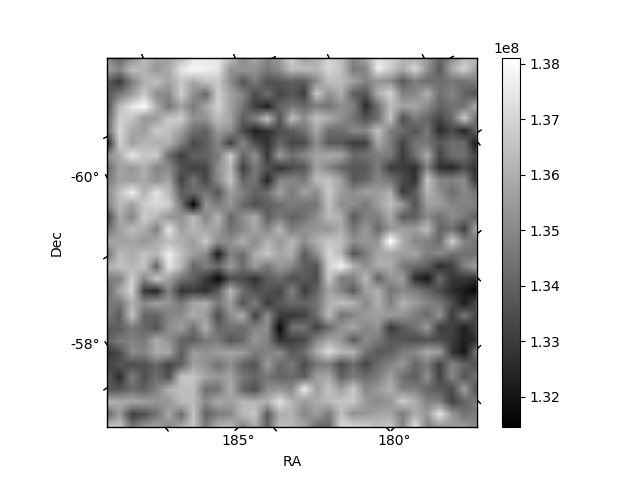
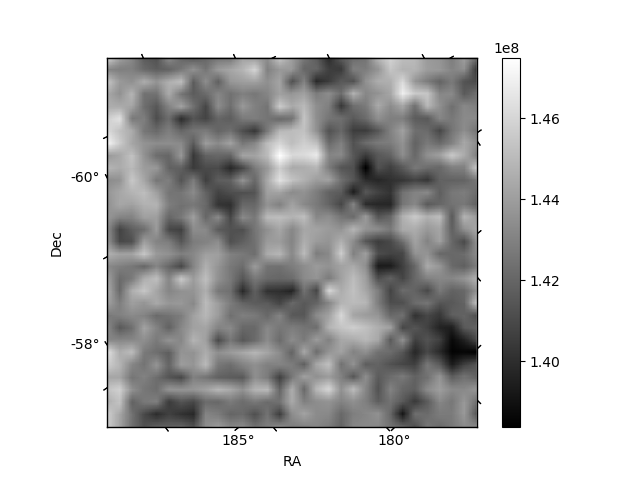
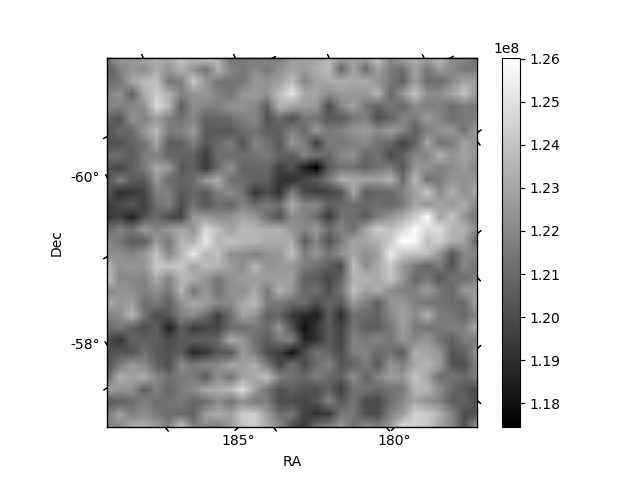
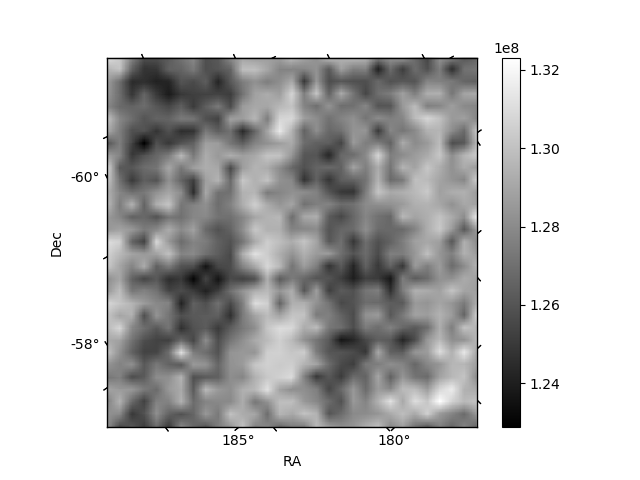
Histogram calculated using DETX and DETY for each event in the final _common_clean file
| Quadrant A | 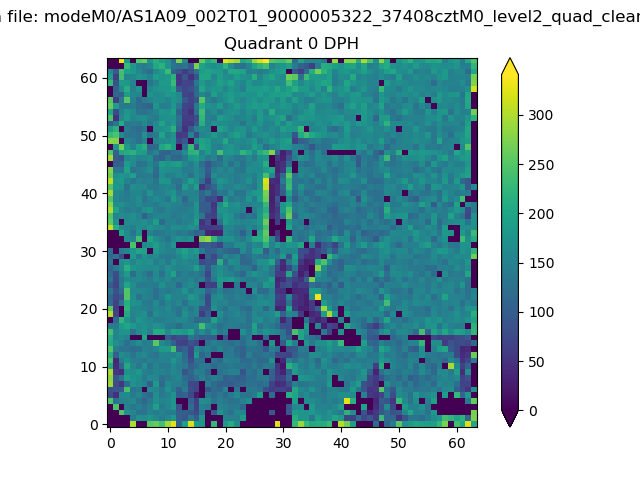 |
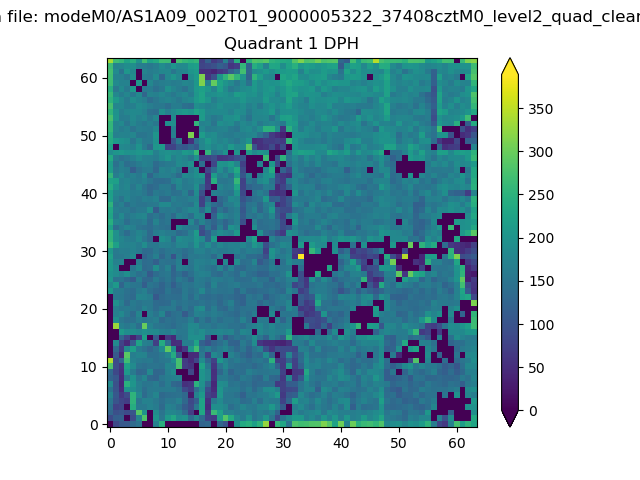 |
Quadrant B |
|---|---|---|---|
| Quadrant D | 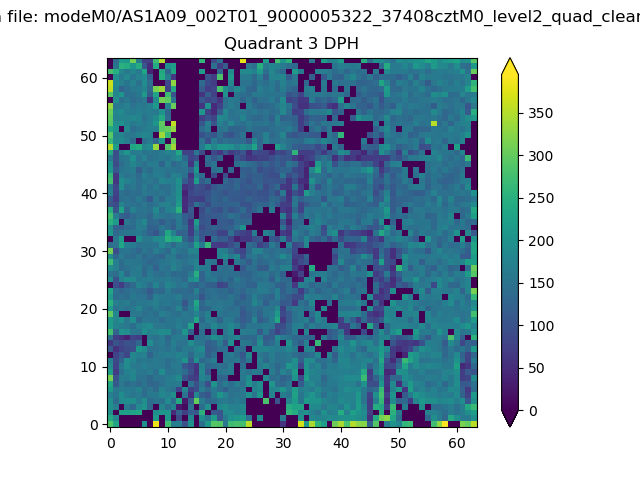 |
 |
Quadrant C |
| Plot type | Count rate plots | Images |
|---|---|---|
| Comparison with Poisson distribution Blue bars denote a histogram of data divided into 1 sec bins. Red curve is a Poisson curve with rate = median count rate of data. |
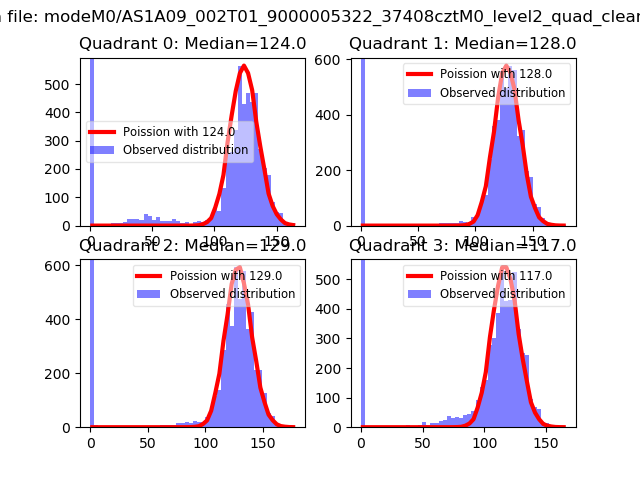 |
 |
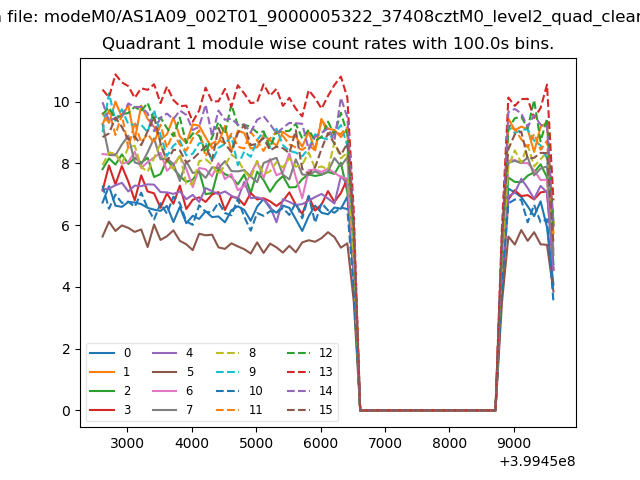
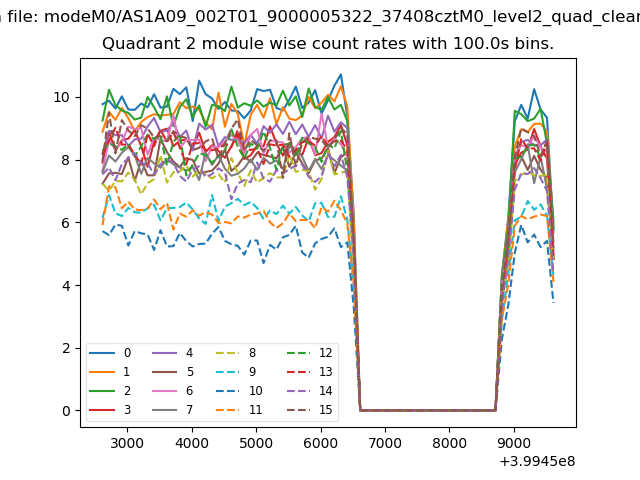
| Quadrant-wise count rates Data is divided into 100 sec bins |
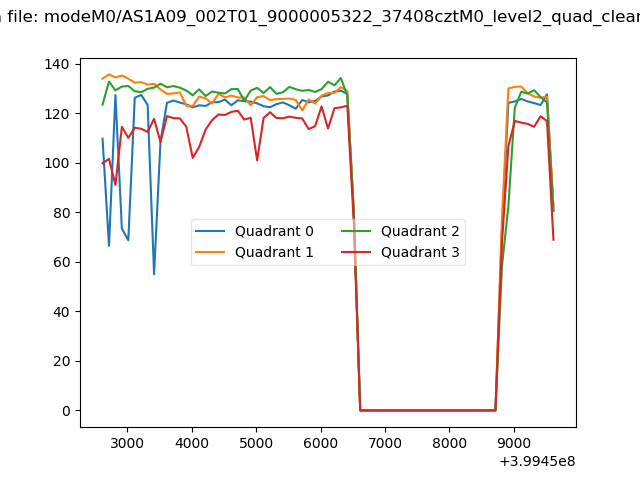 |
|
| Module-wise count rates for Quadrant A Data is divided into 100 sec bins |
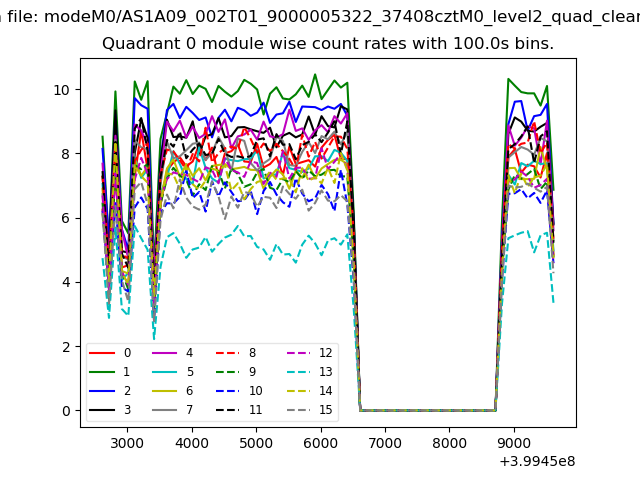 |
 |
| Module-wise count rates for Quadrant B Data is divided into 100 sec bins |
 |
 |
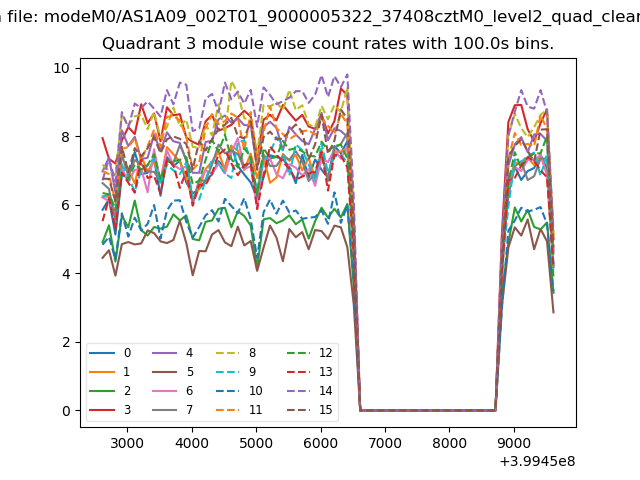
| Module-wise count rates for Quadrant C Data is divided into 100 sec bins |
 |
 |
| Module-wise count rates for Quadrant D Data is divided into 100 sec bins |
 |
 |
| Parameter | Plot |
|---|---|
| CZT HV Monitor | 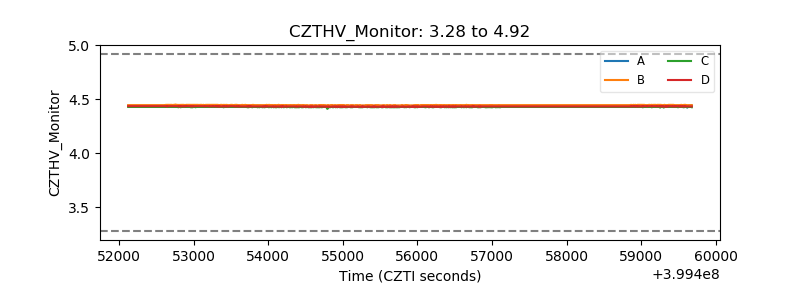 |
| D_VDD | 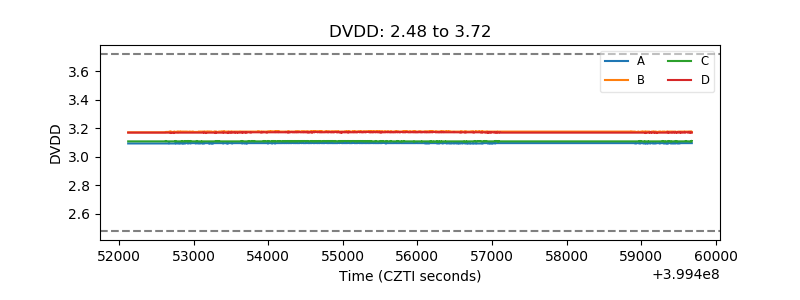 |
| Temperature 1 | 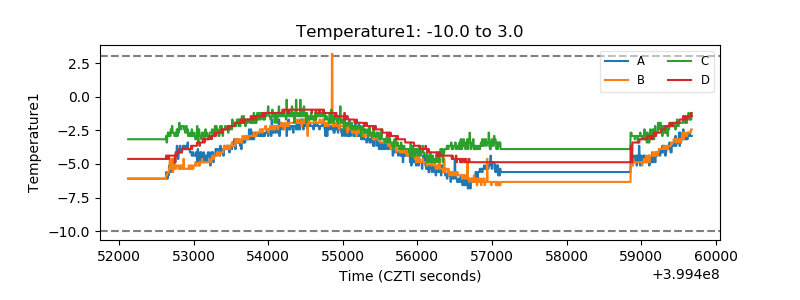 |
| Veto HV Monitor | 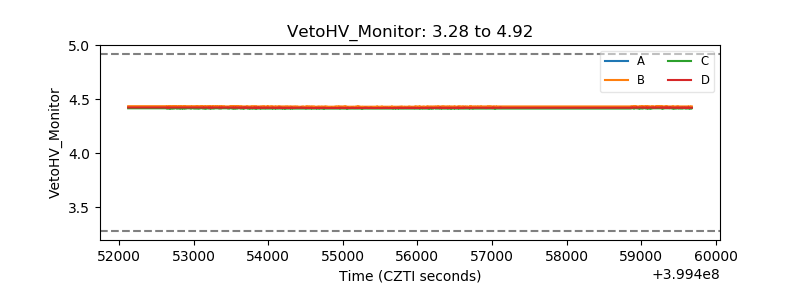 |
| Veto LLD | 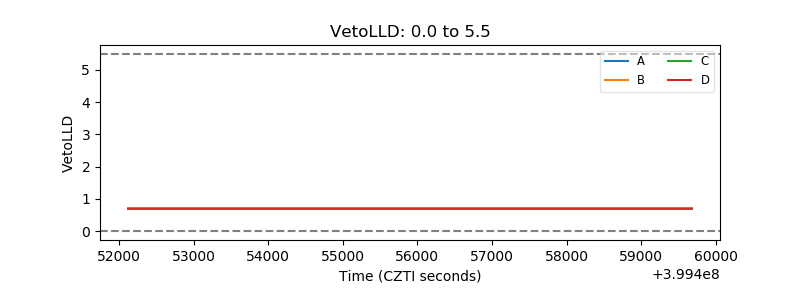 |
| Alpha Counter | 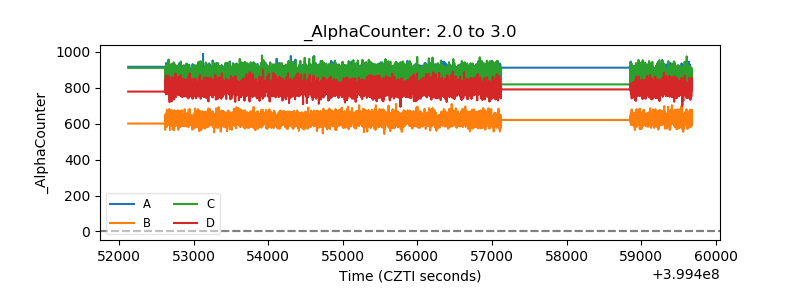 |
| _CPM_Rate | 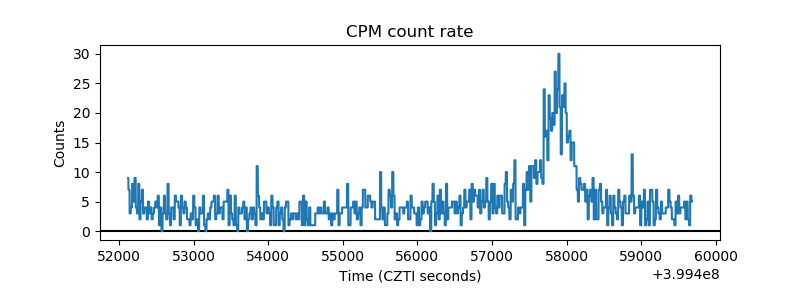 |
| CZT Counter | 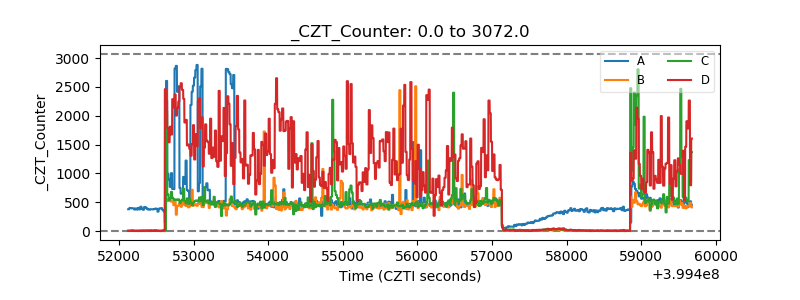 |
| +2.5 Volts monitor | 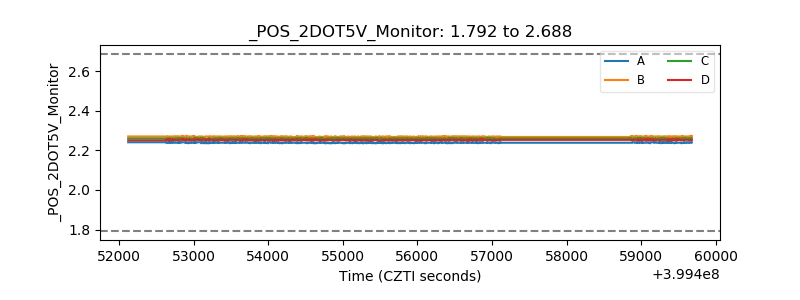 |
| +5 Volts monitor | 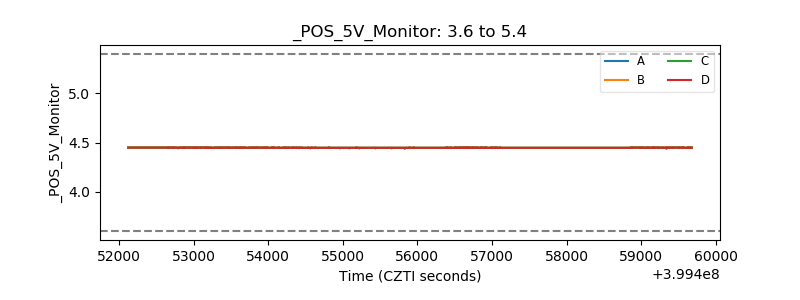 |
| _ROLL_ROT | 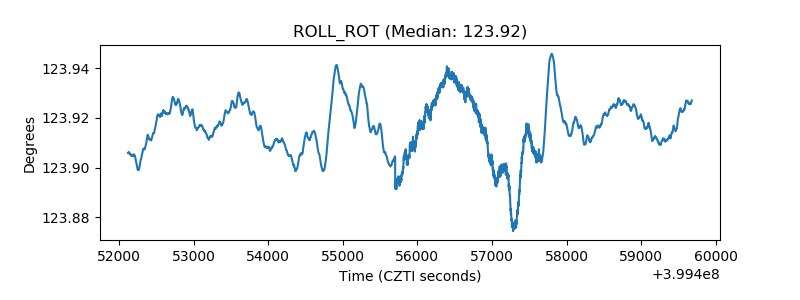 |
| _Roll_DEC | 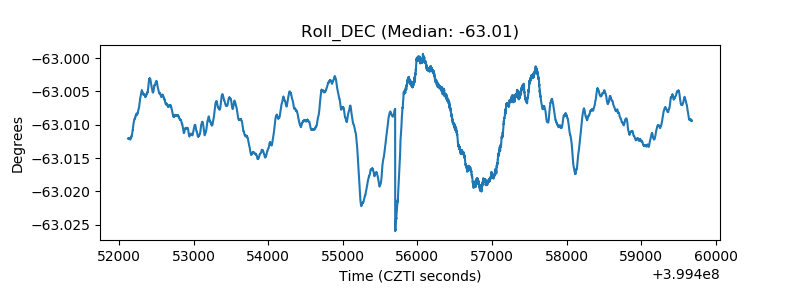 |
| _Roll_RA | 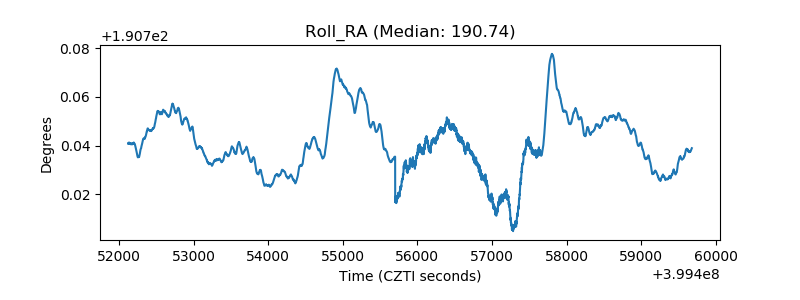 |
| Veto Counter | 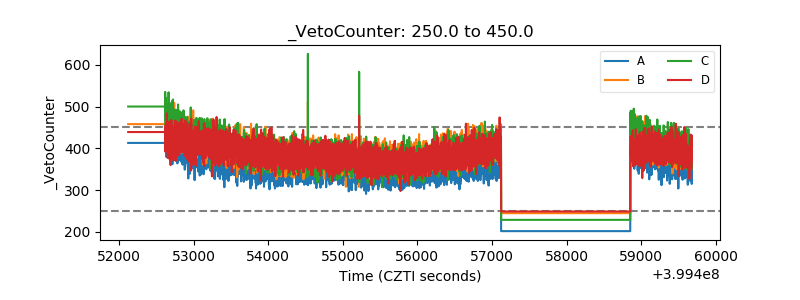 |