| Param | Original file | Final file |
|---|---|---|
| Filename | modeM0/AS1A09_002T01_9000005322_37409cztM0_level2.evt | modeM0/AS1A09_002T01_9000005322_37409cztM0_level2_quad_clean.evt |
| Size (bytes) | 600,612,480 | 85,705,920 |
| Size | 572.8 MB | 81.7 MB |
| Events in quadrant A | 2,898,678 | 560,110 |
| Events in quadrant B | 3,011,394 | 562,741 |
| Events in quadrant C | 3,692,969 | 564,880 |
| Events in quadrant D | 8,191,154 | 498,476 |
| Mode M0 | |||
|---|---|---|---|
| Quadrant | BADHDUFLAG | Total packets | Discarded packets |
| A | 0 | 12202 | 3 |
| B | 0 | 12837 | 2 |
| C | 0 | 14592 | 2 |
| D | 0 | 28461 | 2 |
| Mode M9 | |||
|---|---|---|---|
| Quadrant | BADHDUFLAG | Total packets | Discarded packets |
| A | 0 | 15 | 0 |
| B | 0 | 15 | 0 |
| C | 0 | 15 | 0 |
| D | 0 | 16 | 0 |
| Mode SS | |||
|---|---|---|---|
| Quadrant | BADHDUFLAG | Total packets | Discarded packets |
| A | 0 | 118 | 0 |
| B | 0 | 118 | 0 |
| C | 0 | 118 | 0 |
| D | 0 | 118 | 0 |
| Quadrant | Total seconds | Saturated seconds | Saturation percentage |
|---|---|---|---|
| A | 5853 | 8 | 0.136682% |
| B | 5853 | 86 | 1.469332% |
| C | 5853 | 239 | 4.083376% |
| D | 5853 | 879 | 15.017940% |
Noise dominated data is calculated using 1-second bins in cleaned event files. If a bin has >2000 counts, and if more than 50% of those come from <1% of pixels, then it is considered to be noise-dominated and hence unusable.
| Quadrant | # 1 sec bins | Bins with >0 counts | Bins with >2000 counts | High rate bins dominated by noise | Noise dominated (total time) | Noise dominated (detector-on time) | Marked lightcurve |
|---|---|---|---|---|---|---|---|
| A | 7287 | 5854 | 6 | 6 | 0.08% | 0.10% | 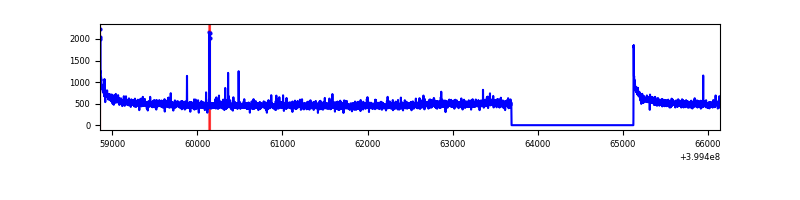 |
| B | 7287 | 5854 | 63 | 63 | 0.86% | 1.08% | 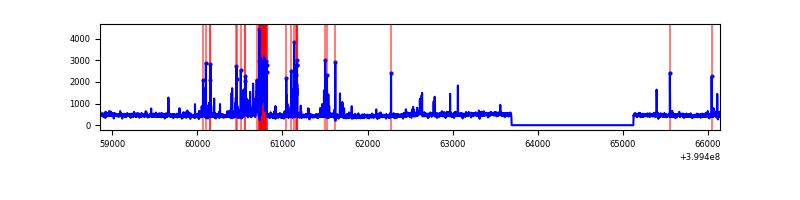 |
| C | 7287 | 5854 | 195 | 195 | 2.68% | 3.33% | 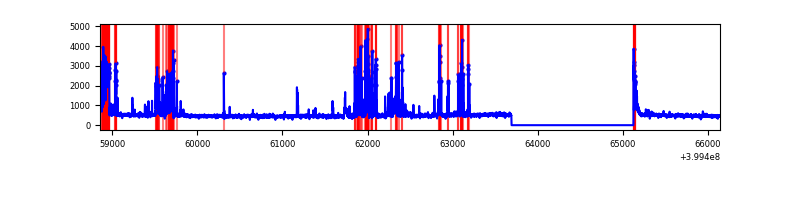 |
| D | 7287 | 5854 | 1043 | 1043 | 14.31% | 17.82% | 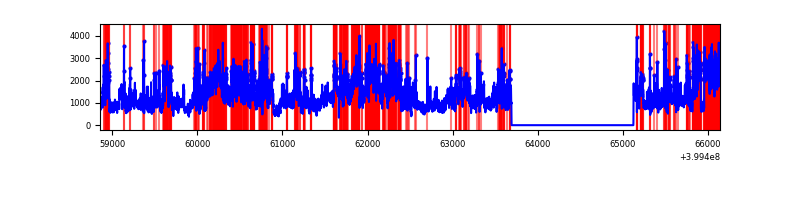 |
Top three noisy pixels from each quadrant. If the there are fewer than three noisy pixels in the level2.evt file, extra rows are filled as -1
| Pixel properties | Quadrant properties | ||||||
|---|---|---|---|---|---|---|---|
| Quadrant | DetID | PixID | Counts | Sigma | Mean | Median | Sigma |
| A | 10 | 83 | 303640 | 2288.13 | 655 | 642 | 132.4 |
| A | 13 | 6 | 20443 | 149.53 | 655 | 642 | 132.4 |
| A | 6 | 10 | 14745 | 106.5 | 655 | 642 | 132.4 |
| B | 5 | 172 | 236244 | 1891.87 | 646 | 628 | 124.5 |
| B | 5 | 255 | 140258 | 1121.16 | 646 | 628 | 124.5 |
| B | 4 | 232 | 29528 | 232.05 | 646 | 628 | 124.5 |
| C | 14 | 254 | 768829 | 5257.9 | 630 | 634 | 146.1 |
| C | 15 | 214 | 247035 | 1686.49 | 630 | 634 | 146.1 |
| C | 1 | 23 | 113593 | 773.15 | 630 | 634 | 146.1 |
| D | 12 | 227 | 5078777 | 33783.9 | 615 | 599 | 150.3 |
| D | 13 | 249 | 233951 | 1552.44 | 615 | 599 | 150.3 |
| D | 2 | 249 | 151276 | 1002.42 | 615 | 599 | 150.3 |
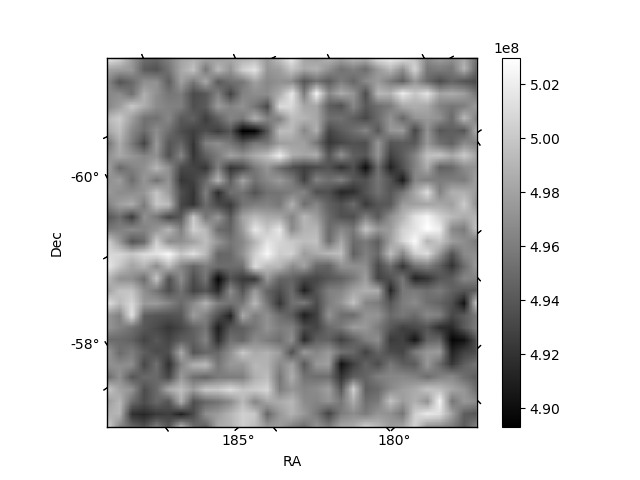
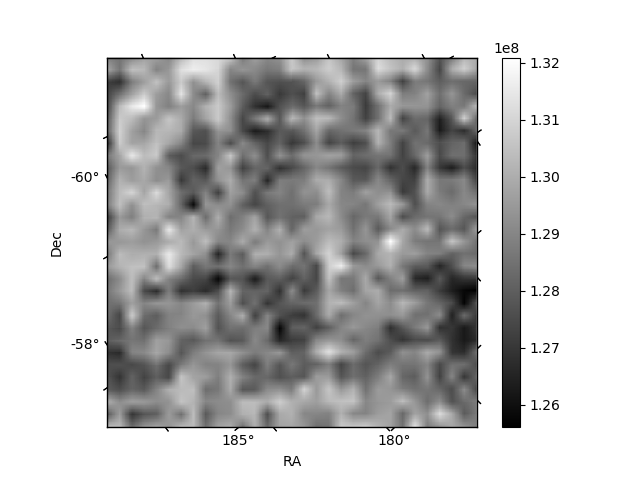
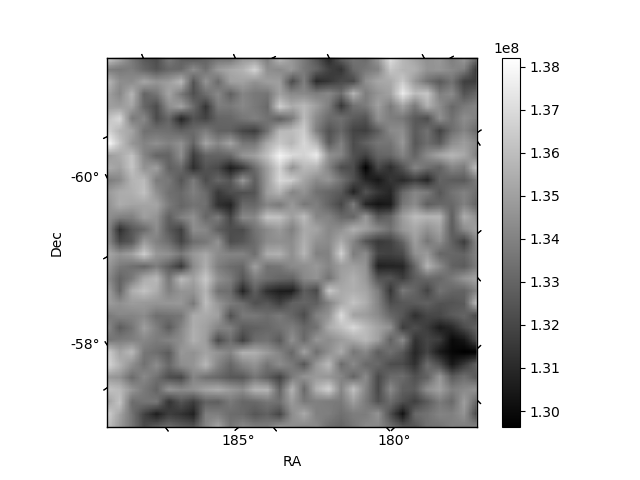
Histogram calculated using DETX and DETY for each event in the final _common_clean file
| Quadrant A | 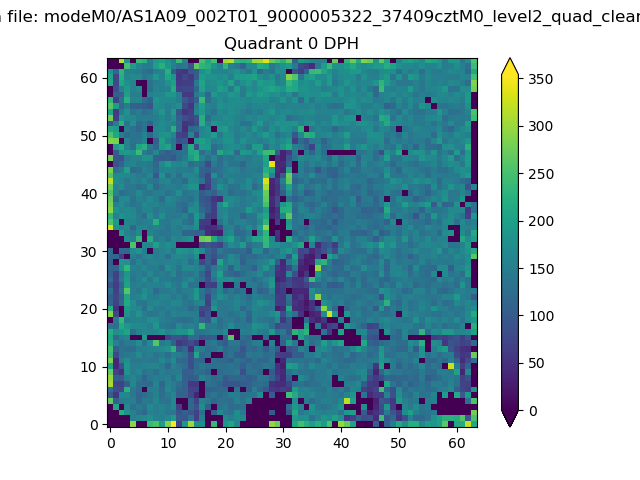 |
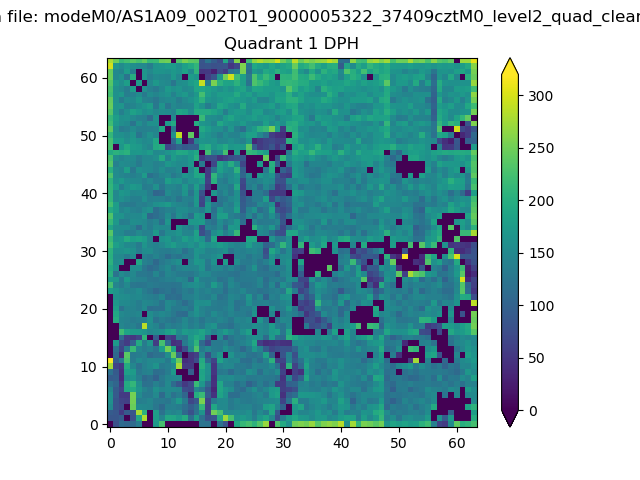 |
Quadrant B |
|---|---|---|---|
| Quadrant D | 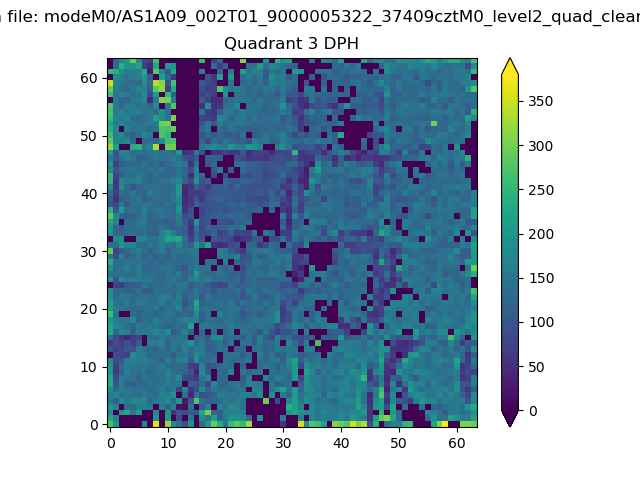 |
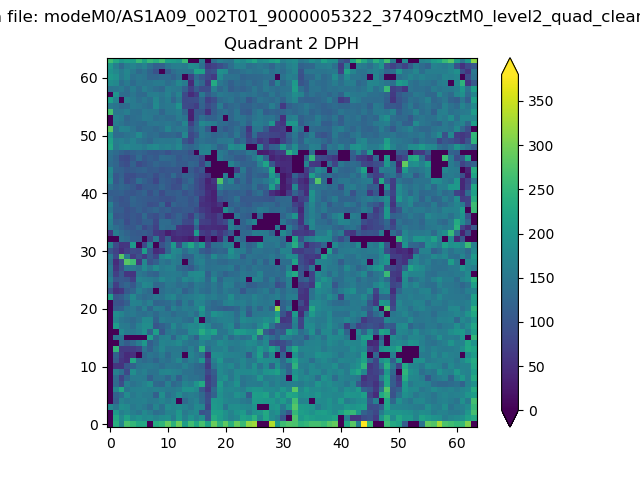 |
Quadrant C |
| Plot type | Count rate plots | Images |
|---|---|---|
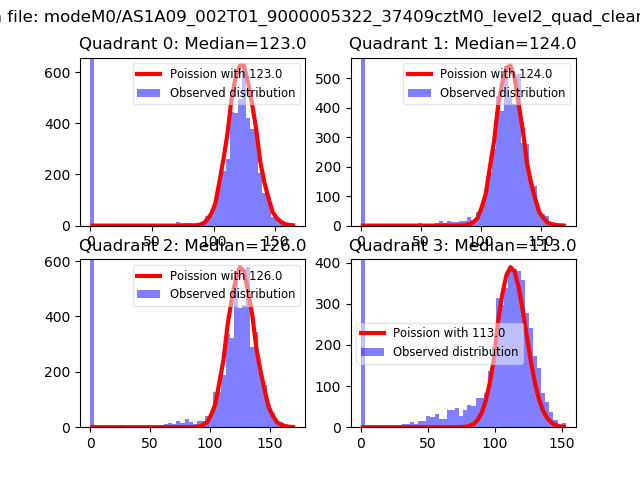
| Comparison with Poisson distribution Blue bars denote a histogram of data divided into 1 sec bins. Red curve is a Poisson curve with rate = median count rate of data. |
 |
 |
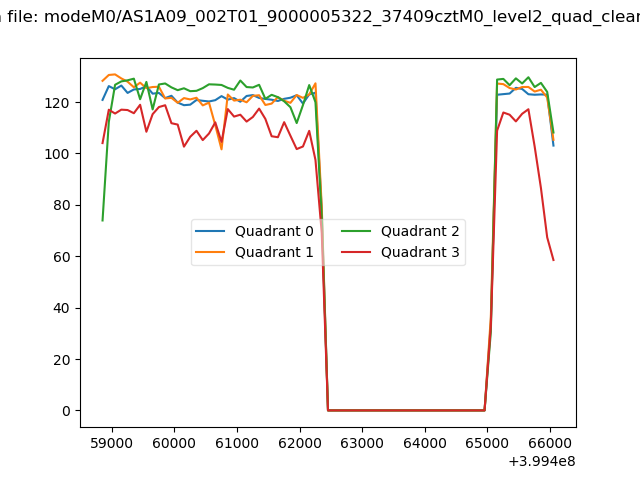
| Quadrant-wise count rates Data is divided into 100 sec bins |
 |
|
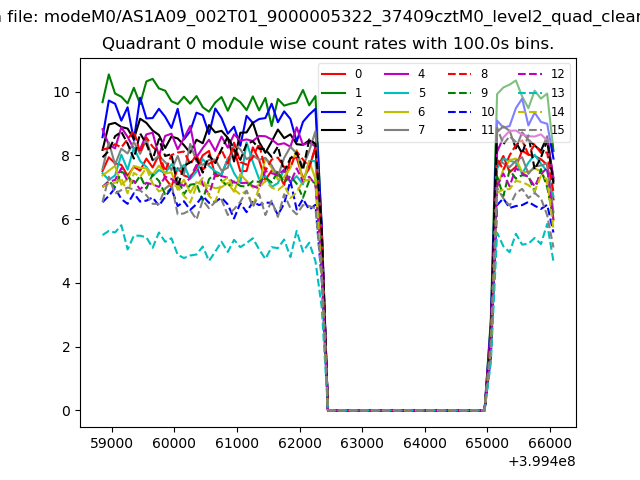
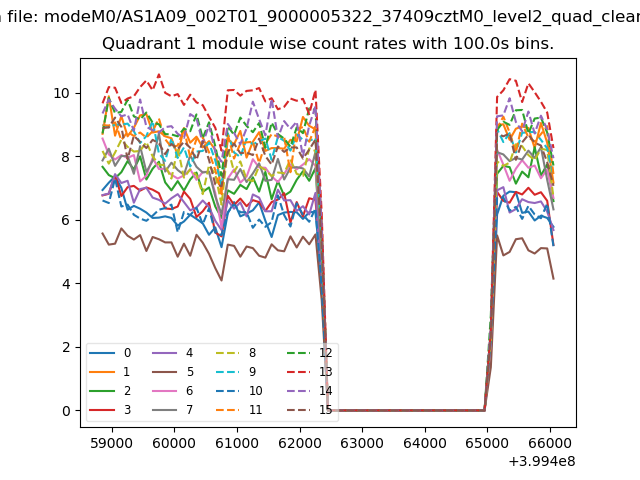
| Module-wise count rates for Quadrant A Data is divided into 100 sec bins |
 |
 |
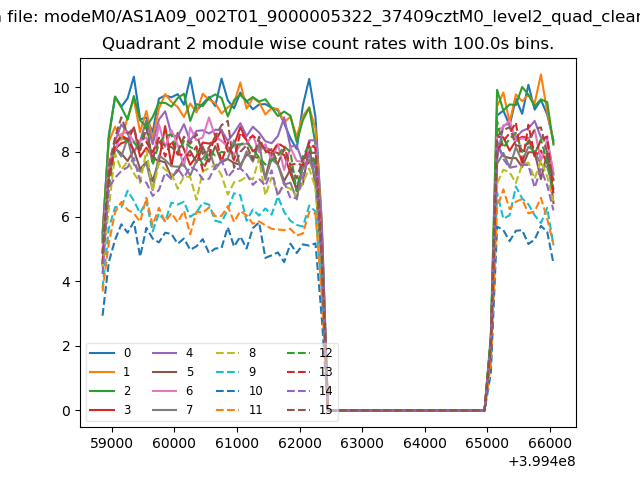
| Module-wise count rates for Quadrant B Data is divided into 100 sec bins |
 |
 |
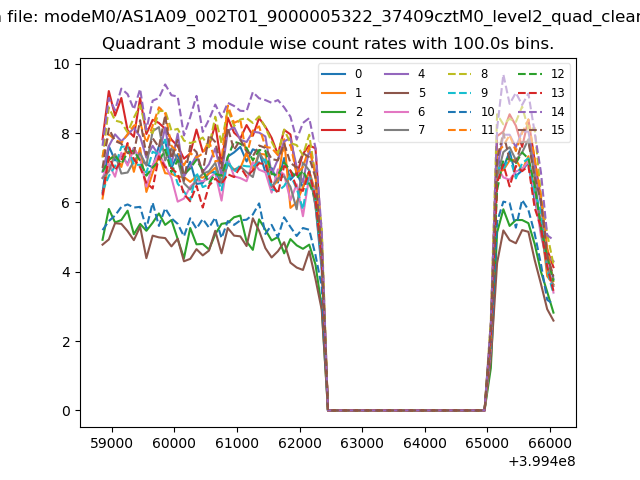
| Module-wise count rates for Quadrant C Data is divided into 100 sec bins |
 |
 |
| Module-wise count rates for Quadrant D Data is divided into 100 sec bins |
 |
 |
| Parameter | Plot |
|---|---|
| CZT HV Monitor | 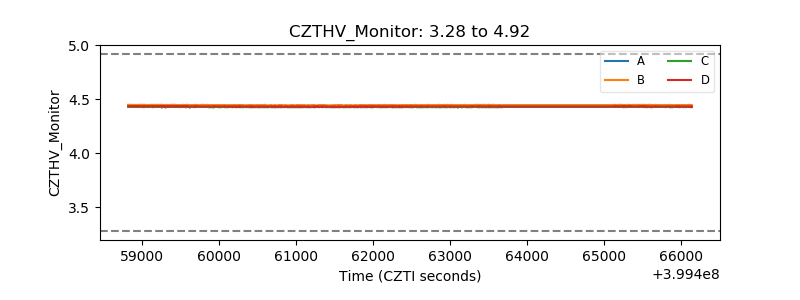 |
| D_VDD | 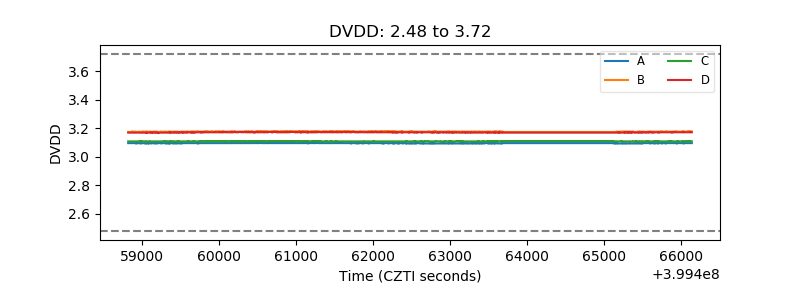 |
| Temperature 1 | 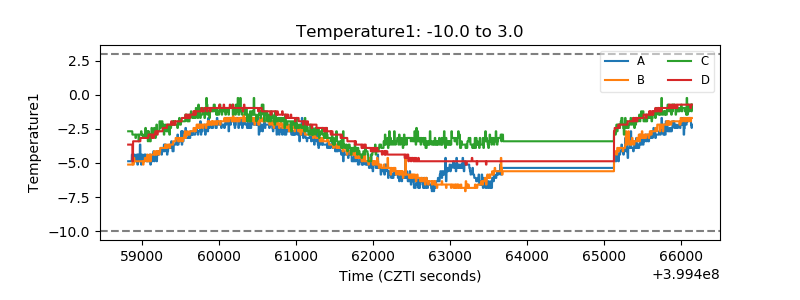 |
| Veto HV Monitor | 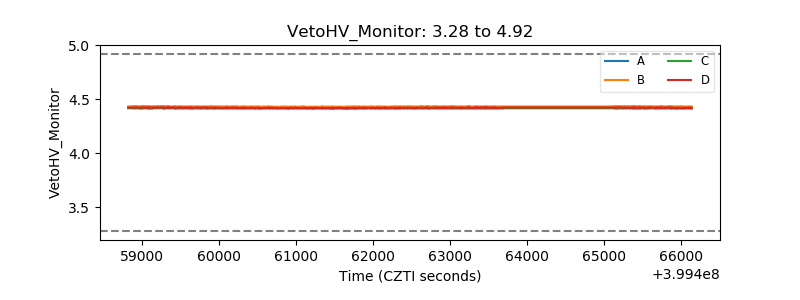 |
| Veto LLD | 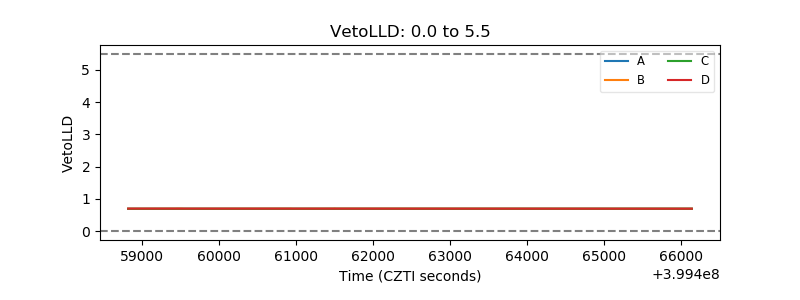 |
| Alpha Counter | 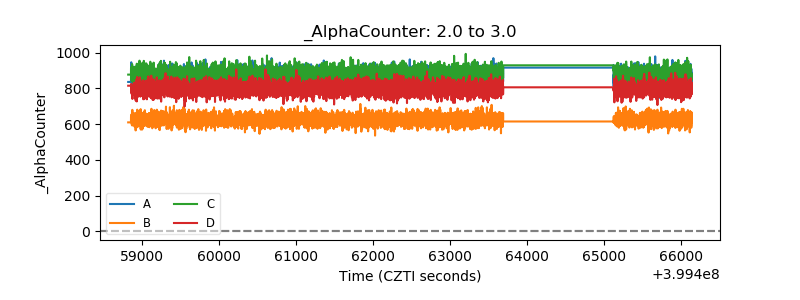 |
| _CPM_Rate | 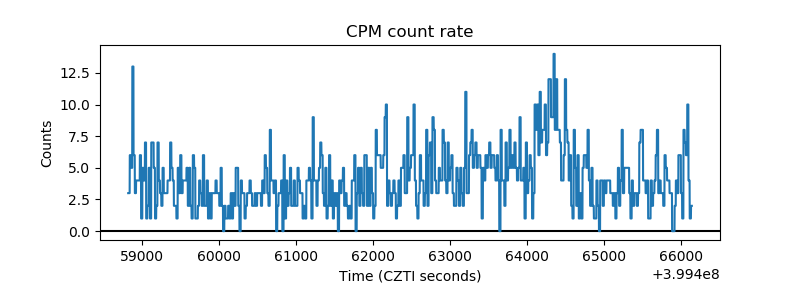 |
| CZT Counter | 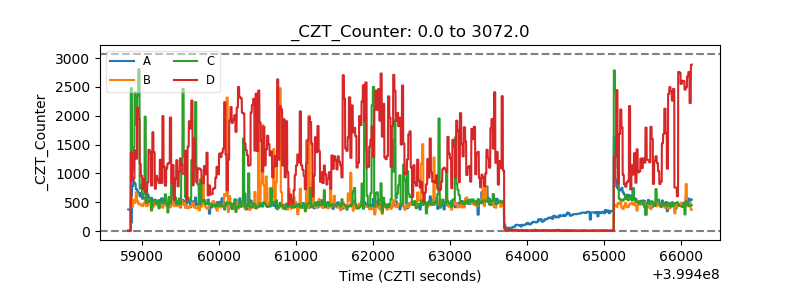 |
| +2.5 Volts monitor | 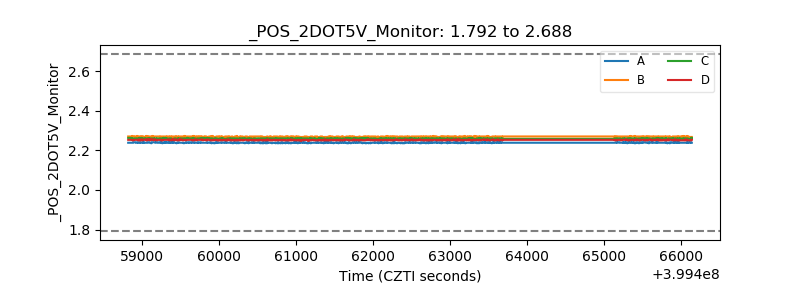 |
| +5 Volts monitor | 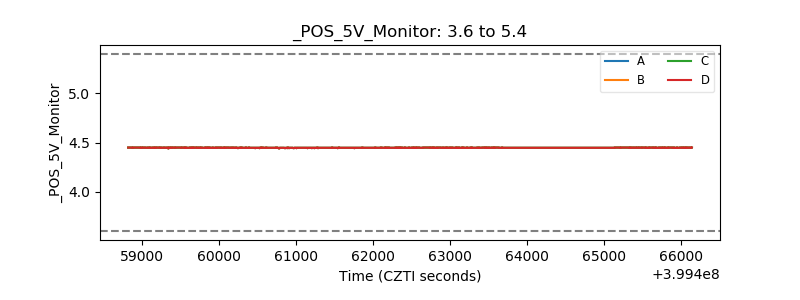 |
| _ROLL_ROT | 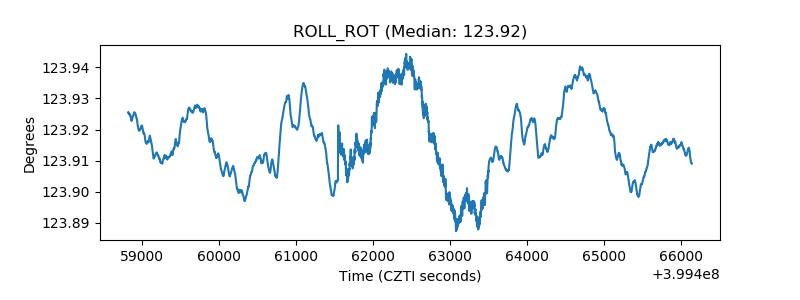 |
| _Roll_DEC | 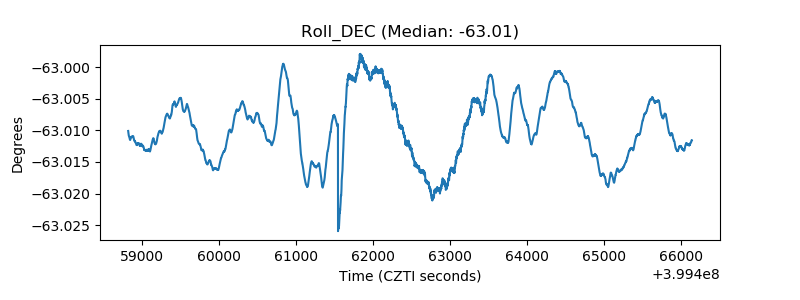 |
| _Roll_RA | 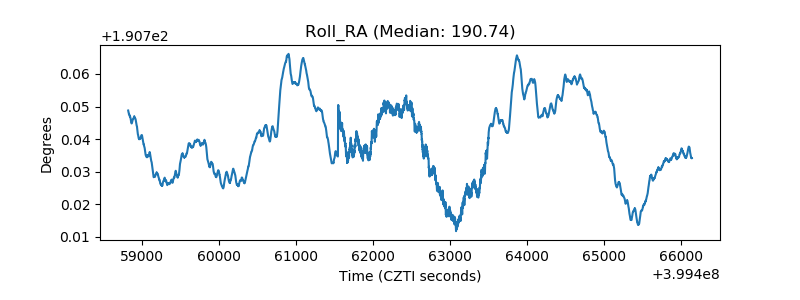 |
| Veto Counter | 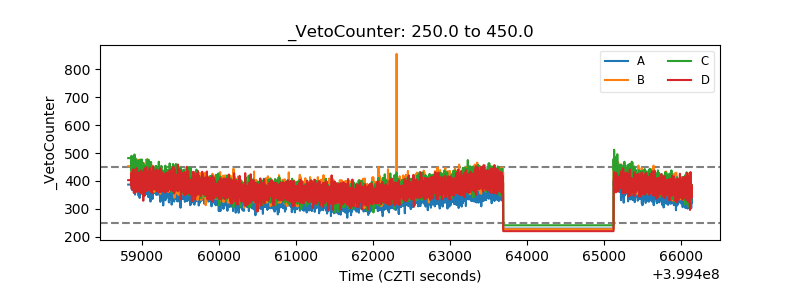 |