| Param | Original file | Final file |
|---|---|---|
| Filename | modeM0/AS1A09_002T01_9000005322_37410cztM0_level2.evt | modeM0/AS1A09_002T01_9000005322_37410cztM0_level2_quad_clean.evt |
| Size (bytes) | 533,476,800 | 82,811,520 |
| Size | 508.8 MB | 79.0 MB |
| Events in quadrant A | 2,857,373 | 538,158 |
| Events in quadrant B | 2,891,438 | 538,639 |
| Events in quadrant C | 2,805,594 | 551,246 |
| Events in quadrant D | 7,210,160 | 475,190 |
| Mode M0 | |||
|---|---|---|---|
| Quadrant | BADHDUFLAG | Total packets | Discarded packets |
| A | 0 | 12033 | 4 |
| B | 0 | 12473 | 2 |
| C | 0 | 11896 | 1 |
| D | 0 | 25513 | 12 |
| Mode M9 | |||
|---|---|---|---|
| Quadrant | BADHDUFLAG | Total packets | Discarded packets |
| A | 0 | 13 | 0 |
| B | 0 | 13 | 0 |
| C | 0 | 13 | 0 |
| D | 0 | 13 | 0 |
| Mode SS | |||
|---|---|---|---|
| Quadrant | BADHDUFLAG | Total packets | Discarded packets |
| A | 0 | 118 | 0 |
| B | 0 | 118 | 0 |
| C | 0 | 118 | 0 |
| D | 0 | 118 | 0 |
| Quadrant | Total seconds | Saturated seconds | Saturation percentage |
|---|---|---|---|
| A | 5782 | 9 | 0.155655% |
| B | 5782 | 63 | 1.089588% |
| C | 5783 | 21 | 0.363133% |
| D | 5779 | 891 | 15.417892% |
Noise dominated data is calculated using 1-second bins in cleaned event files. If a bin has >2000 counts, and if more than 50% of those come from <1% of pixels, then it is considered to be noise-dominated and hence unusable.
| Quadrant | # 1 sec bins | Bins with >0 counts | Bins with >2000 counts | High rate bins dominated by noise | Noise dominated (total time) | Noise dominated (detector-on time) | Marked lightcurve |
|---|---|---|---|---|---|---|---|
| A | 7095 | 5784 | 2 | 2 | 0.03% | 0.03% | 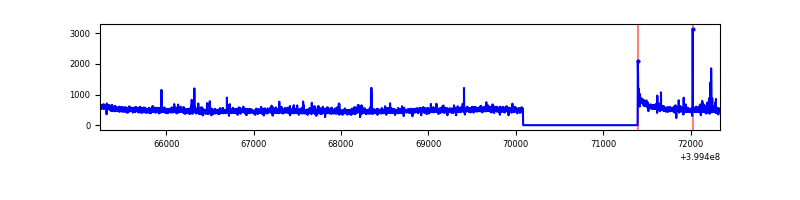 |
| B | 7095 | 5784 | 35 | 35 | 0.49% | 0.61% | 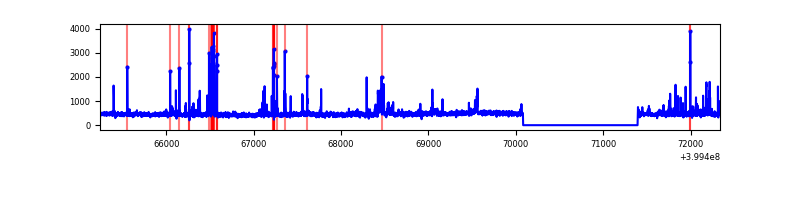 |
| C | 7095 | 5784 | 11 | 11 | 0.16% | 0.19% | 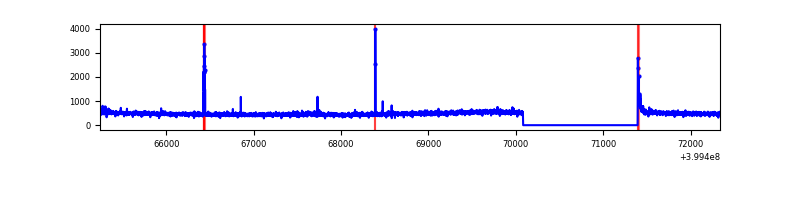 |
| D | 7095 | 5783 | 901 | 901 | 12.70% | 15.58% | 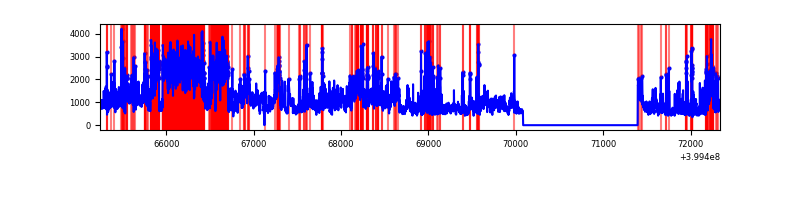 |
Top three noisy pixels from each quadrant. If the there are fewer than three noisy pixels in the level2.evt file, extra rows are filled as -1
| Pixel properties | Quadrant properties | ||||||
|---|---|---|---|---|---|---|---|
| Quadrant | DetID | PixID | Counts | Sigma | Mean | Median | Sigma |
| A | 10 | 83 | 262229 | 2016.84 | 644 | 632 | 129.7 |
| A | 9 | 143 | 26764 | 201.47 | 644 | 632 | 129.7 |
| A | 13 | 6 | 19683 | 146.88 | 644 | 632 | 129.7 |
| B | 5 | 172 | 138166 | 1119.38 | 636 | 618 | 122.9 |
| B | 5 | 255 | 98674 | 797.99 | 636 | 618 | 122.9 |
| B | 4 | 232 | 70925 | 572.16 | 636 | 618 | 122.9 |
| C | 15 | 214 | 245636 | 1681.23 | 629 | 633 | 145.7 |
| C | 14 | 254 | 32473 | 218.49 | 629 | 633 | 145.7 |
| C | 0 | 10 | 30393 | 204.22 | 629 | 633 | 145.7 |
| D | 12 | 227 | 4050496 | 27290.06 | 598 | 581 | 148.4 |
| D | 13 | 249 | 232384 | 1561.99 | 598 | 581 | 148.4 |
| D | 2 | 249 | 212304 | 1426.68 | 598 | 581 | 148.4 |
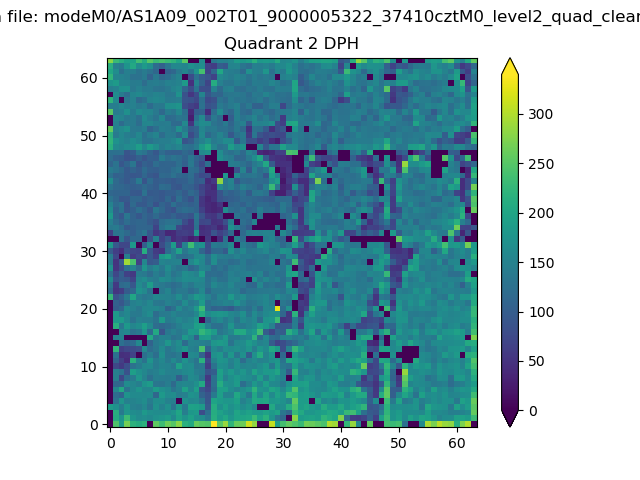
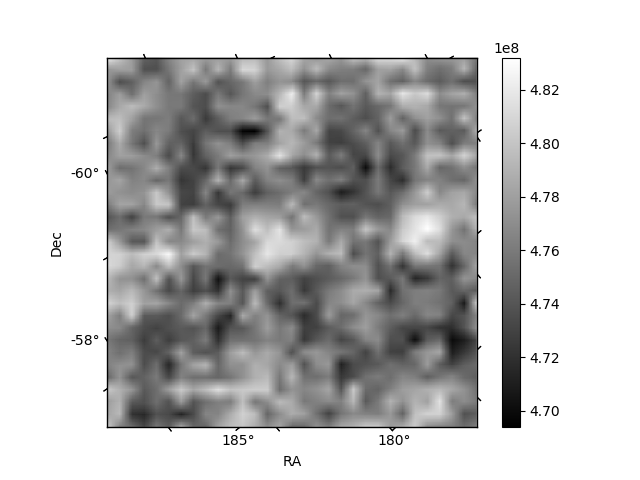
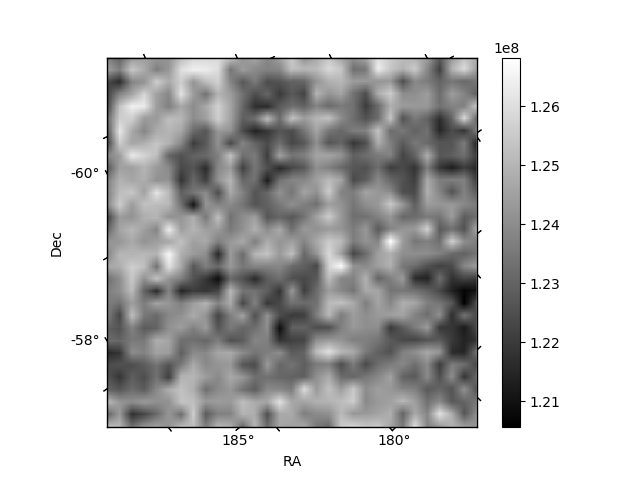
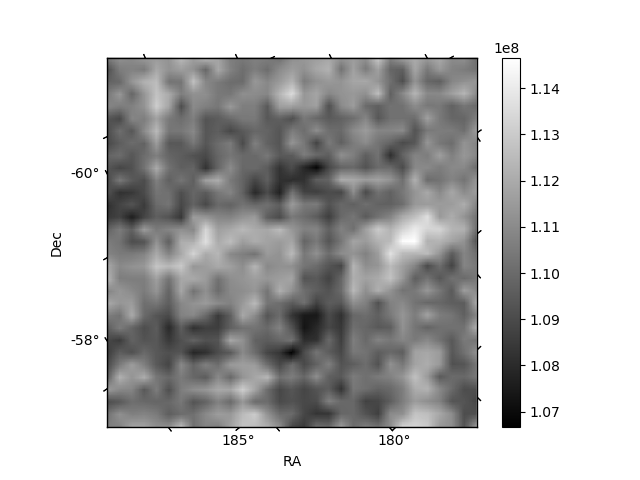
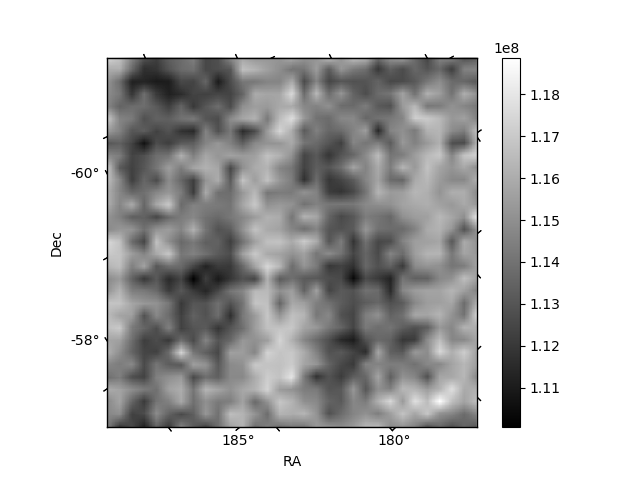
Histogram calculated using DETX and DETY for each event in the final _common_clean file
| Quadrant A | 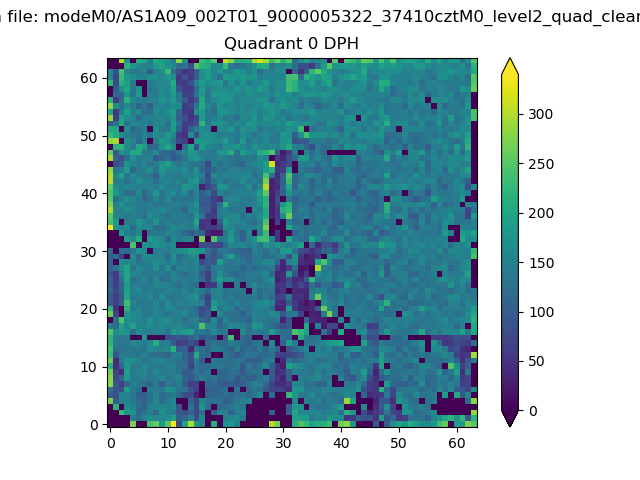 |
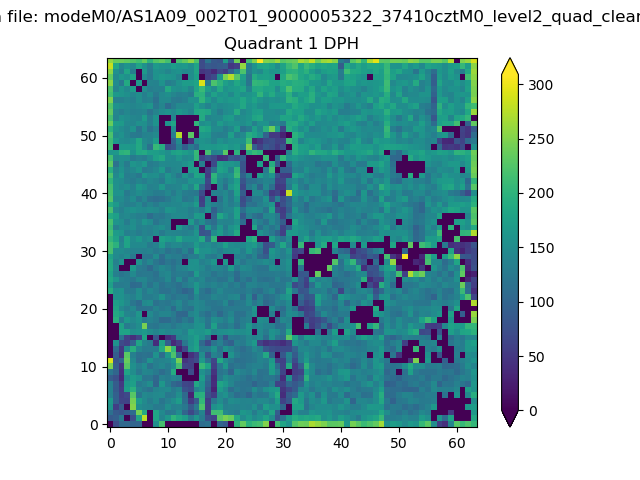 |
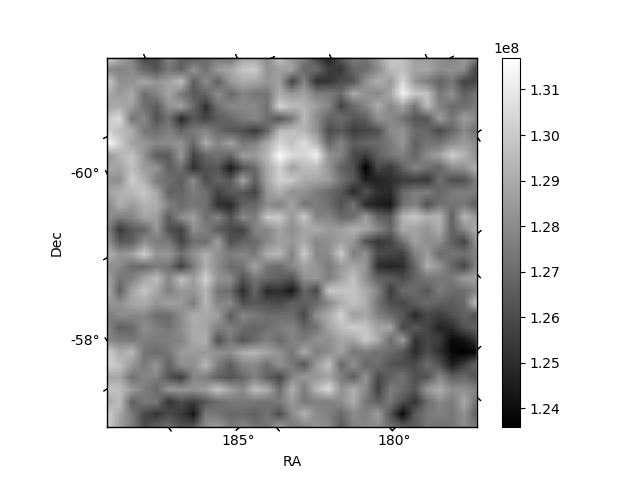
Quadrant B |
|---|---|---|---|
| Quadrant D | 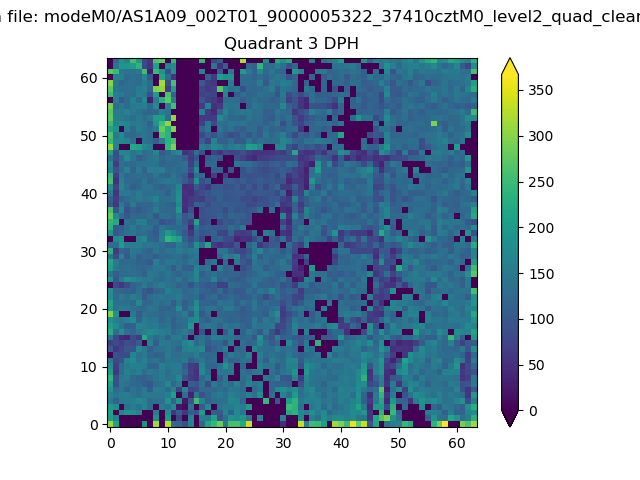 |
 |
Quadrant C |
| Plot type | Count rate plots | Images |
|---|---|---|
| Comparison with Poisson distribution Blue bars denote a histogram of data divided into 1 sec bins. Red curve is a Poisson curve with rate = median count rate of data. |
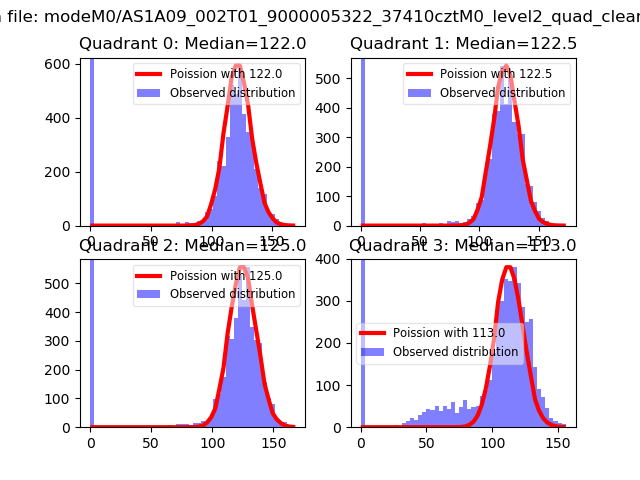 |
 |
| Quadrant-wise count rates Data is divided into 100 sec bins |
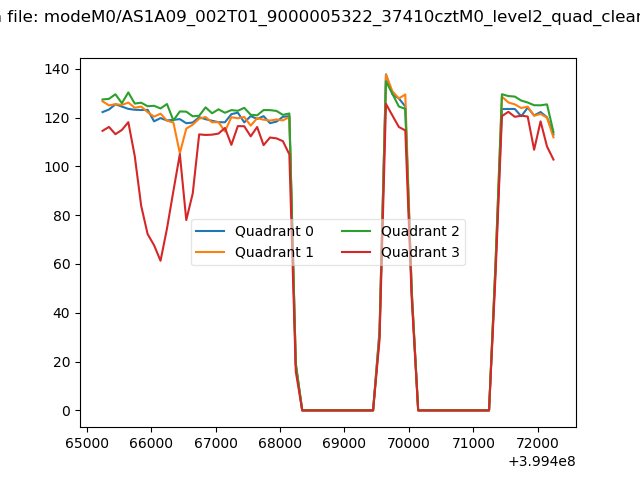 |
|
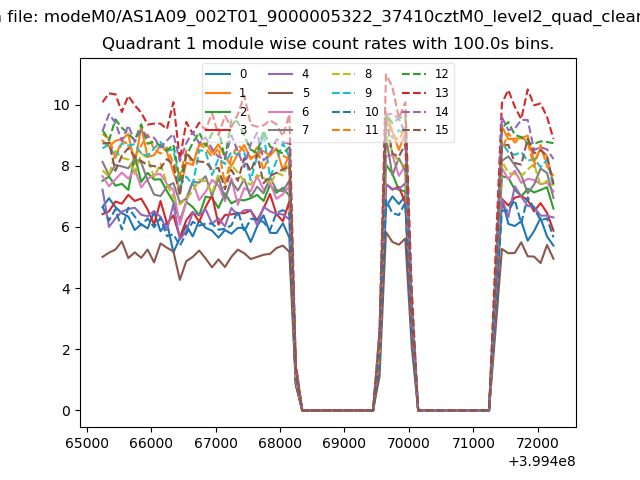
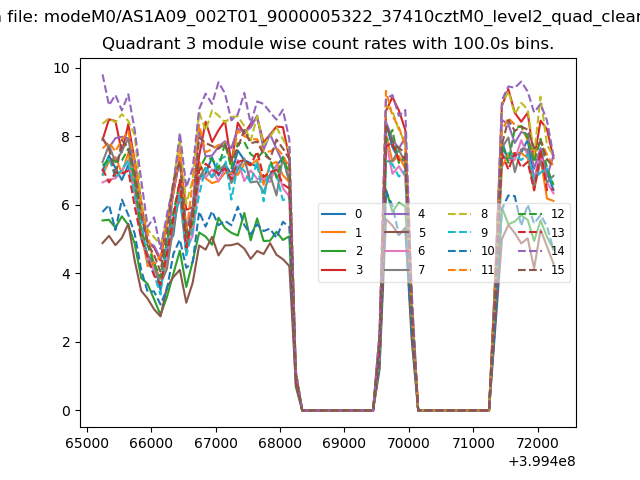
| Module-wise count rates for Quadrant A Data is divided into 100 sec bins |
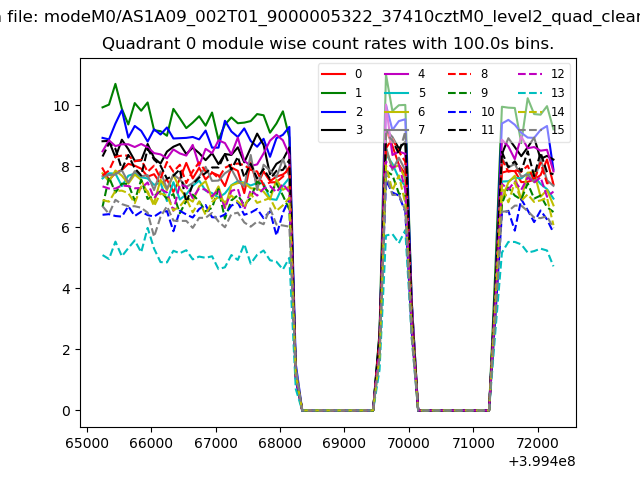 |
 |
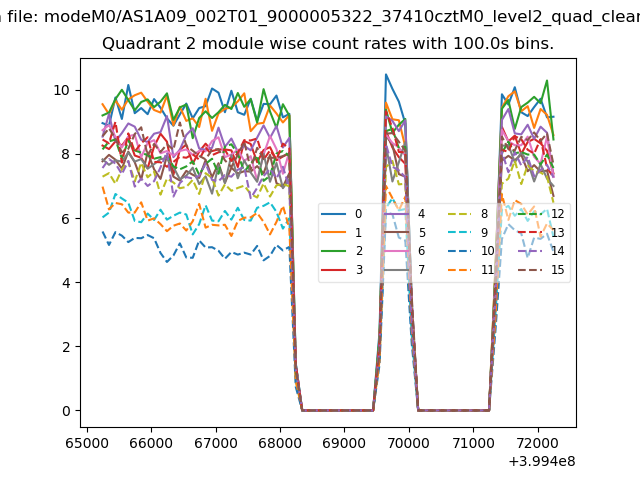
| Module-wise count rates for Quadrant B Data is divided into 100 sec bins |
 |
 |
| Module-wise count rates for Quadrant C Data is divided into 100 sec bins |
 |
 |
| Module-wise count rates for Quadrant D Data is divided into 100 sec bins |
 |
 |
| Parameter | Plot |
|---|---|
| CZT HV Monitor | 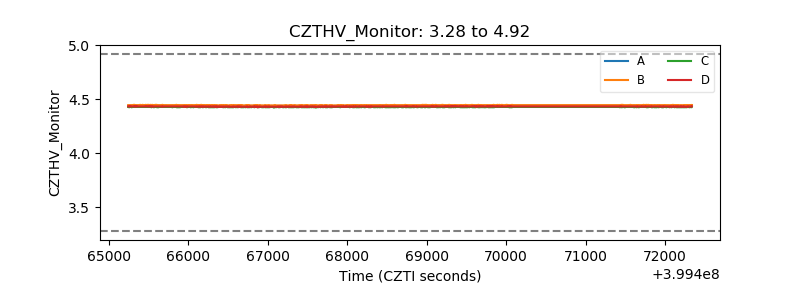 |
| D_VDD | 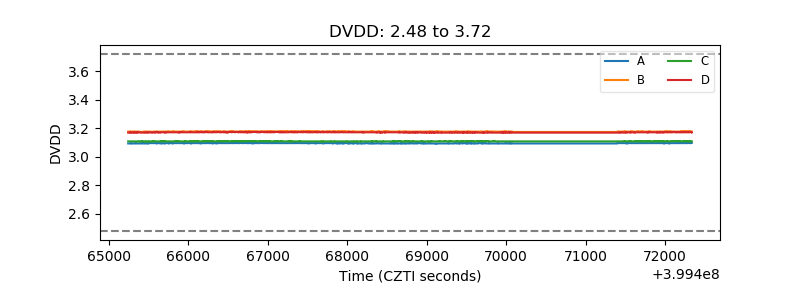 |
| Temperature 1 | 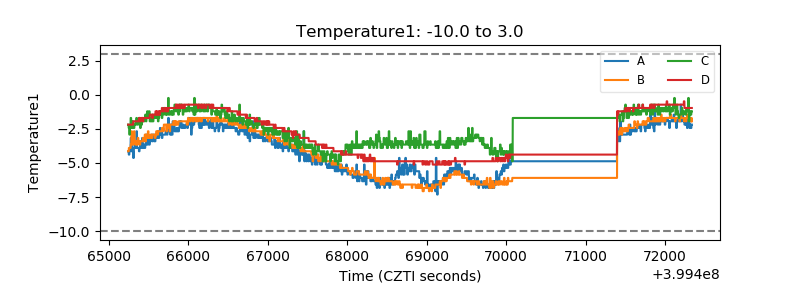 |
| Veto HV Monitor | 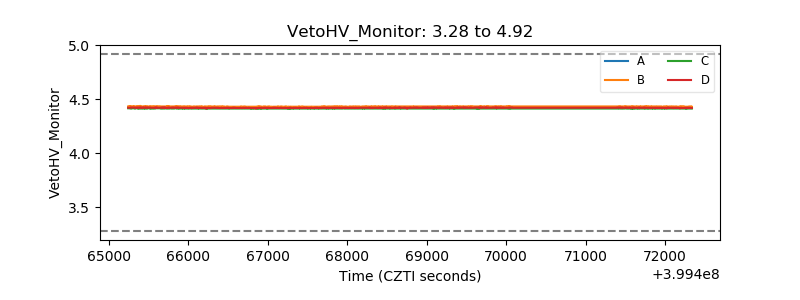 |
| Veto LLD | 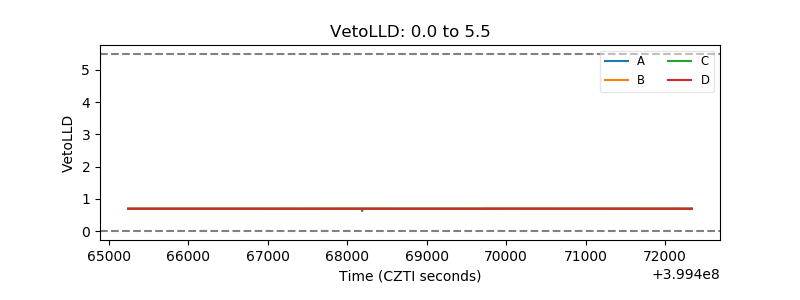 |
| Alpha Counter | 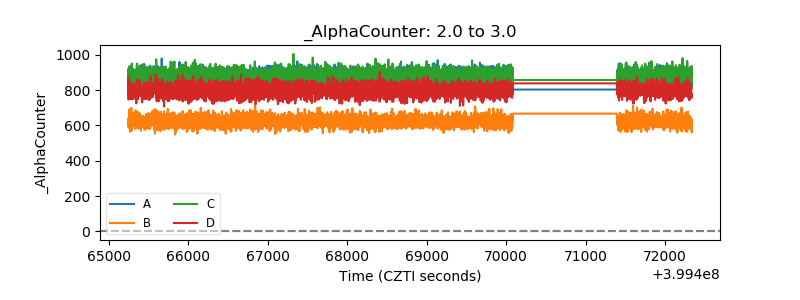 |
| _CPM_Rate | 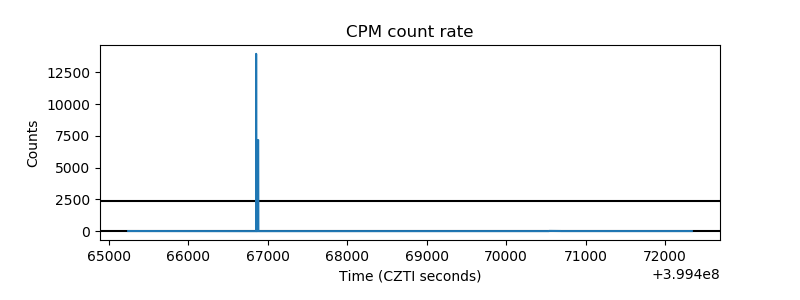 |
| CZT Counter | 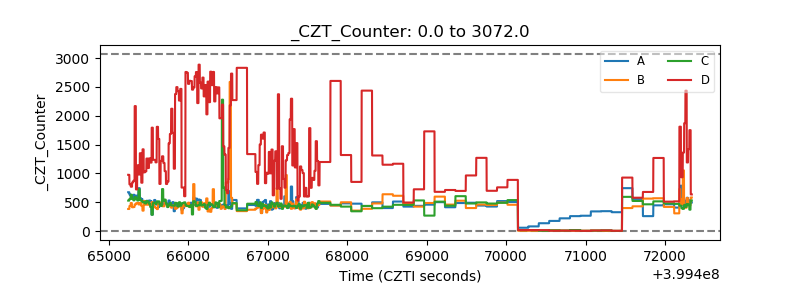 |
| +2.5 Volts monitor | 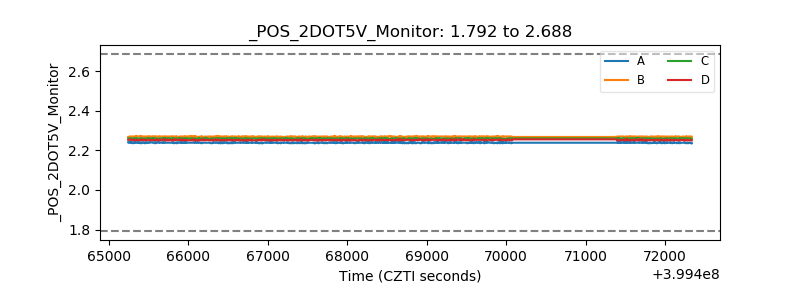 |
| +5 Volts monitor | 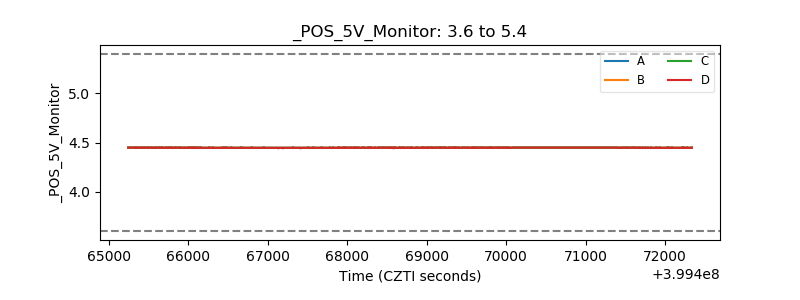 |
| _ROLL_ROT | 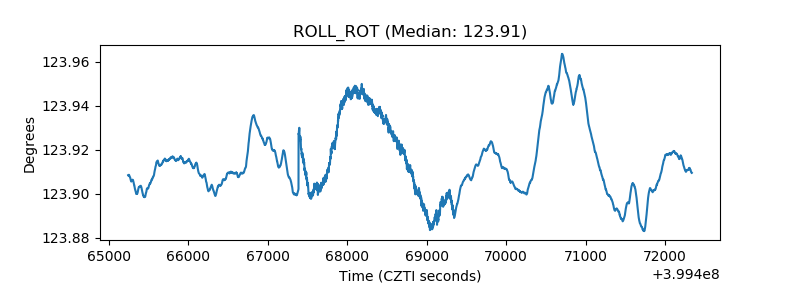 |
| _Roll_DEC | 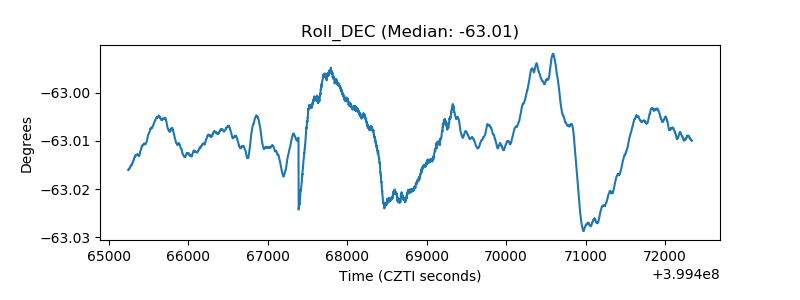 |
| _Roll_RA | 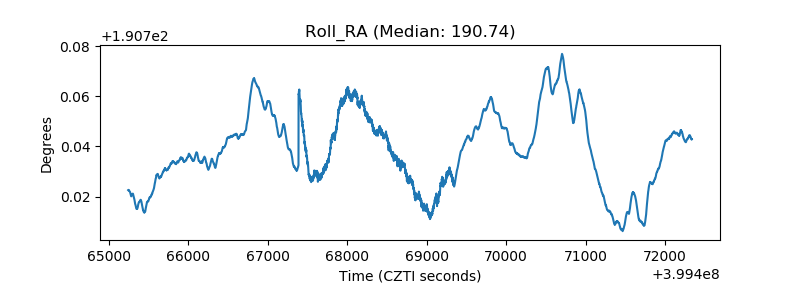 |
| Veto Counter | 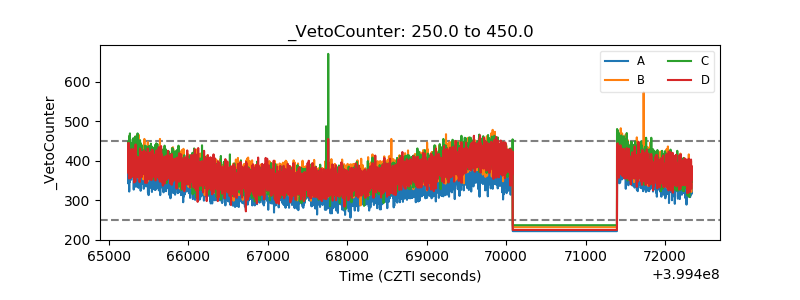 |