| Param | Original file | Final file |
|---|---|---|
| Filename | modeM0/AS1A09_002T01_9000005322_37414cztM0_level2.evt | modeM0/AS1A09_002T01_9000005322_37414cztM0_level2_quad_clean.evt |
| Size (bytes) | 475,741,440 | 77,901,120 |
| Size | 453.7 MB | 74.3 MB |
| Events in quadrant A | 3,124,438 | 498,723 |
| Events in quadrant B | 2,759,278 | 510,537 |
| Events in quadrant C | 2,867,214 | 506,807 |
| Events in quadrant D | 5,287,737 | 461,606 |
| Mode M0 | |||
|---|---|---|---|
| Quadrant | BADHDUFLAG | Total packets | Discarded packets |
| A | 0 | 12665 | 5 |
| B | 0 | 11895 | 2 |
| C | 0 | 11948 | 2 |
| D | 0 | 19409 | 7 |
| Mode M9 | |||
|---|---|---|---|
| Quadrant | BADHDUFLAG | Total packets | Discarded packets |
| A | 0 | 16 | 0 |
| B | 0 | 16 | 0 |
| C | 0 | 16 | 0 |
| D | 0 | 16 | 0 |
| Mode SS | |||
|---|---|---|---|
| Quadrant | BADHDUFLAG | Total packets | Discarded packets |
| A | 0 | 112 | 0 |
| B | 0 | 112 | 0 |
| C | 0 | 112 | 0 |
| D | 0 | 112 | 0 |
| Quadrant | Total seconds | Saturated seconds | Saturation percentage |
|---|---|---|---|
| A | 5440 | 40 | 0.735294% |
| B | 5441 | 85 | 1.562213% |
| C | 5441 | 63 | 1.157875% |
| D | 5439 | 466 | 8.567751% |
Noise dominated data is calculated using 1-second bins in cleaned event files. If a bin has >2000 counts, and if more than 50% of those come from <1% of pixels, then it is considered to be noise-dominated and hence unusable.
| Quadrant | # 1 sec bins | Bins with >0 counts | Bins with >2000 counts | High rate bins dominated by noise | Noise dominated (total time) | Noise dominated (detector-on time) | Marked lightcurve |
|---|---|---|---|---|---|---|---|
| A | 7054 | 5442 | 27 | 27 | 0.38% | 0.50% | 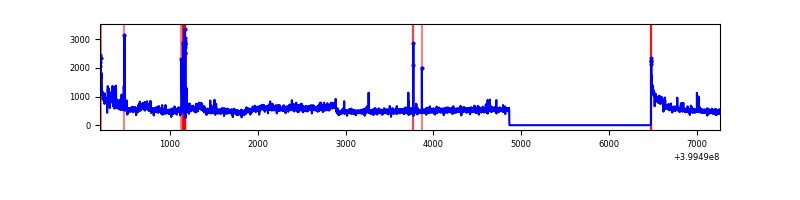 |
| B | 7054 | 5442 | 47 | 47 | 0.67% | 0.86% | 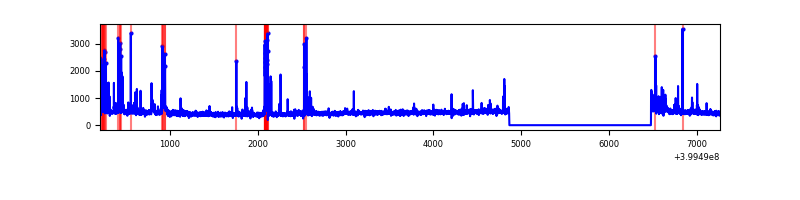 |
| C | 7054 | 5442 | 60 | 60 | 0.85% | 1.10% | 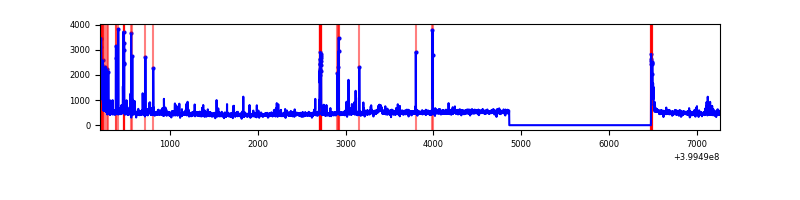 |
| D | 7055 | 5442 | 463 | 463 | 6.56% | 8.51% | 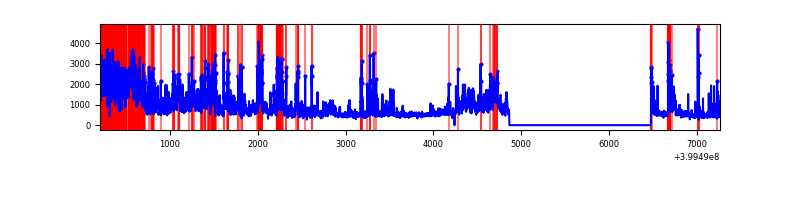 |
Top three noisy pixels from each quadrant. If the there are fewer than three noisy pixels in the level2.evt file, extra rows are filled as -1
| Pixel properties | Quadrant properties | ||||||
|---|---|---|---|---|---|---|---|
| Quadrant | DetID | PixID | Counts | Sigma | Mean | Median | Sigma |
| A | 15 | 222 | 433856 | 3565.15 | 601 | 588 | 121.5 |
| A | 10 | 83 | 300674 | 2469.26 | 601 | 588 | 121.5 |
| A | 9 | 143 | 20014 | 159.85 | 601 | 588 | 121.5 |
| B | 5 | 255 | 165399 | 1420.23 | 600 | 584 | 116.0 |
| B | 5 | 172 | 129298 | 1109.14 | 600 | 584 | 116.0 |
| B | 4 | 232 | 30299 | 256.06 | 600 | 584 | 116.0 |
| C | 15 | 214 | 230558 | 1685.75 | 584 | 589 | 136.4 |
| C | 14 | 254 | 183068 | 1337.63 | 584 | 589 | 136.4 |
| C | 0 | 10 | 99070 | 721.9 | 584 | 589 | 136.4 |
| D | 12 | 227 | 1215104 | 8684.44 | 570 | 553 | 139.9 |
| D | 12 | 235 | 856951 | 6123.53 | 570 | 553 | 139.9 |
| D | 2 | 152 | 234048 | 1669.57 | 570 | 553 | 139.9 |
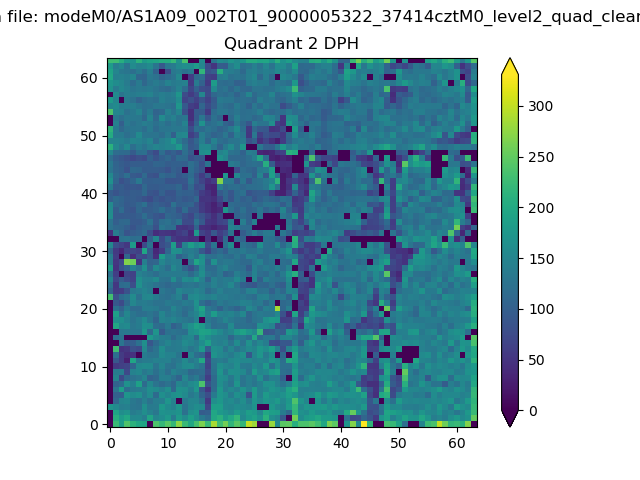
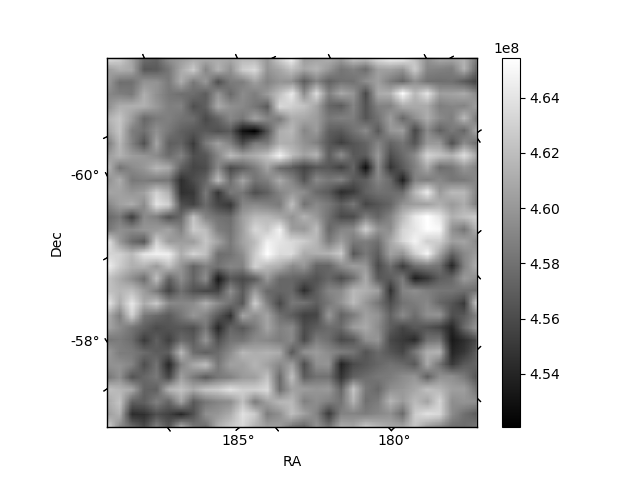
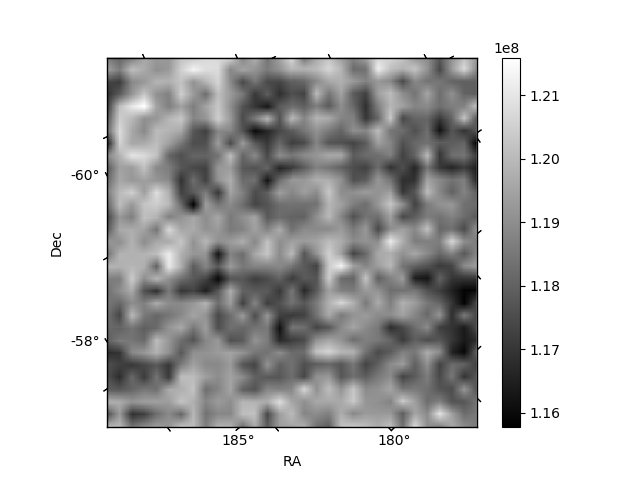
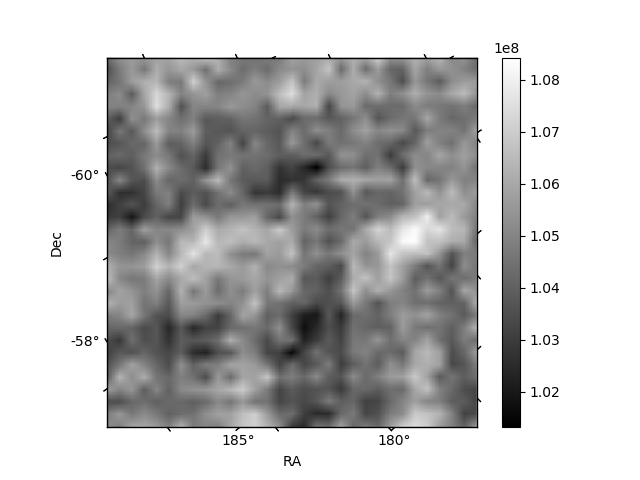
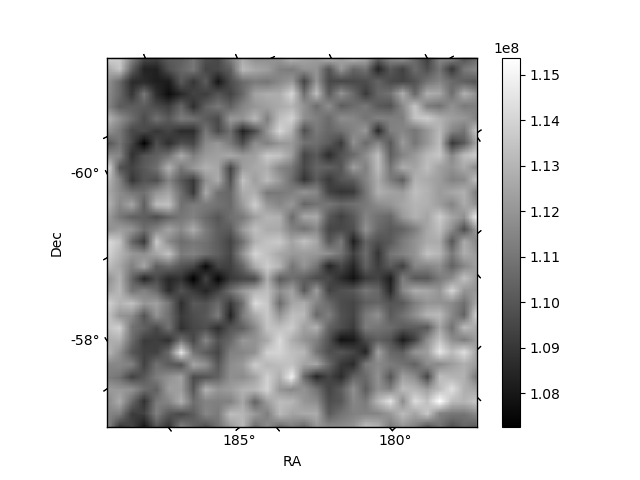
Histogram calculated using DETX and DETY for each event in the final _common_clean file
| Quadrant A | 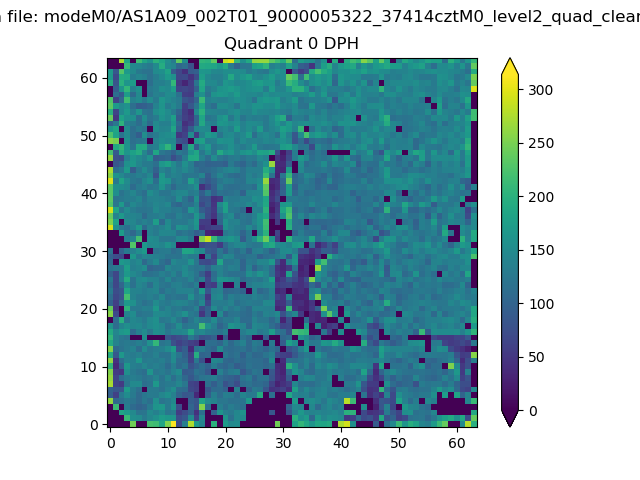 |
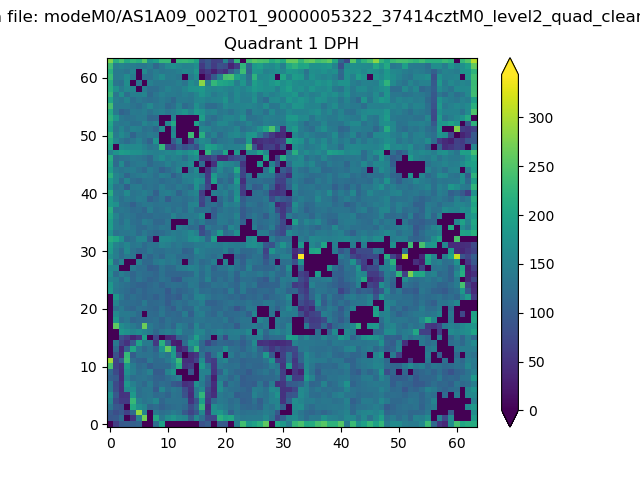 |
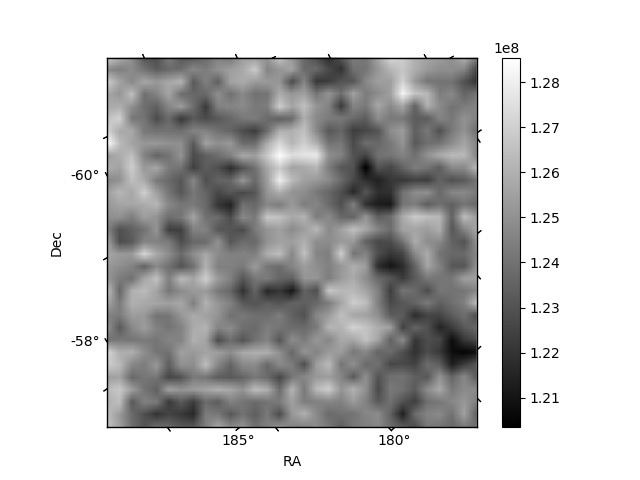
Quadrant B |
|---|---|---|---|
| Quadrant D | 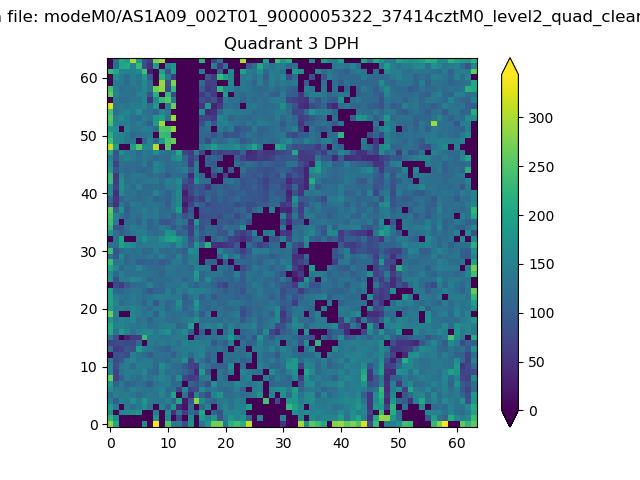 |
 |
Quadrant C |
| Plot type | Count rate plots | Images |
|---|---|---|
| Comparison with Poisson distribution Blue bars denote a histogram of data divided into 1 sec bins. Red curve is a Poisson curve with rate = median count rate of data. |
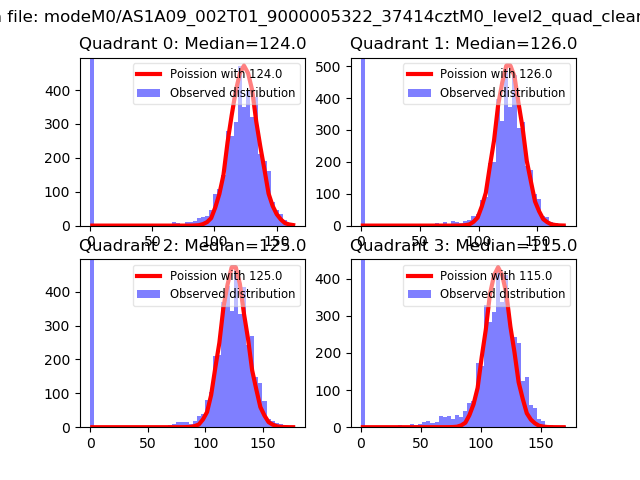 |
 |
| Quadrant-wise count rates Data is divided into 100 sec bins |
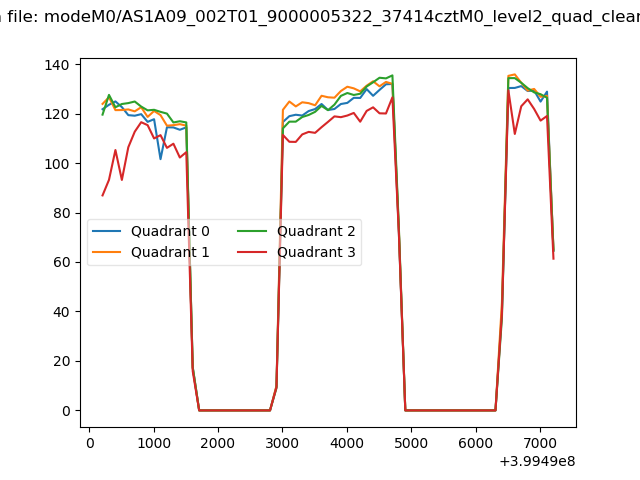 |
|
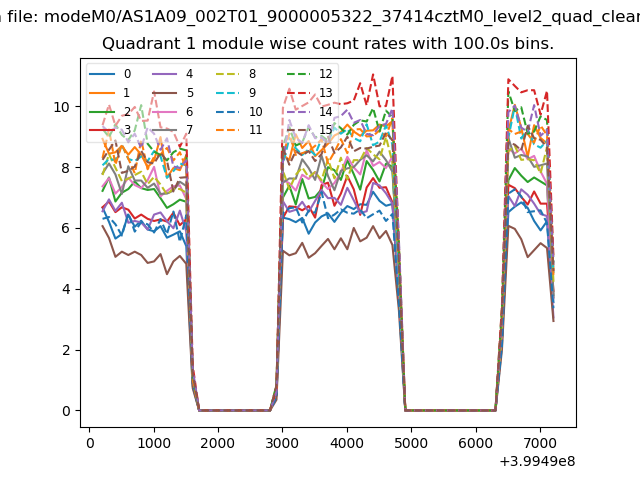
| Module-wise count rates for Quadrant A Data is divided into 100 sec bins |
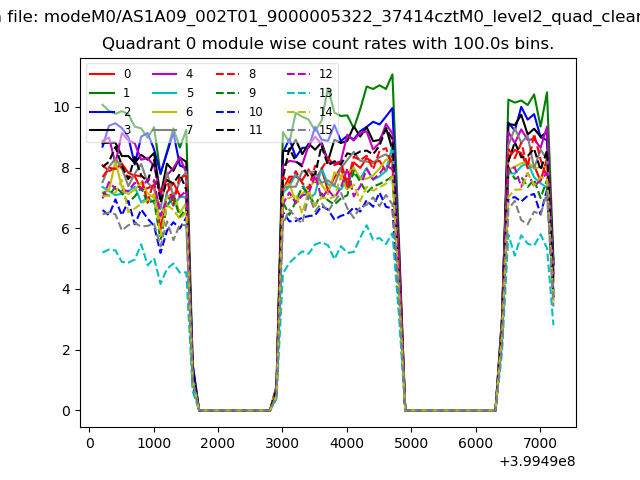 |
 |
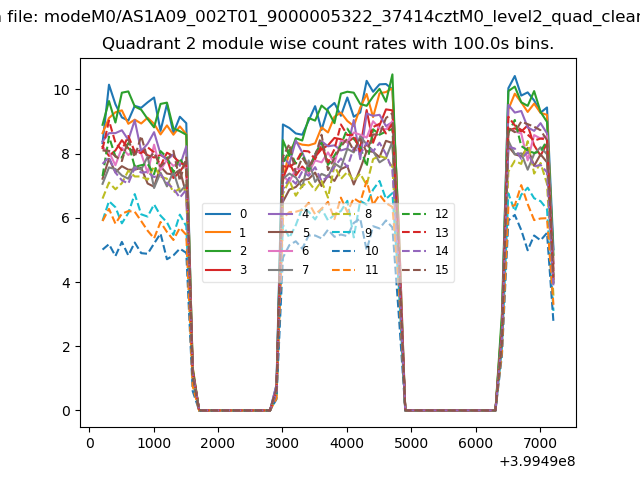
| Module-wise count rates for Quadrant B Data is divided into 100 sec bins |
 |
 |
| Module-wise count rates for Quadrant C Data is divided into 100 sec bins |
 |
 |
| Module-wise count rates for Quadrant D Data is divided into 100 sec bins |
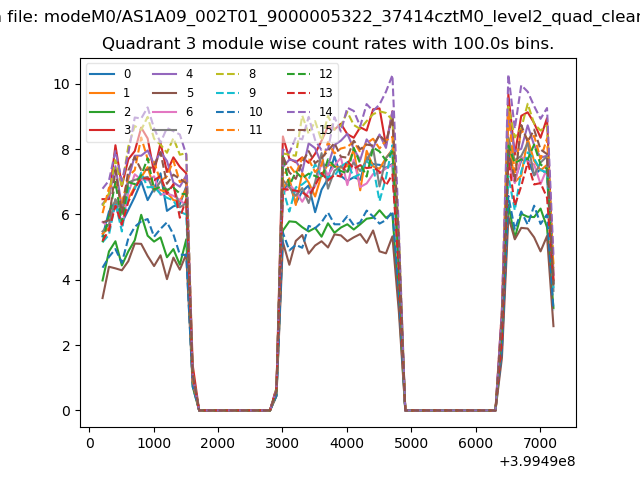 |
 |
| Parameter | Plot |
|---|---|
| CZT HV Monitor | 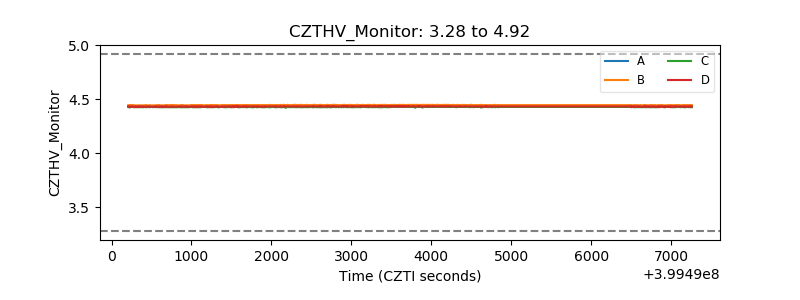 |
| D_VDD | 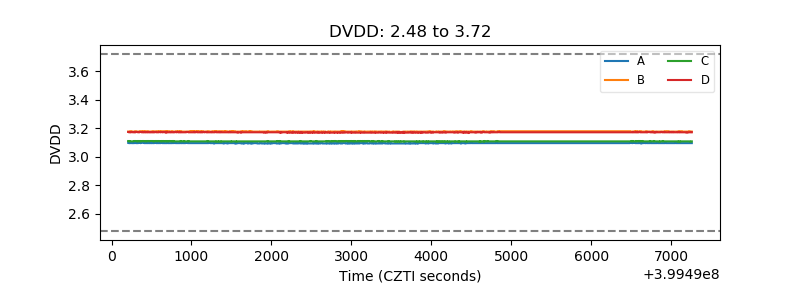 |
| Temperature 1 | 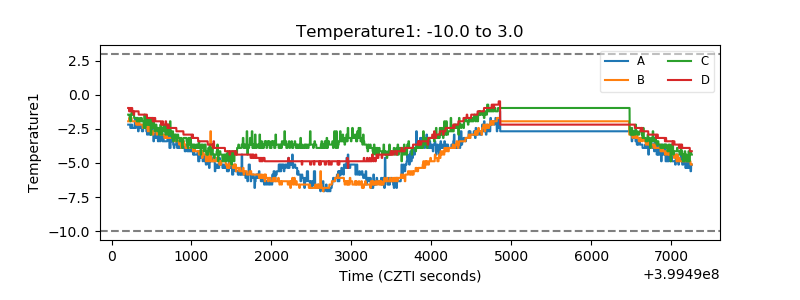 |
| Veto HV Monitor |  |
| Veto LLD | 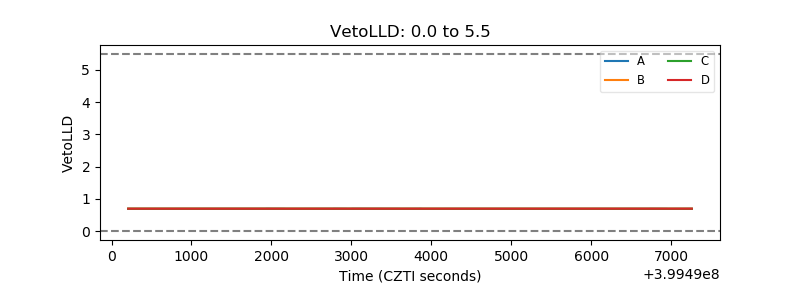 |
| Alpha Counter | 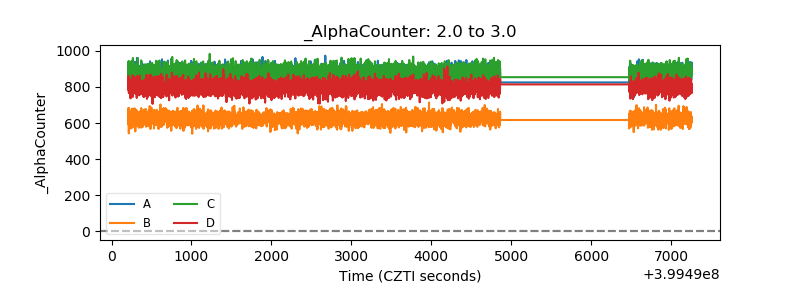 |
| _CPM_Rate | 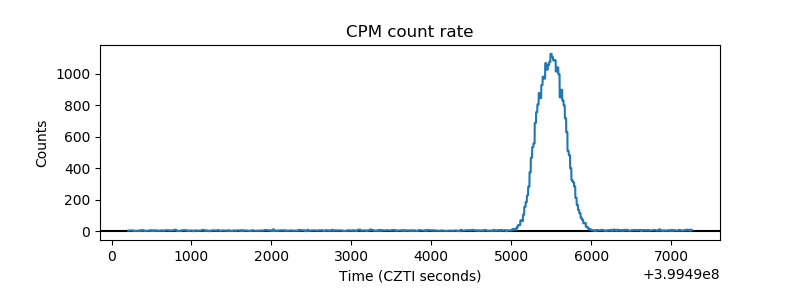 |
| CZT Counter | 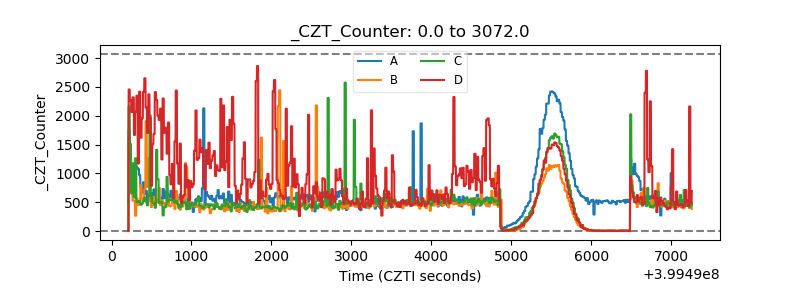 |
| +2.5 Volts monitor |  |
| +5 Volts monitor |  |
| _ROLL_ROT | 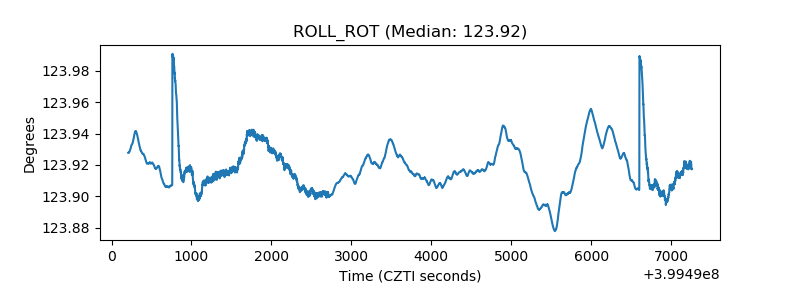 |
| _Roll_DEC | 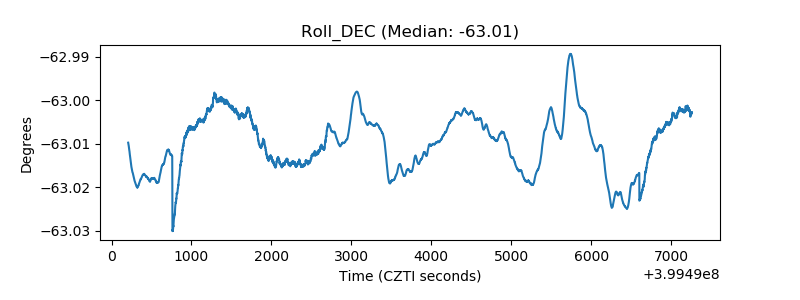 |
| _Roll_RA | 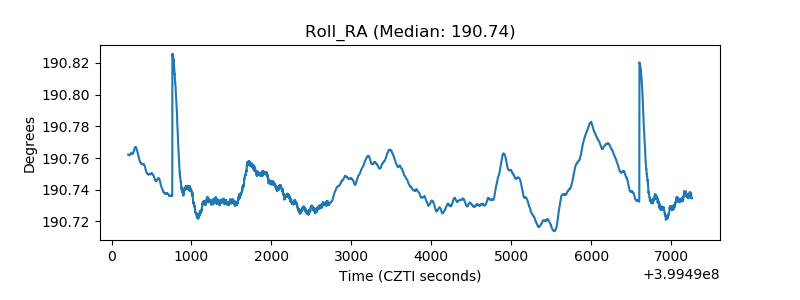 |
| Veto Counter | 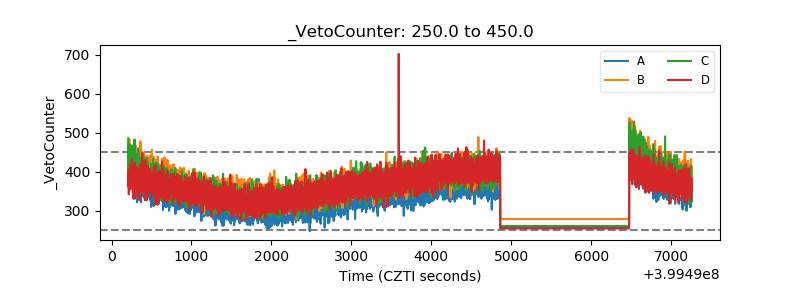 |