| Param | Original file | Final file |
|---|---|---|
| Filename | modeM0/AS1A09_002T01_9000005322_37416cztM0_level2.evt | modeM0/AS1A09_002T01_9000005322_37416cztM0_level2_quad_clean.evt |
| Size (bytes) | 407,684,160 | 74,756,160 |
| Size | 388.8 MB | 71.3 MB |
| Events in quadrant A | 3,068,088 | 475,319 |
| Events in quadrant B | 2,760,327 | 485,710 |
| Events in quadrant C | 2,876,793 | 475,901 |
| Events in quadrant D | 3,276,737 | 450,975 |
| Mode M0 | |||
|---|---|---|---|
| Quadrant | BADHDUFLAG | Total packets | Discarded packets |
| A | 0 | 12505 | 6 |
| B | 0 | 11711 | 2 |
| C | 0 | 11778 | 2 |
| D | 0 | 13432 | 5 |
| Mode M9 | |||
|---|---|---|---|
| Quadrant | BADHDUFLAG | Total packets | Discarded packets |
| A | 0 | 23 | 0 |
| B | 0 | 23 | 0 |
| C | 0 | 23 | 0 |
| D | 0 | 24 | 0 |
| Mode SS | |||
|---|---|---|---|
| Quadrant | BADHDUFLAG | Total packets | Discarded packets |
| A | 0 | 108 | 0 |
| B | 0 | 108 | 0 |
| C | 0 | 108 | 0 |
| D | 0 | 108 | 0 |
| Quadrant | Total seconds | Saturated seconds | Saturation percentage |
|---|---|---|---|
| A | 5370 | 49 | 0.912477% |
| B | 5372 | 31 | 0.577066% |
| C | 5372 | 76 | 1.414743% |
| D | 5371 | 144 | 2.681065% |
Noise dominated data is calculated using 1-second bins in cleaned event files. If a bin has >2000 counts, and if more than 50% of those come from <1% of pixels, then it is considered to be noise-dominated and hence unusable.
| Quadrant | # 1 sec bins | Bins with >0 counts | Bins with >2000 counts | High rate bins dominated by noise | Noise dominated (total time) | Noise dominated (detector-on time) | Marked lightcurve |
|---|---|---|---|---|---|---|---|
| A | 7104 | 5373 | 26 | 26 | 0.37% | 0.48% | 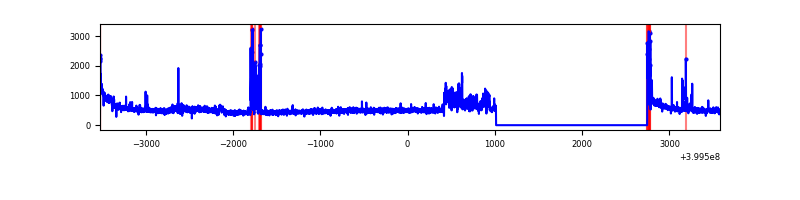 |
| B | 7104 | 5373 | 19 | 19 | 0.27% | 0.35% | 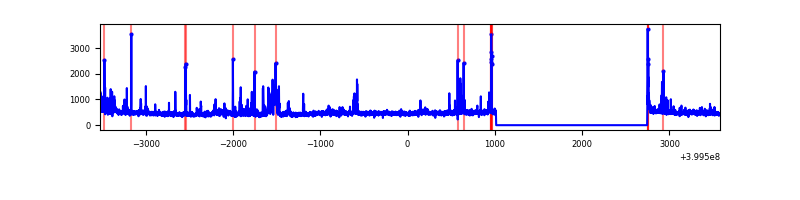 |
| C | 7104 | 5373 | 68 | 68 | 0.96% | 1.27% | 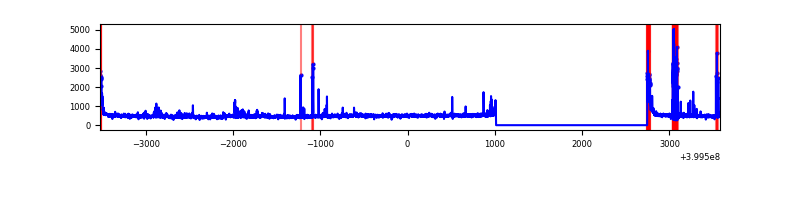 |
| D | 7104 | 5373 | 120 | 120 | 1.69% | 2.23% | 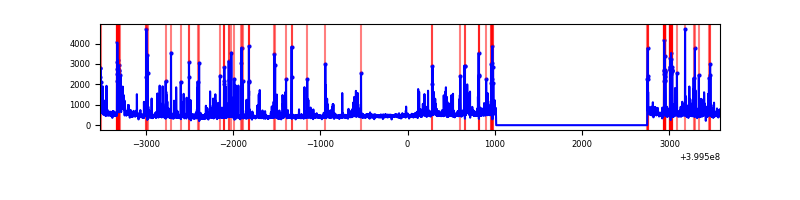 |
Top three noisy pixels from each quadrant. If the there are fewer than three noisy pixels in the level2.evt file, extra rows are filled as -1
| Pixel properties | Quadrant properties | ||||||
|---|---|---|---|---|---|---|---|
| Quadrant | DetID | PixID | Counts | Sigma | Mean | Median | Sigma |
| A | 15 | 222 | 381475 | 3116.9 | 603 | 592 | 122.2 |
| A | 10 | 83 | 287642 | 2349.03 | 603 | 592 | 122.2 |
| A | 9 | 143 | 35237 | 283.51 | 603 | 592 | 122.2 |
| B | 5 | 255 | 191309 | 1659.46 | 602 | 586 | 114.9 |
| B | 5 | 172 | 103786 | 897.93 | 602 | 586 | 114.9 |
| B | 4 | 232 | 24365 | 206.9 | 602 | 586 | 114.9 |
| C | 15 | 214 | 229049 | 1694.22 | 584 | 589 | 134.8 |
| C | 1 | 23 | 128535 | 948.82 | 584 | 589 | 134.8 |
| C | 0 | 10 | 121950 | 899.99 | 584 | 589 | 134.8 |
| D | 13 | 249 | 162056 | 1149.12 | 577 | 561 | 140.5 |
| D | 12 | 235 | 148116 | 1049.93 | 577 | 561 | 140.5 |
| D | 2 | 249 | 144652 | 1025.28 | 577 | 561 | 140.5 |
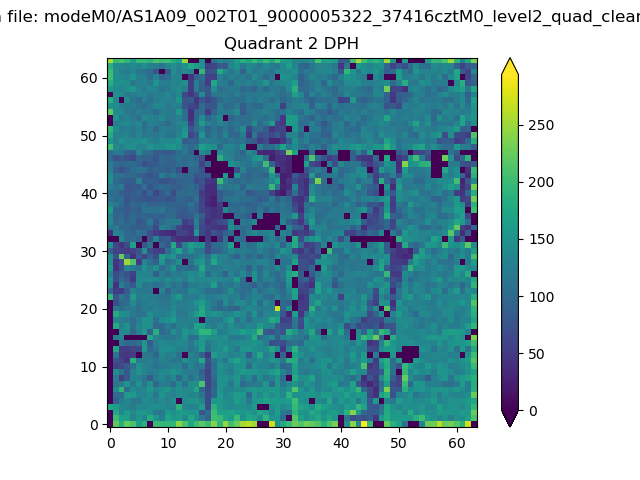
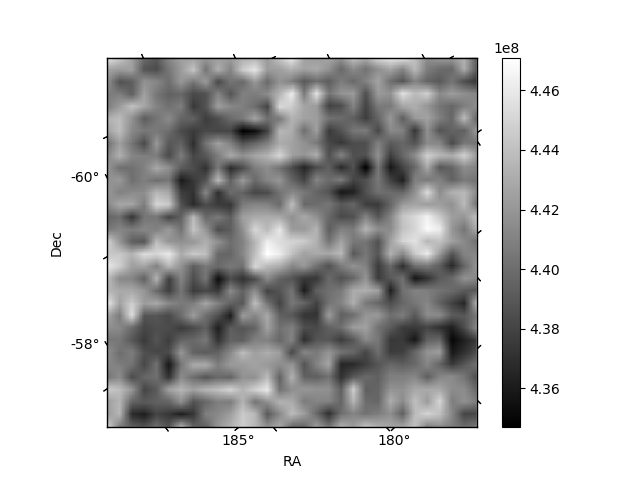
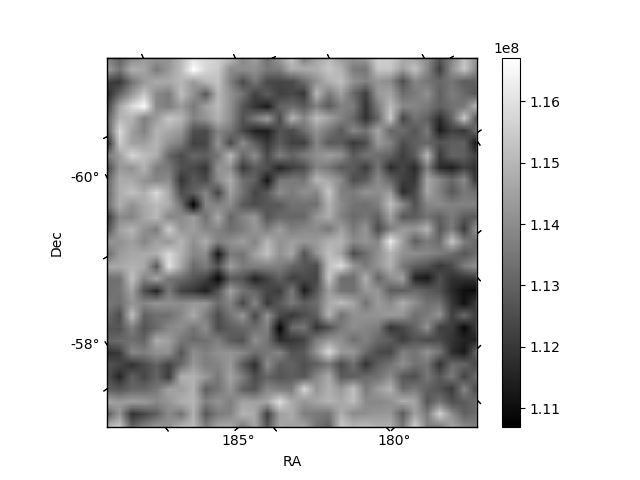
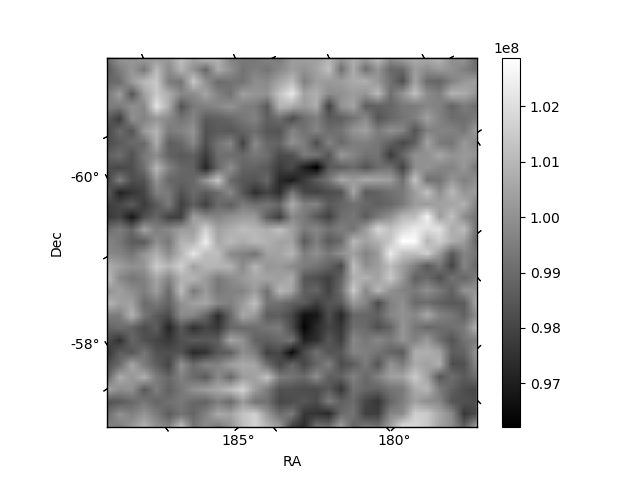
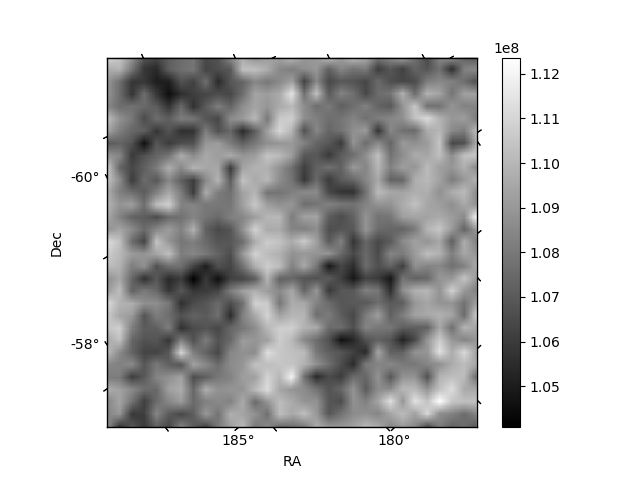
Histogram calculated using DETX and DETY for each event in the final _common_clean file
| Quadrant A | 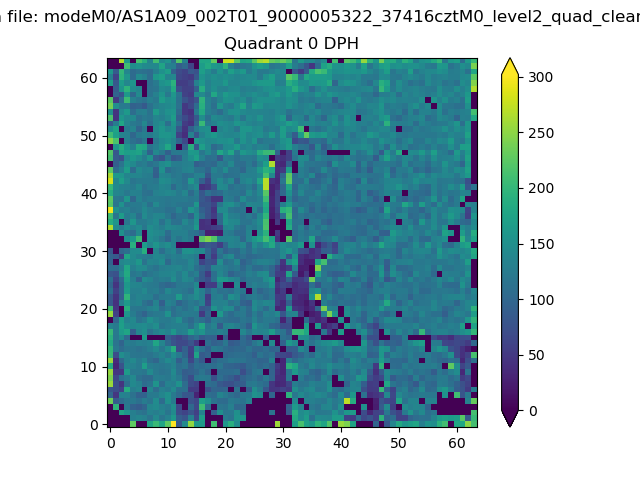 |
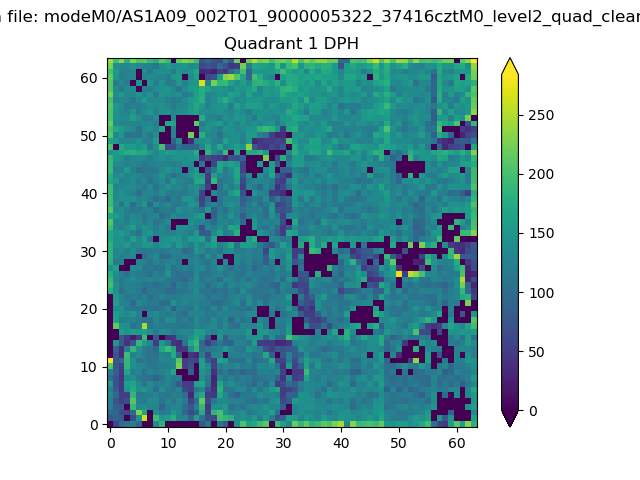 |
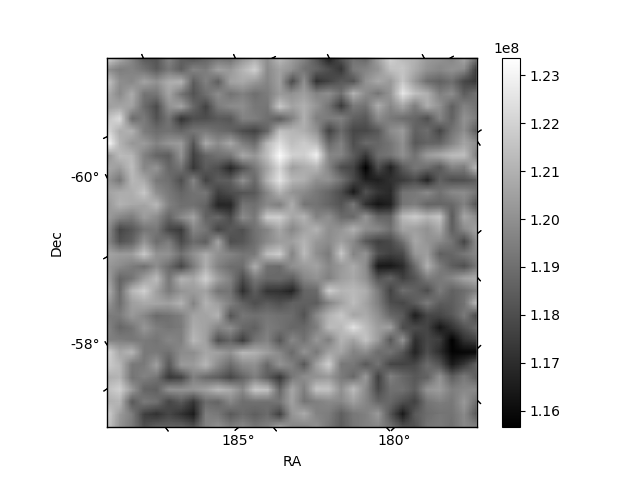
Quadrant B |
|---|---|---|---|
| Quadrant D | 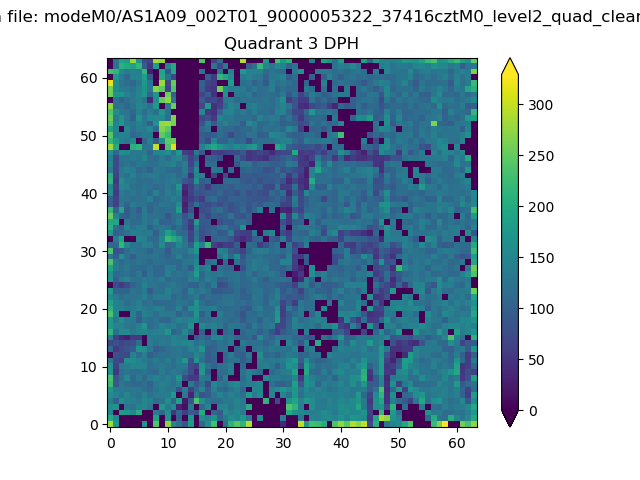 |
 |
Quadrant C |
| Plot type | Count rate plots | Images |
|---|---|---|
| Comparison with Poisson distribution Blue bars denote a histogram of data divided into 1 sec bins. Red curve is a Poisson curve with rate = median count rate of data. |
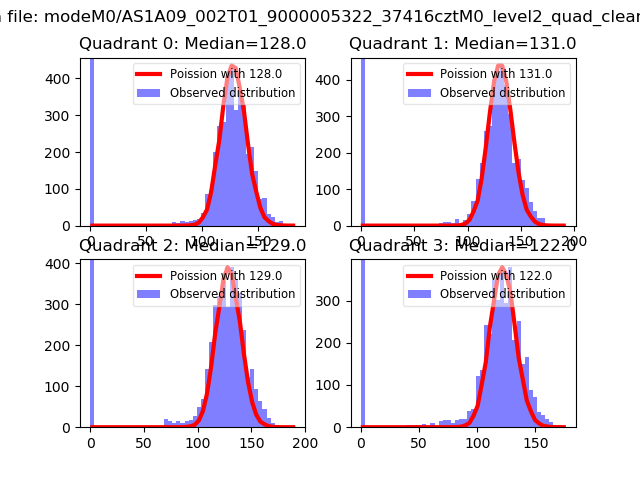 |
 |
| Quadrant-wise count rates Data is divided into 100 sec bins |
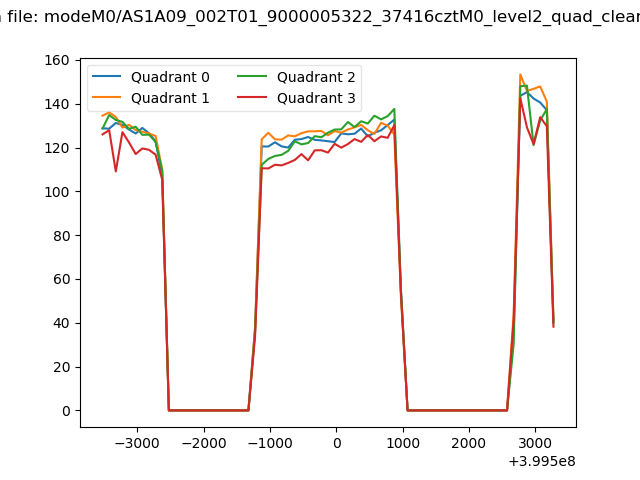 |
|
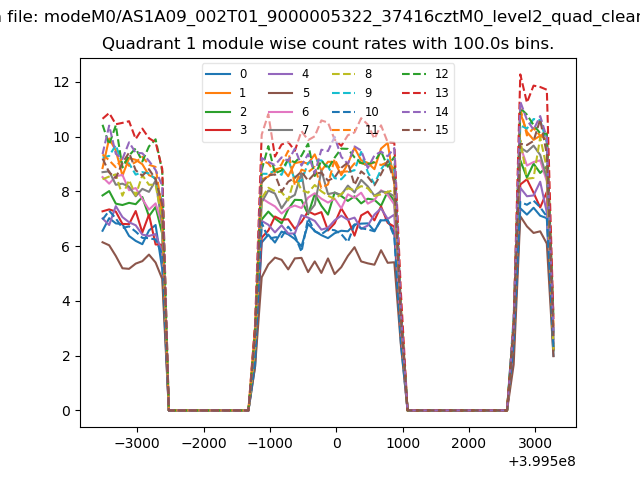
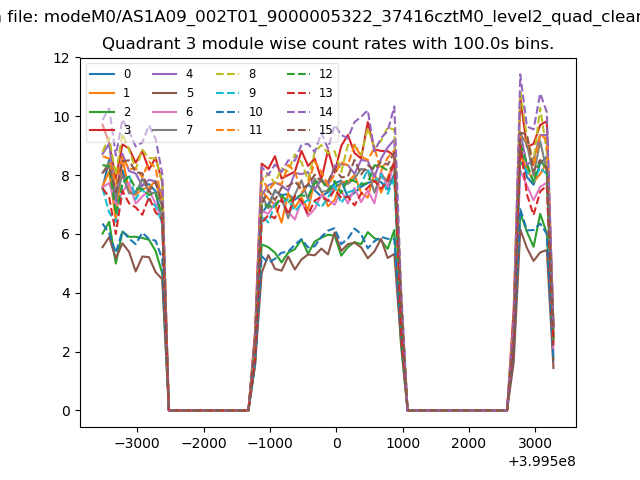
| Module-wise count rates for Quadrant A Data is divided into 100 sec bins |
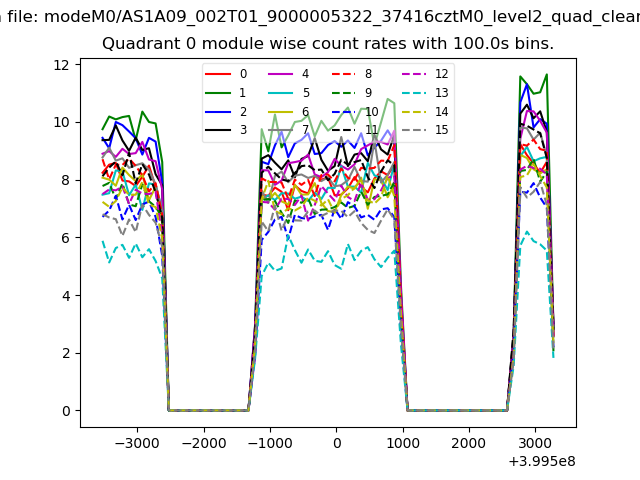 |
 |
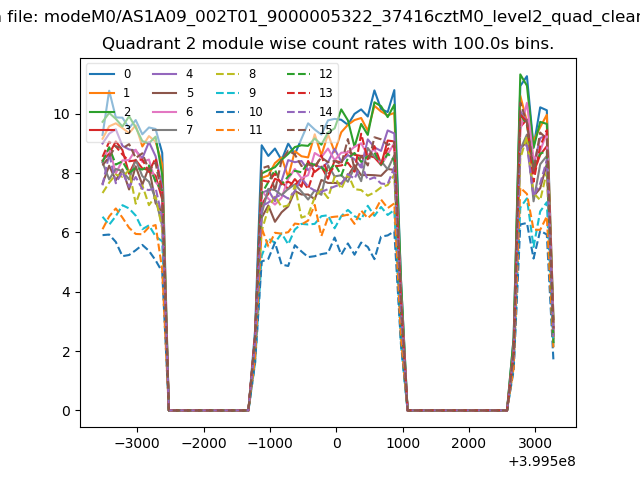
| Module-wise count rates for Quadrant B Data is divided into 100 sec bins |
 |
 |
| Module-wise count rates for Quadrant C Data is divided into 100 sec bins |
 |
 |
| Module-wise count rates for Quadrant D Data is divided into 100 sec bins |
 |
 |
| Parameter | Plot |
|---|---|
| CZT HV Monitor | 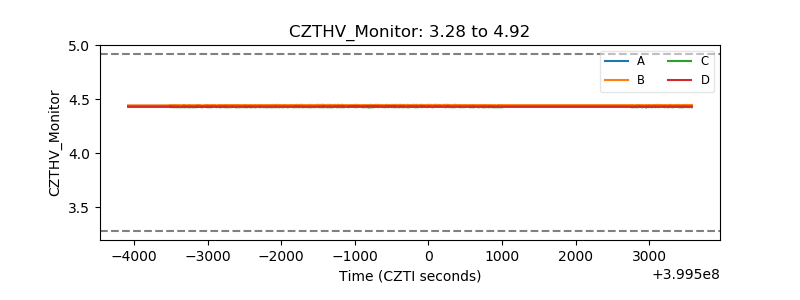 |
| D_VDD | 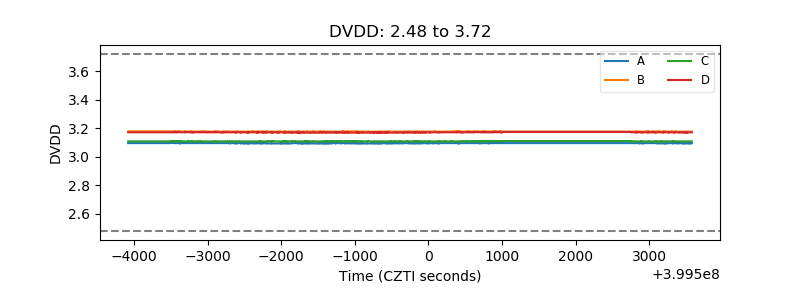 |
| Temperature 1 | 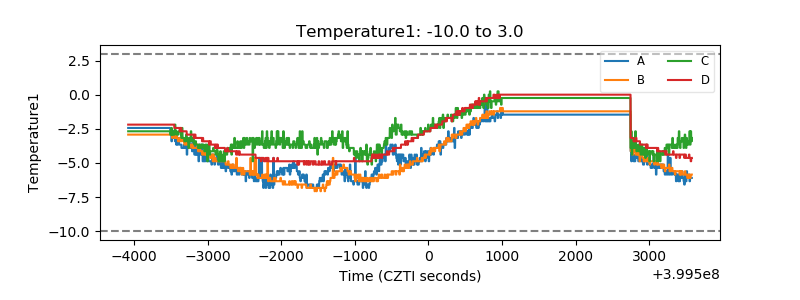 |
| Veto HV Monitor |  |
| Veto LLD | 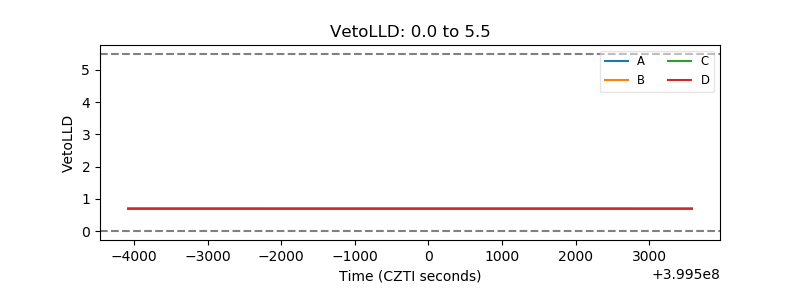 |
| Alpha Counter | 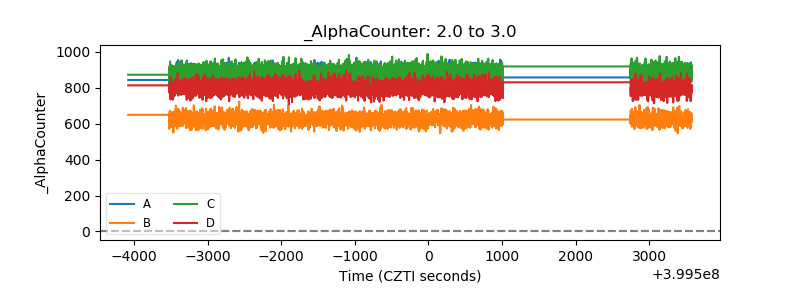 |
| _CPM_Rate | 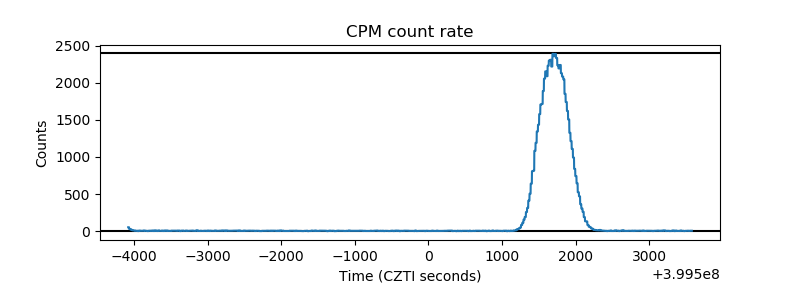 |
| CZT Counter | 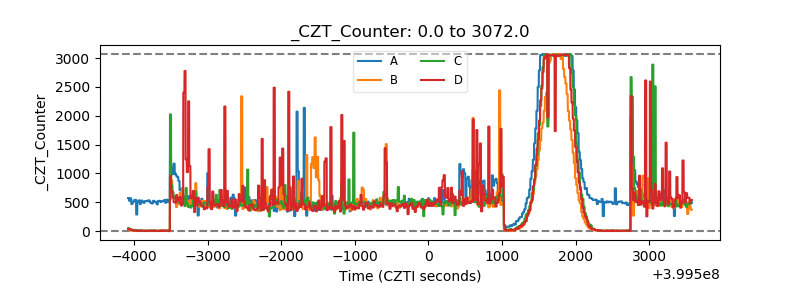 |
| +2.5 Volts monitor | 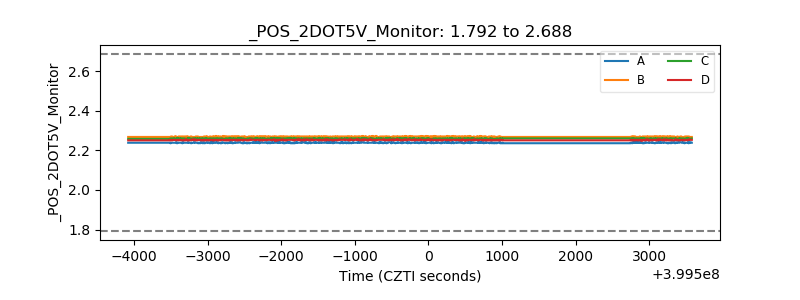 |
| +5 Volts monitor | 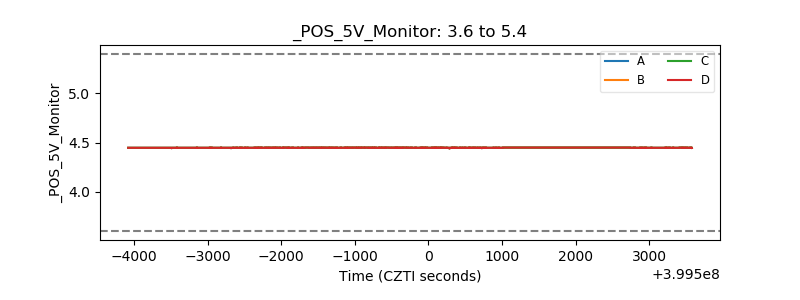 |
| _ROLL_ROT | 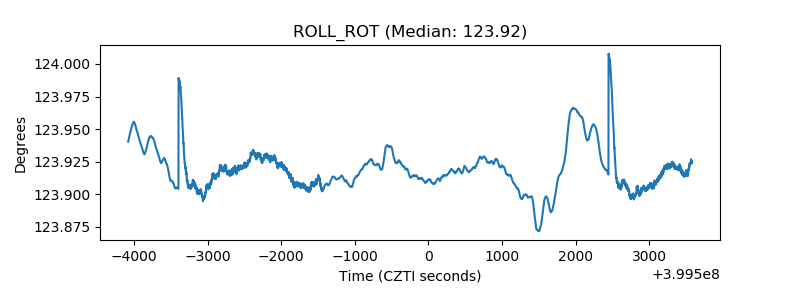 |
| _Roll_DEC | 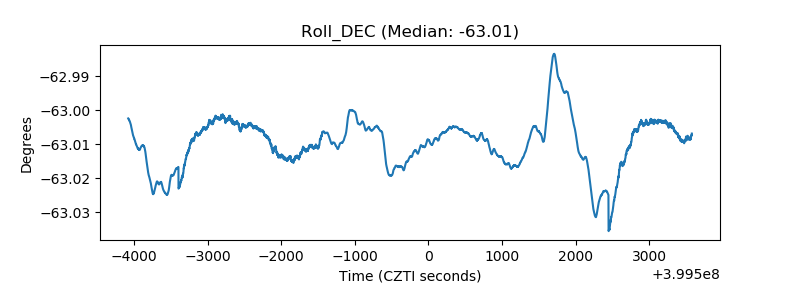 |
| _Roll_RA | 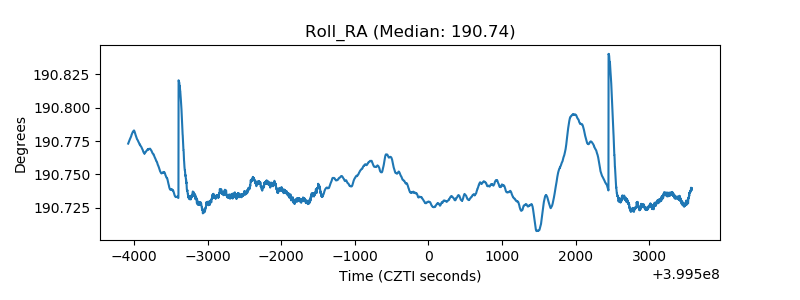 |
| Veto Counter | 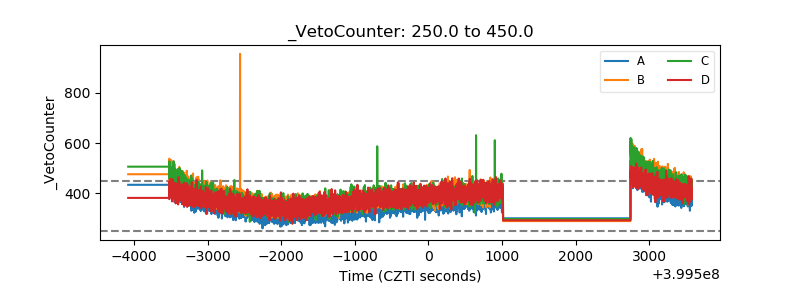 |