| Param | Original file | Final file |
|---|---|---|
| Filename | modeM0/AS1A09_002T01_9000005322_37417cztM0_level2.evt | modeM0/AS1A09_002T01_9000005322_37417cztM0_level2_quad_clean.evt |
| Size (bytes) | 2,322,887,040 | 383,768,640 |
| Size | 2.2 GB | 366.0 MB |
| Events in quadrant A | 16,306,835 | 2,434,343 |
| Events in quadrant B | 14,364,936 | 2,479,558 |
| Events in quadrant C | 14,685,193 | 2,465,650 |
| Events in quadrant D | 23,065,453 | 2,277,946 |
| Mode M0 | |||
|---|---|---|---|
| Quadrant | BADHDUFLAG | Total packets | Discarded packets |
| A | 0 | 66445 | 7 |
| B | 0 | 61829 | 6 |
| C | 0 | 61385 | 6 |
| D | 0 | 88112 | 6 |
| Mode M9 | |||
|---|---|---|---|
| Quadrant | BADHDUFLAG | Total packets | Discarded packets |
| A | 0 | 93 | 0 |
| B | 0 | 93 | 0 |
| C | 0 | 93 | 0 |
| D | 0 | 93 | 0 |
| Mode SS | |||
|---|---|---|---|
| Quadrant | BADHDUFLAG | Total packets | Discarded packets |
| A | 0 | 586 | 0 |
| B | 0 | 586 | 0 |
| C | 0 | 586 | 0 |
| D | 0 | 586 | 0 |
| Quadrant | Total seconds | Saturated seconds | Saturation percentage |
|---|---|---|---|
| A | 28589 | 415 | 1.451607% |
| B | 28589 | 306 | 1.070342% |
| C | 28589 | 225 | 0.787016% |
| D | 28589 | 1742 | 6.093253% |
Noise dominated data is calculated using 1-second bins in cleaned event files. If a bin has >2000 counts, and if more than 50% of those come from <1% of pixels, then it is considered to be noise-dominated and hence unusable.
| Quadrant | # 1 sec bins | Bins with >0 counts | Bins with >2000 counts | High rate bins dominated by noise | Noise dominated (total time) | Noise dominated (detector-on time) | Marked lightcurve |
|---|---|---|---|---|---|---|---|
| A | 37962 | 28595 | 301 | 301 | 0.79% | 1.05% | 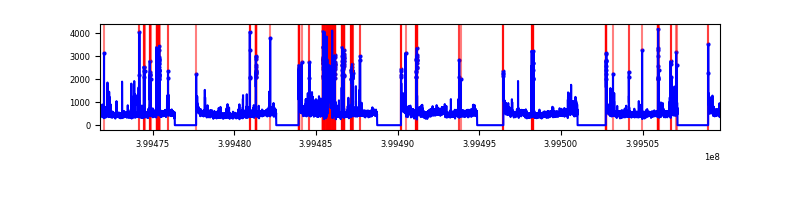 |
| B | 37962 | 28595 | 187 | 187 | 0.49% | 0.65% | 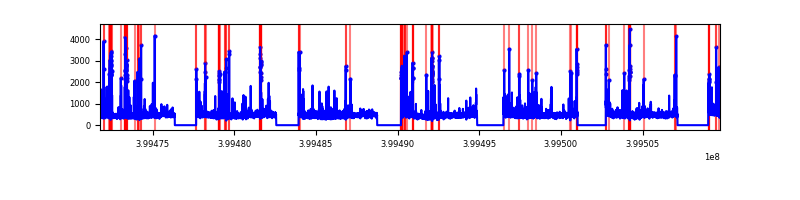 |
| C | 37962 | 28595 | 190 | 190 | 0.50% | 0.66% | 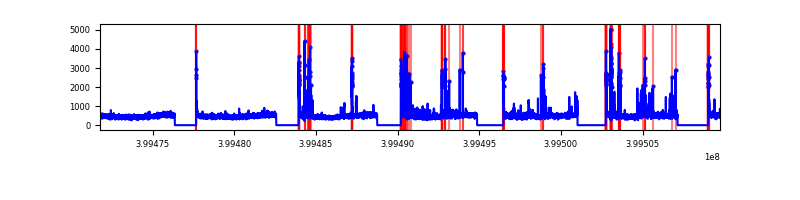 |
| D | 37962 | 28595 | 1685 | 1685 | 4.44% | 5.89% |  |
Top three noisy pixels from each quadrant. If the there are fewer than three noisy pixels in the level2.evt file, extra rows are filled as -1
| Pixel properties | Quadrant properties | ||||||
|---|---|---|---|---|---|---|---|
| Quadrant | DetID | PixID | Counts | Sigma | Mean | Median | Sigma |
| A | 15 | 222 | 1831903 | 2892.06 | 3180 | 3114 | 632.3 |
| A | 10 | 83 | 1233799 | 1946.21 | 3180 | 3114 | 632.3 |
| A | 6 | 10 | 318977 | 499.51 | 3180 | 3114 | 632.3 |
| B | 5 | 255 | 695876 | 1163.44 | 3177 | 3095 | 595.5 |
| B | 5 | 172 | 593589 | 991.66 | 3177 | 3095 | 595.5 |
| B | 0 | 190 | 119699 | 195.82 | 3177 | 3095 | 595.5 |
| C | 15 | 214 | 1193258 | 1664.01 | 3114 | 3139 | 715.2 |
| C | 14 | 254 | 527843 | 733.63 | 3114 | 3139 | 715.2 |
| C | 0 | 10 | 318754 | 441.29 | 3114 | 3139 | 715.2 |
| D | 12 | 227 | 4936254 | 6664.2 | 3059 | 2972 | 740.3 |
| D | 2 | 250 | 1508023 | 2033.12 | 3059 | 2972 | 740.3 |
| D | 12 | 235 | 1370640 | 1847.54 | 3059 | 2972 | 740.3 |
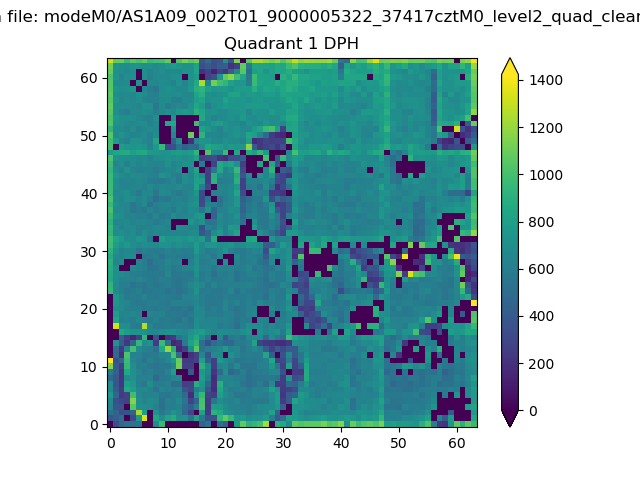
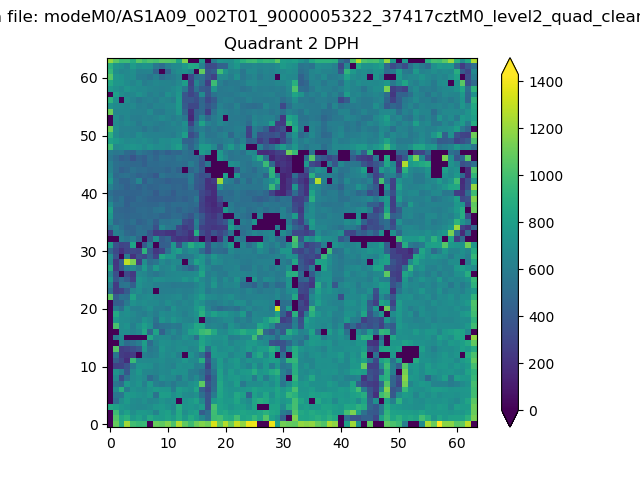
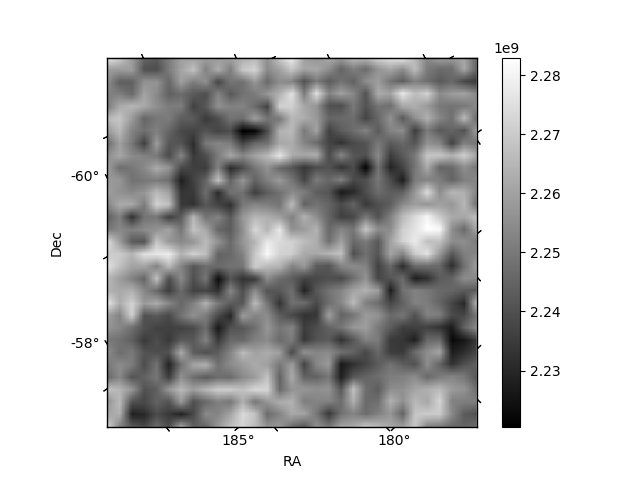
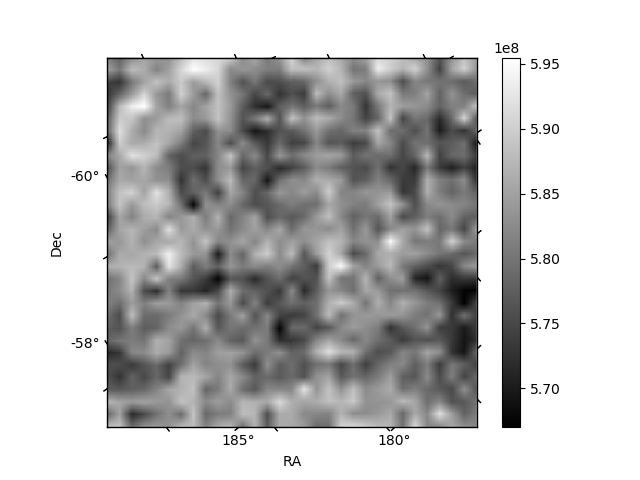
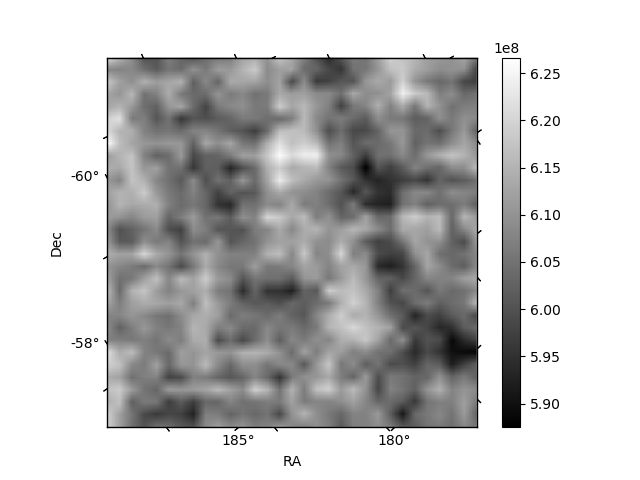
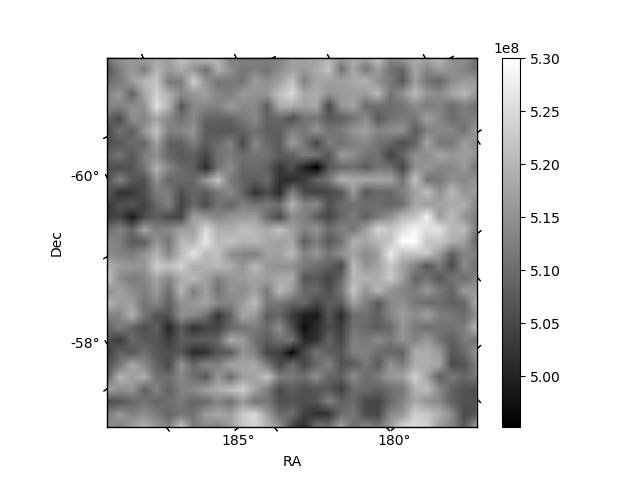
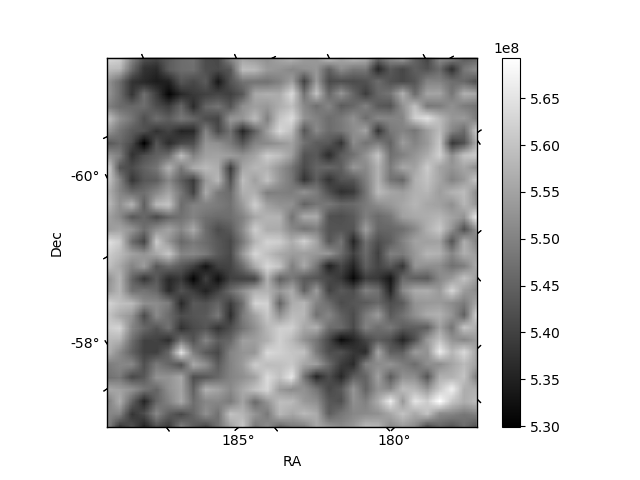
Histogram calculated using DETX and DETY for each event in the final _common_clean file
| Quadrant A | 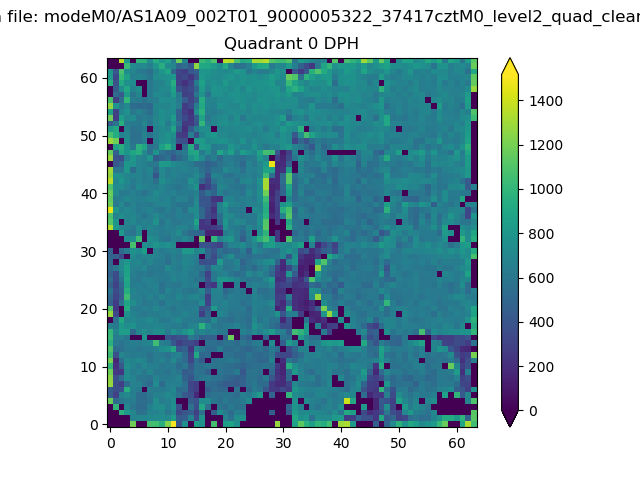 |
 |
Quadrant B |
|---|---|---|---|
| Quadrant D | 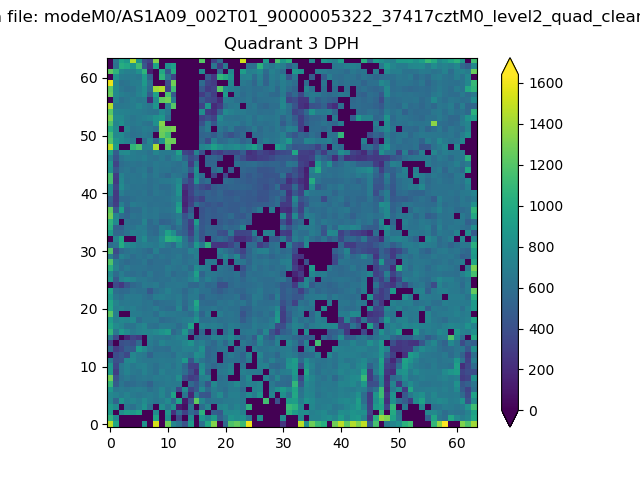 |
 |
Quadrant C |
| Plot type | Count rate plots | Images |
|---|---|---|
| Comparison with Poisson distribution Blue bars denote a histogram of data divided into 1 sec bins. Red curve is a Poisson curve with rate = median count rate of data. |
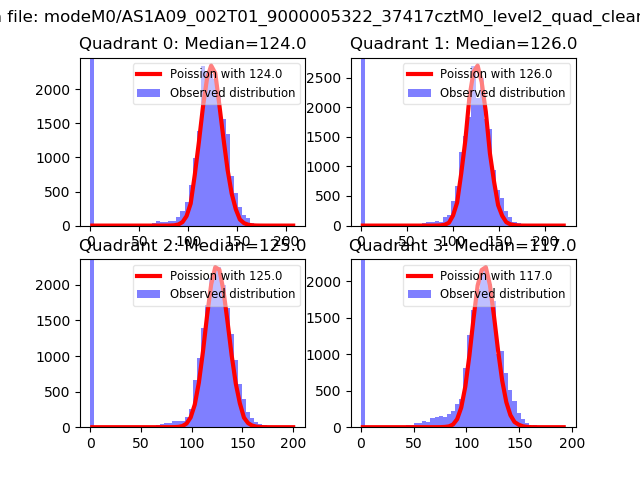 |
 |
| Quadrant-wise count rates Data is divided into 100 sec bins |
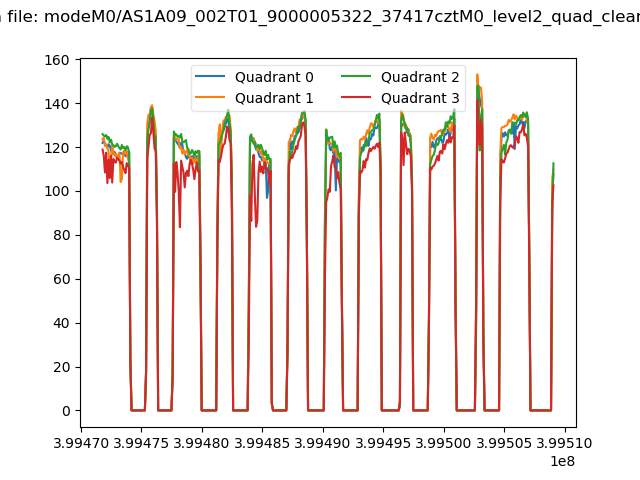 |
|
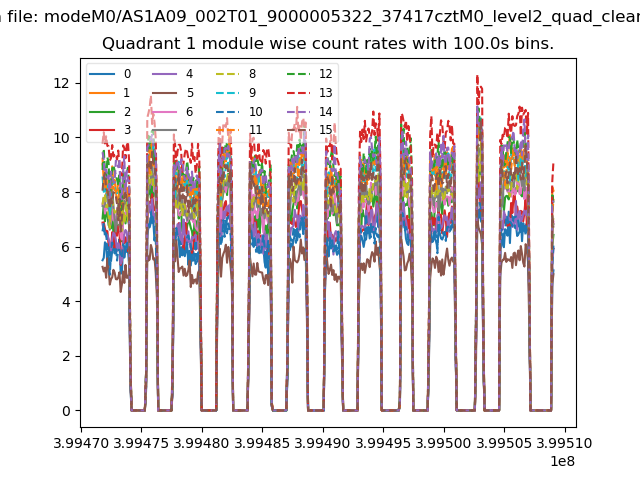
| Module-wise count rates for Quadrant A Data is divided into 100 sec bins |
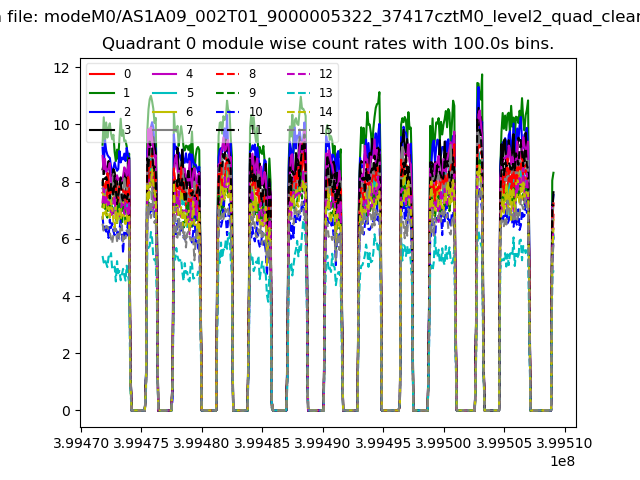 |
 |
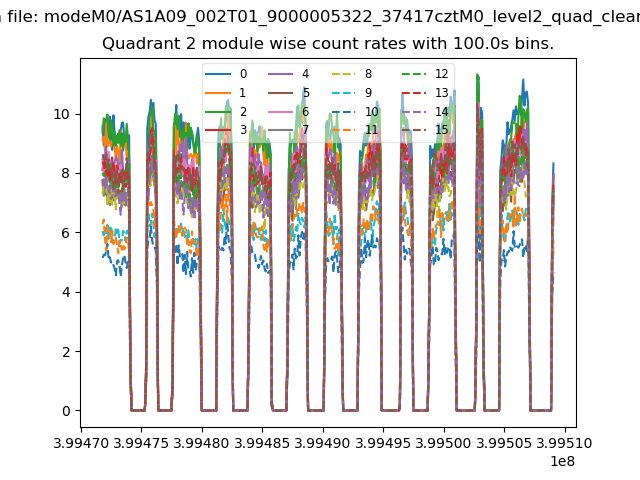
| Module-wise count rates for Quadrant B Data is divided into 100 sec bins |
 |
 |
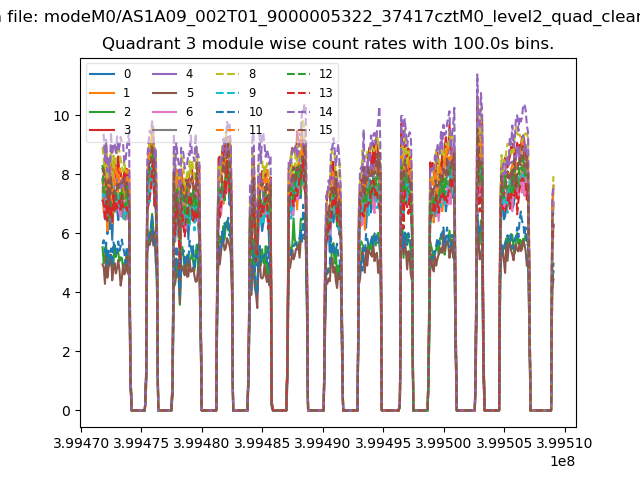
| Module-wise count rates for Quadrant C Data is divided into 100 sec bins |
 |
 |
| Module-wise count rates for Quadrant D Data is divided into 100 sec bins |
 |
 |
| Parameter | Plot |
|---|---|
| CZT HV Monitor | 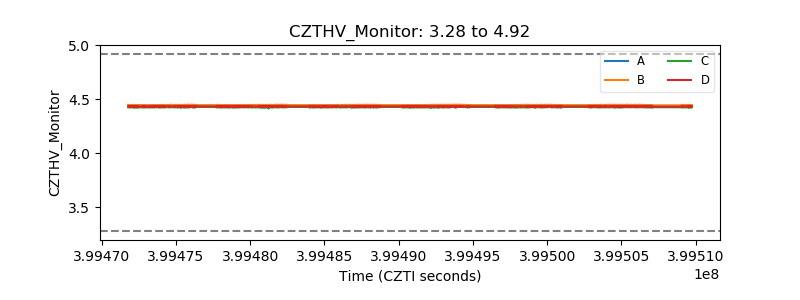 |
| D_VDD | 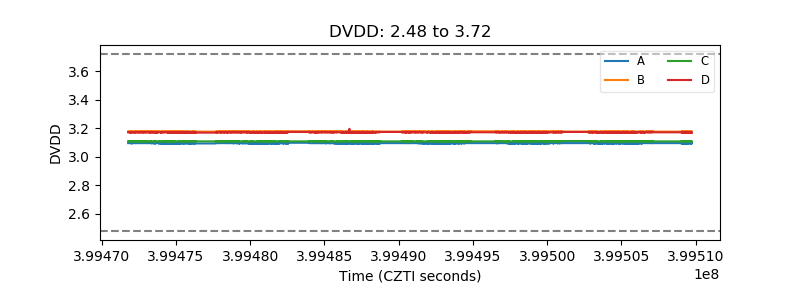 |
| Temperature 1 | 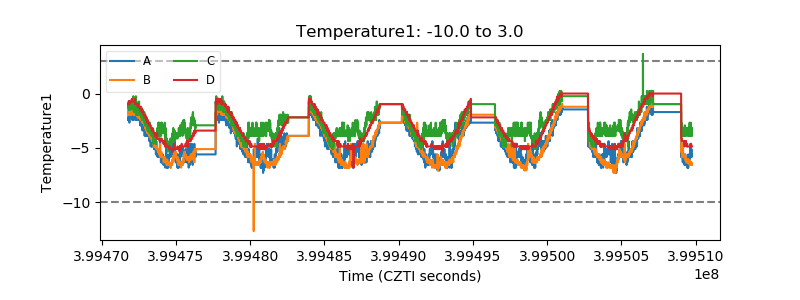 |
| Veto HV Monitor | 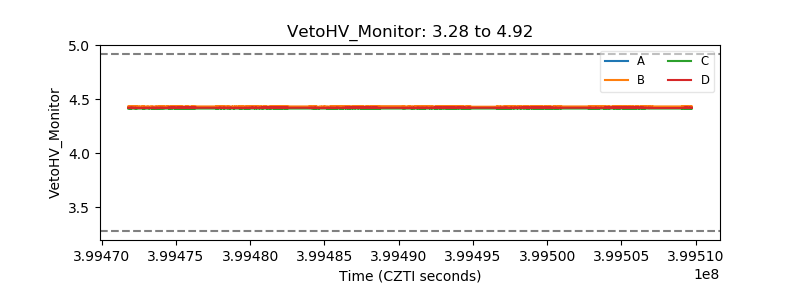 |
| Veto LLD | 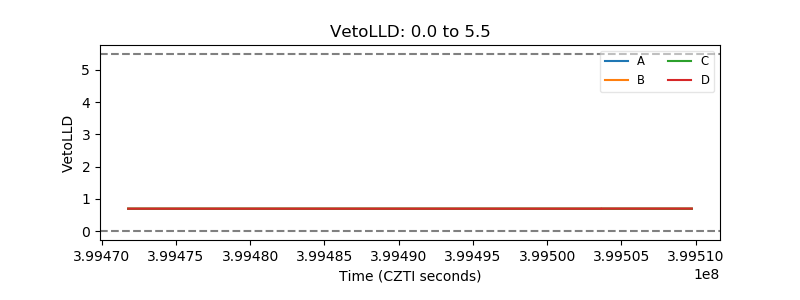 |
| Alpha Counter | 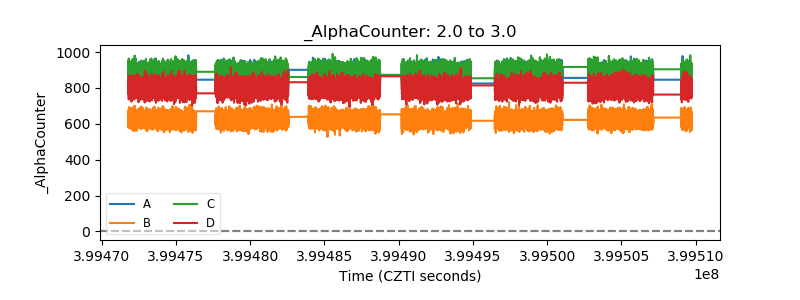 |
| _CPM_Rate | 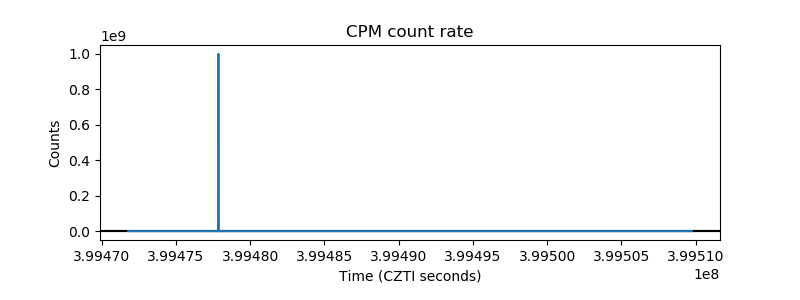 |
| CZT Counter | 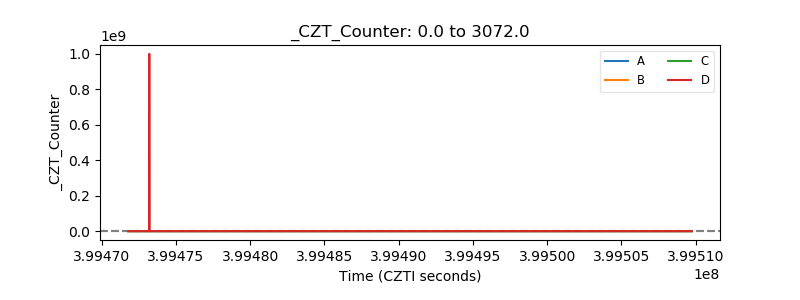 |
| +2.5 Volts monitor | 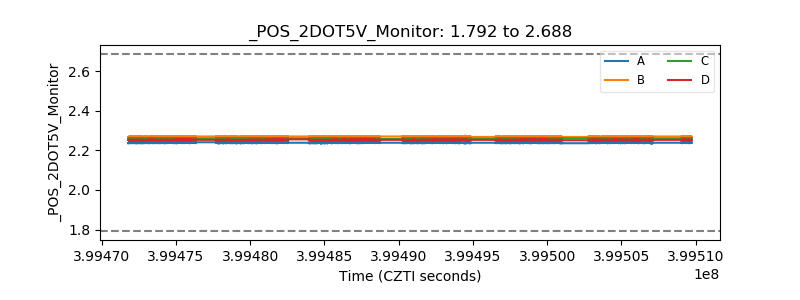 |
| +5 Volts monitor | 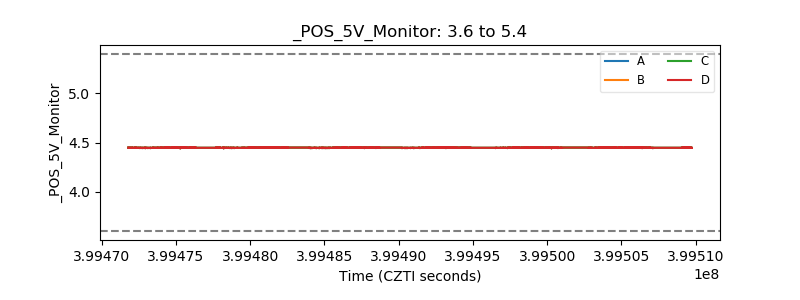 |
| _ROLL_ROT | 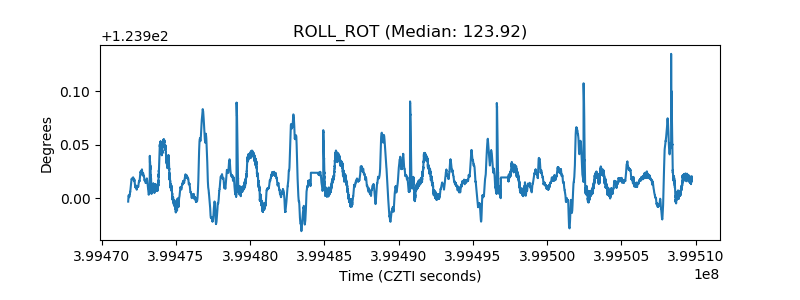 |
| _Roll_DEC | 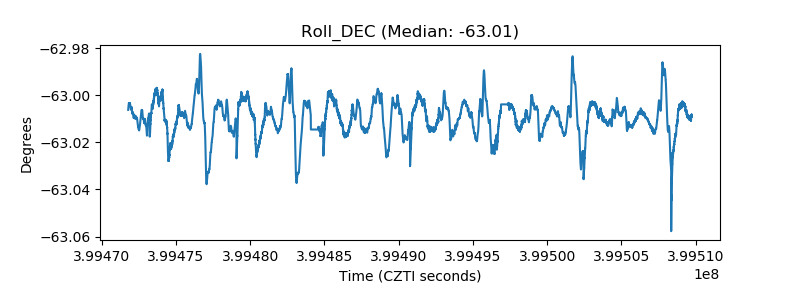 |
| _Roll_RA | 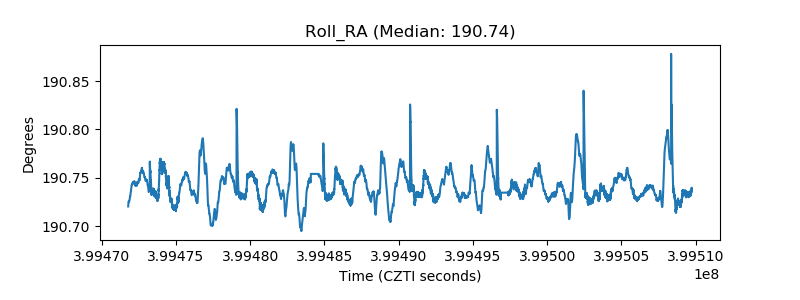 |
| Veto Counter | 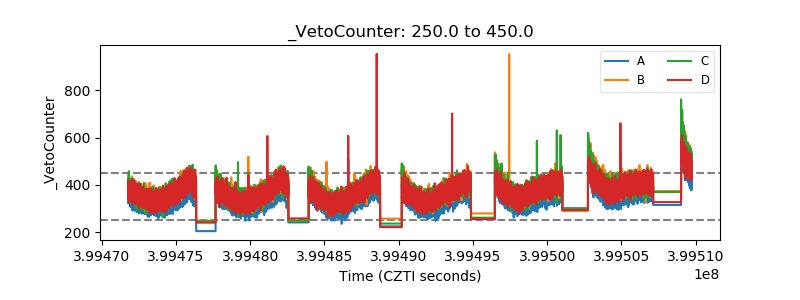 |