| Param | Original file | Final file |
|---|---|---|
| Filename | modeM0/AS1A09_002T01_9000005322_37419cztM0_level2.evt | modeM0/AS1A09_002T01_9000005322_37419cztM0_level2_quad_clean.evt |
| Size (bytes) | 428,224,320 | 77,353,920 |
| Size | 408.4 MB | 73.8 MB |
| Events in quadrant A | 3,176,489 | 489,430 |
| Events in quadrant B | 3,014,227 | 507,782 |
| Events in quadrant C | 2,992,352 | 504,476 |
| Events in quadrant D | 3,428,781 | 472,454 |
| Mode M0 | |||
|---|---|---|---|
| Quadrant | BADHDUFLAG | Total packets | Discarded packets |
| A | 0 | 12532 | 3 |
| B | 0 | 12071 | 2 |
| C | 0 | 11718 | 2 |
| D | 0 | 13557 | 2 |
| Mode M9 | |||
|---|---|---|---|
| Quadrant | BADHDUFLAG | Total packets | Discarded packets |
| A | 0 | 33 | 0 |
| B | 0 | 33 | 0 |
| C | 0 | 33 | 0 |
| D | 0 | 34 | 0 |
| Mode SS | |||
|---|---|---|---|
| Quadrant | BADHDUFLAG | Total packets | Discarded packets |
| A | 0 | 108 | 0 |
| B | 0 | 108 | 0 |
| C | 0 | 108 | 0 |
| D | 0 | 108 | 0 |
| Quadrant | Total seconds | Saturated seconds | Saturation percentage |
|---|---|---|---|
| A | 5255 | 98 | 1.864891% |
| B | 5255 | 79 | 1.503330% |
| C | 5255 | 48 | 0.913416% |
| D | 5255 | 75 | 1.427212% |
Noise dominated data is calculated using 1-second bins in cleaned event files. If a bin has >2000 counts, and if more than 50% of those come from <1% of pixels, then it is considered to be noise-dominated and hence unusable.
| Quadrant | # 1 sec bins | Bins with >0 counts | Bins with >2000 counts | High rate bins dominated by noise | Noise dominated (total time) | Noise dominated (detector-on time) | Marked lightcurve |
|---|---|---|---|---|---|---|---|
| A | 7347 | 5256 | 69 | 69 | 0.94% | 1.31% | 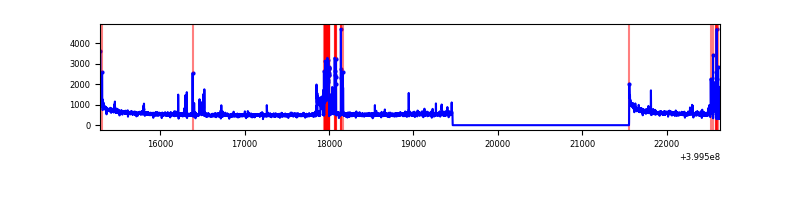 |
| B | 7347 | 5256 | 46 | 46 | 0.63% | 0.88% | 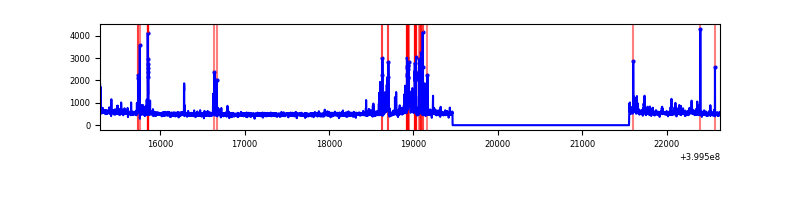 |
| C | 7347 | 5256 | 44 | 44 | 0.60% | 0.84% | 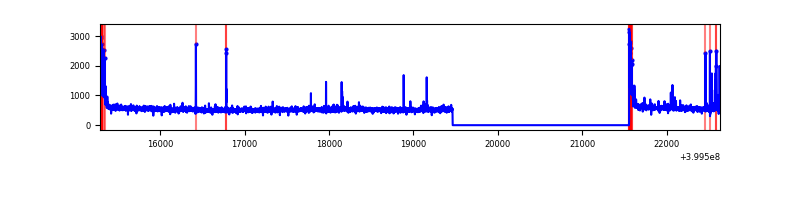 |
| D | 7347 | 5256 | 70 | 70 | 0.95% | 1.33% | 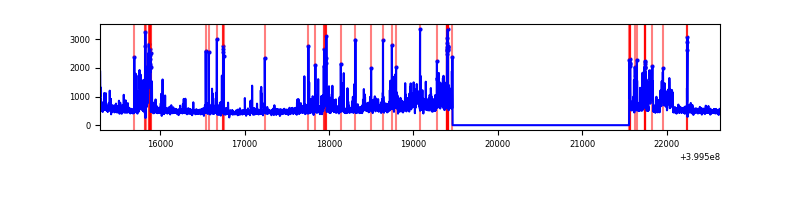 |
Top three noisy pixels from each quadrant. If the there are fewer than three noisy pixels in the level2.evt file, extra rows are filled as -1
| Pixel properties | Quadrant properties | ||||||
|---|---|---|---|---|---|---|---|
| Quadrant | DetID | PixID | Counts | Sigma | Mean | Median | Sigma |
| A | 15 | 222 | 291924 | 2247.88 | 652 | 640 | 129.6 |
| A | 10 | 83 | 272602 | 2098.77 | 652 | 640 | 129.6 |
| A | 9 | 143 | 33861 | 256.37 | 652 | 640 | 129.6 |
| B | 5 | 172 | 275948 | 2296.92 | 654 | 638 | 119.9 |
| B | 0 | 229 | 61750 | 509.86 | 654 | 638 | 119.9 |
| B | 0 | 155 | 42149 | 346.33 | 654 | 638 | 119.9 |
| C | 15 | 214 | 223549 | 1502.49 | 652 | 659 | 148.3 |
| C | 0 | 10 | 141781 | 951.3 | 652 | 659 | 148.3 |
| C | 14 | 254 | 32410 | 214.03 | 652 | 659 | 148.3 |
| D | 12 | 235 | 292579 | 1865.89 | 646 | 631 | 156.5 |
| D | 2 | 249 | 207290 | 1320.79 | 646 | 631 | 156.5 |
| D | 12 | 227 | 189288 | 1205.74 | 646 | 631 | 156.5 |
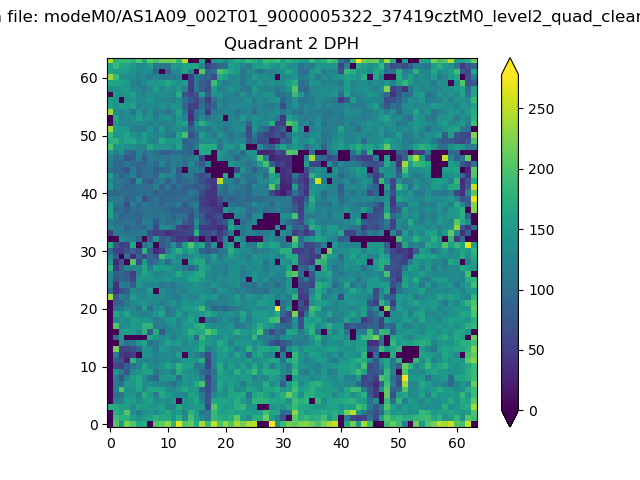
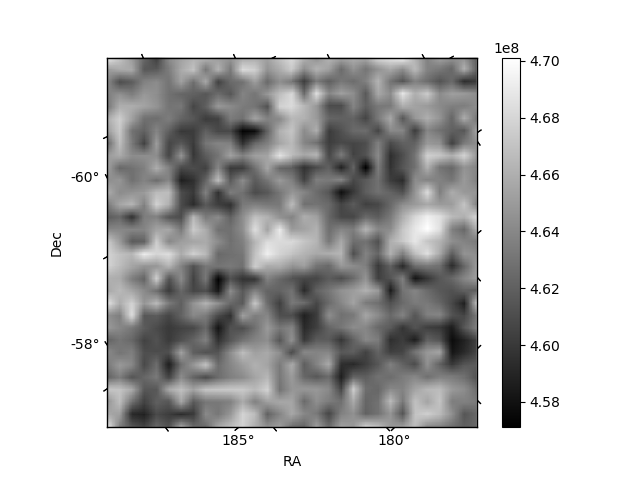
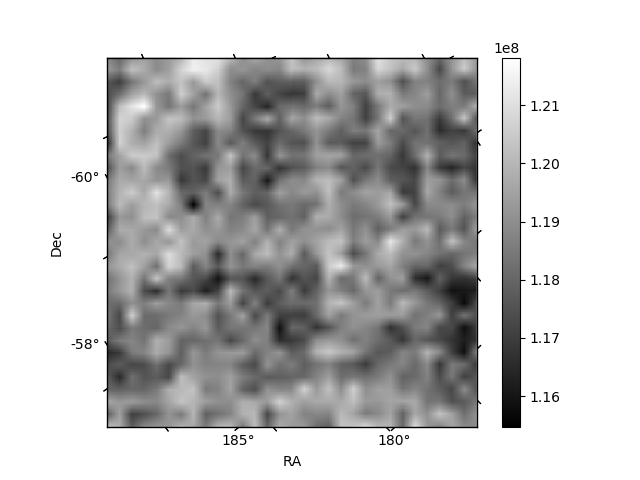
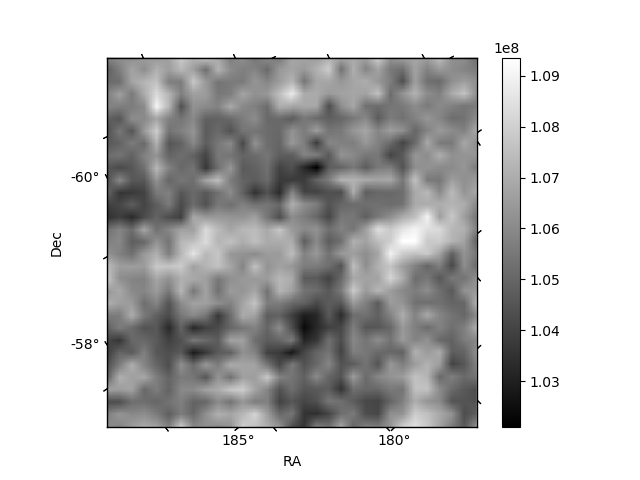
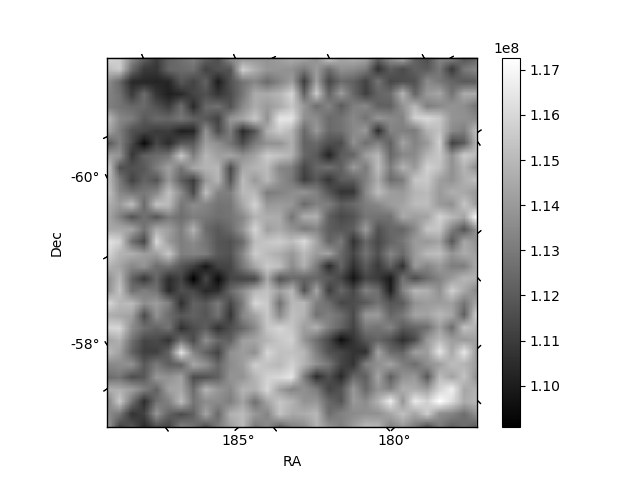
Histogram calculated using DETX and DETY for each event in the final _common_clean file
| Quadrant A | 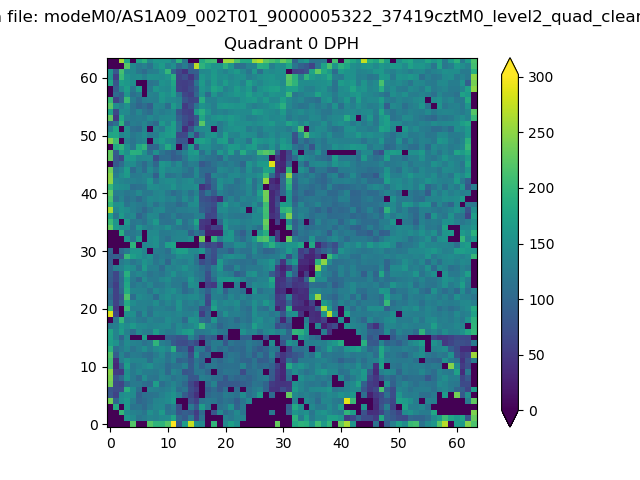 |
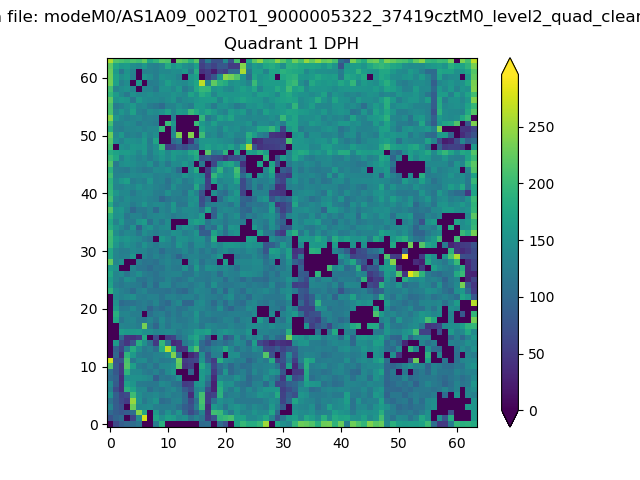 |
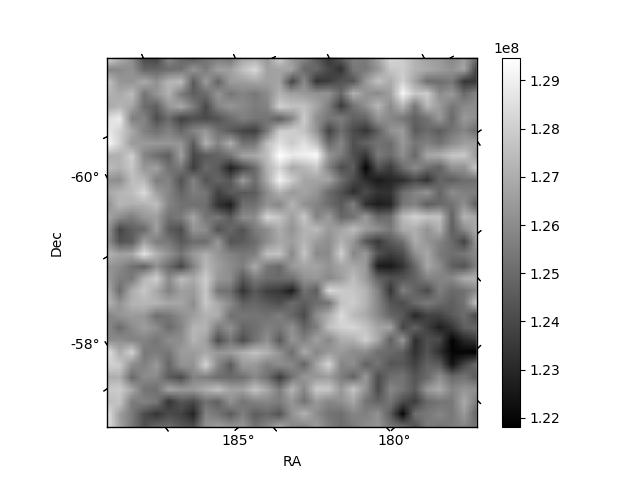
Quadrant B |
|---|---|---|---|
| Quadrant D | 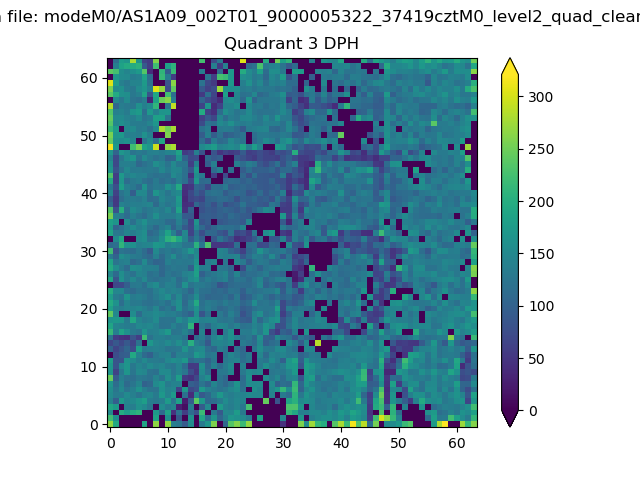 |
 |
Quadrant C |
| Plot type | Count rate plots | Images |
|---|---|---|
| Comparison with Poisson distribution Blue bars denote a histogram of data divided into 1 sec bins. Red curve is a Poisson curve with rate = median count rate of data. |
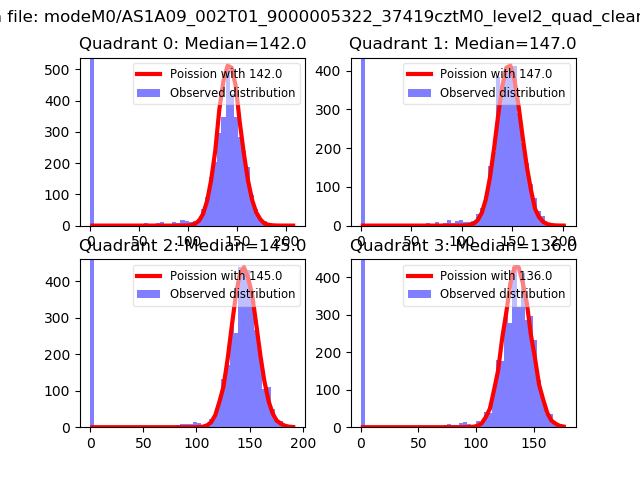 |
 |
| Quadrant-wise count rates Data is divided into 100 sec bins |
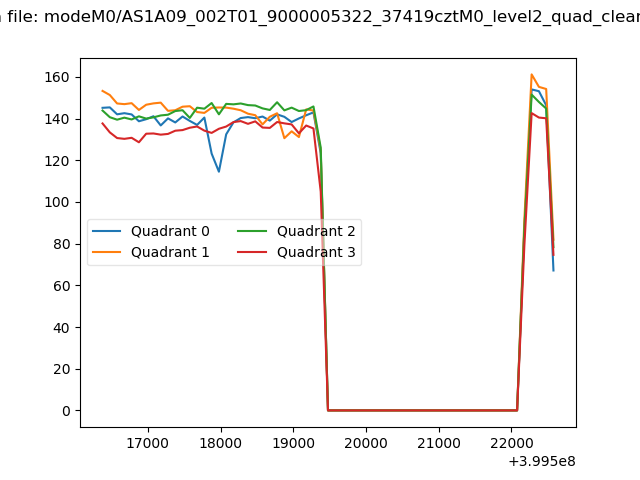 |
|
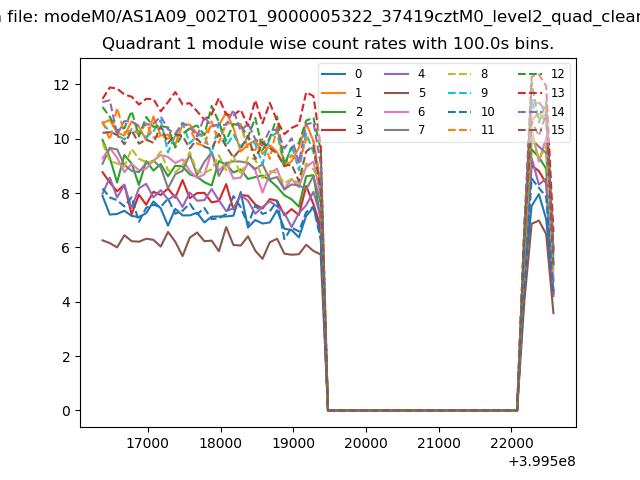
| Module-wise count rates for Quadrant A Data is divided into 100 sec bins |
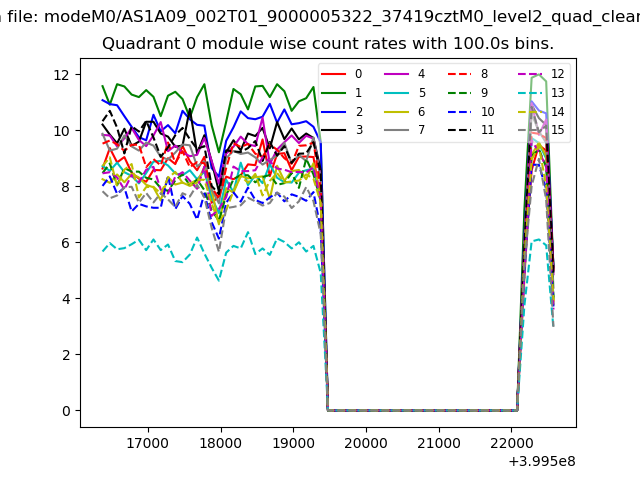 |
 |
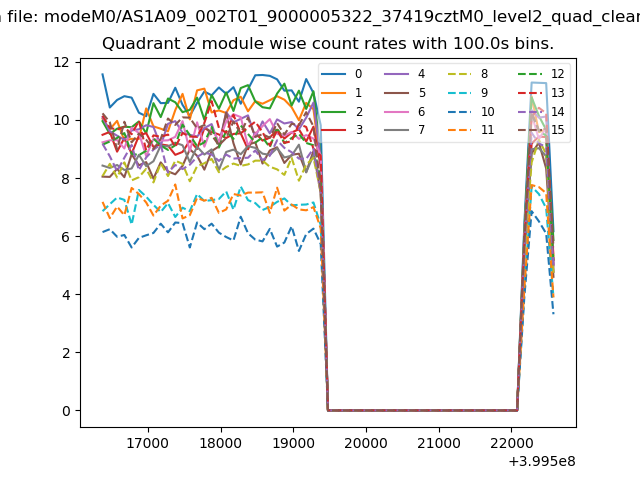
| Module-wise count rates for Quadrant B Data is divided into 100 sec bins |
 |
 |
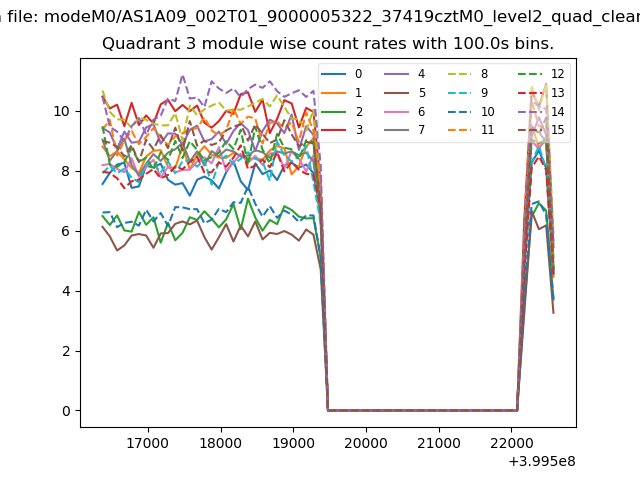
| Module-wise count rates for Quadrant C Data is divided into 100 sec bins |
 |
 |
| Module-wise count rates for Quadrant D Data is divided into 100 sec bins |
 |
 |
| Parameter | Plot |
|---|---|
| CZT HV Monitor |  |
| D_VDD | 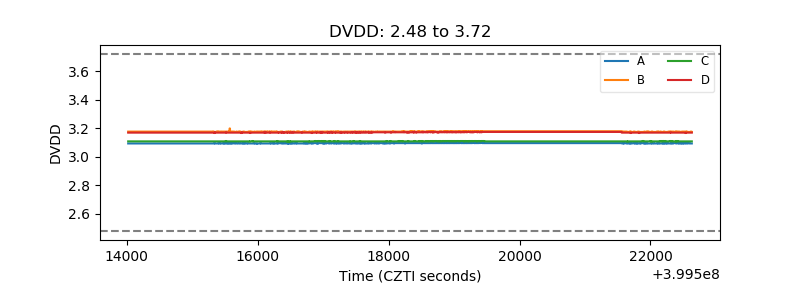 |
| Temperature 1 | 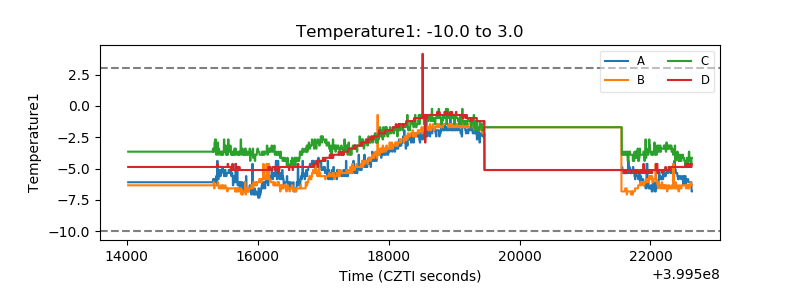 |
| Veto HV Monitor | 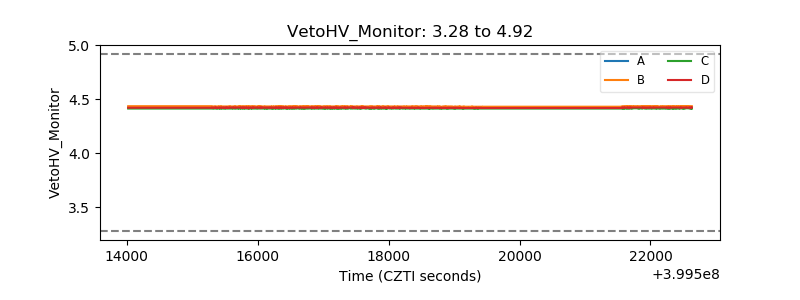 |
| Veto LLD | 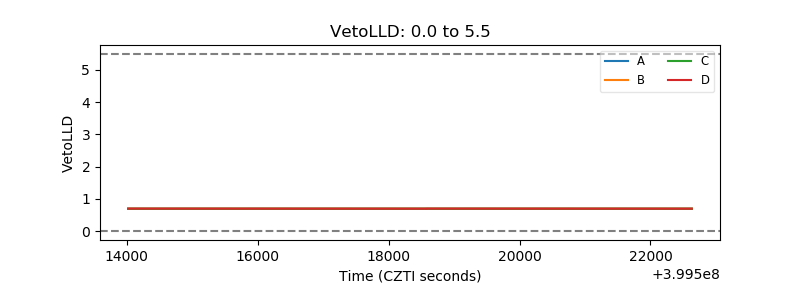 |
| Alpha Counter | 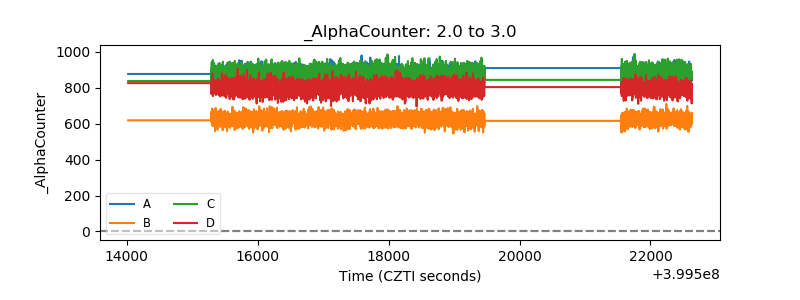 |
| _CPM_Rate | 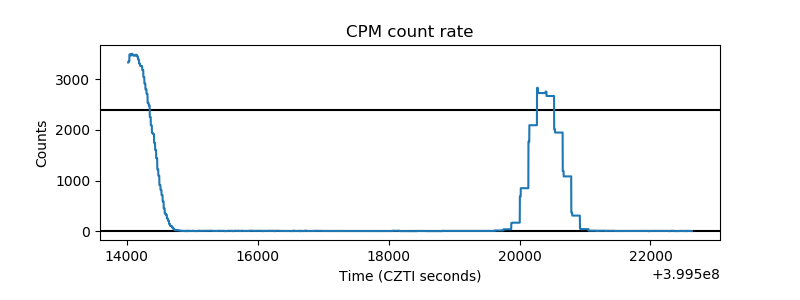 |
| CZT Counter | 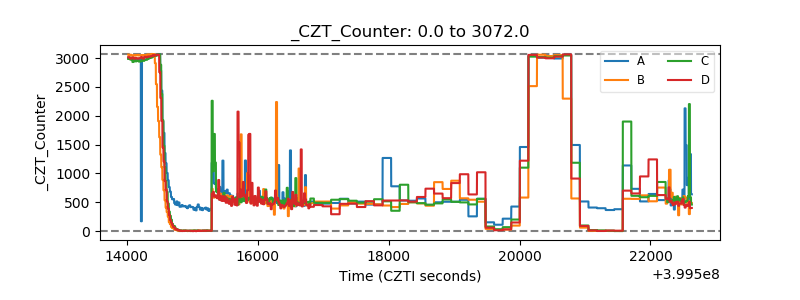 |
| +2.5 Volts monitor | 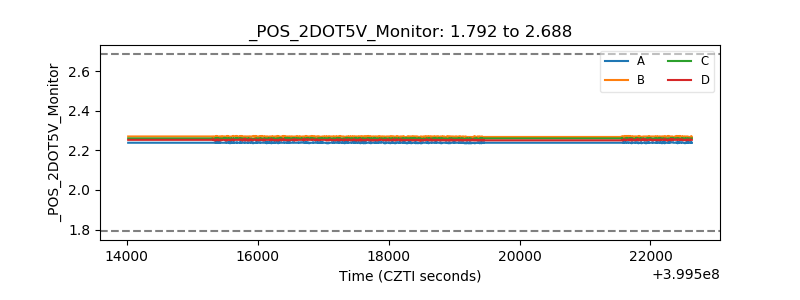 |
| +5 Volts monitor | 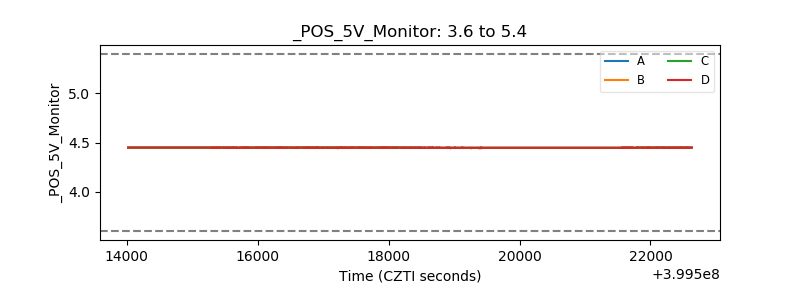 |
| _ROLL_ROT | 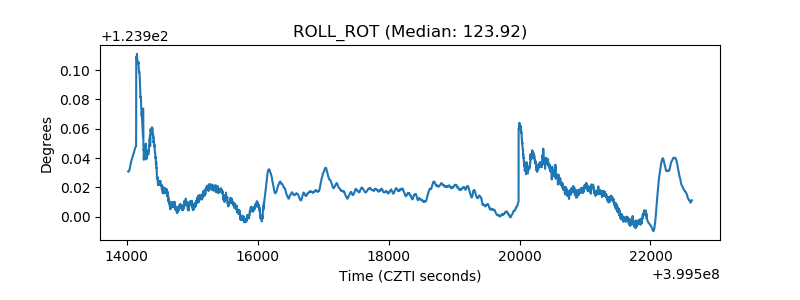 |
| _Roll_DEC | 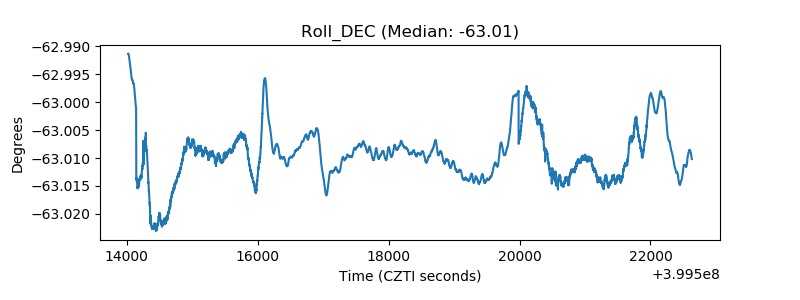 |
| _Roll_RA | 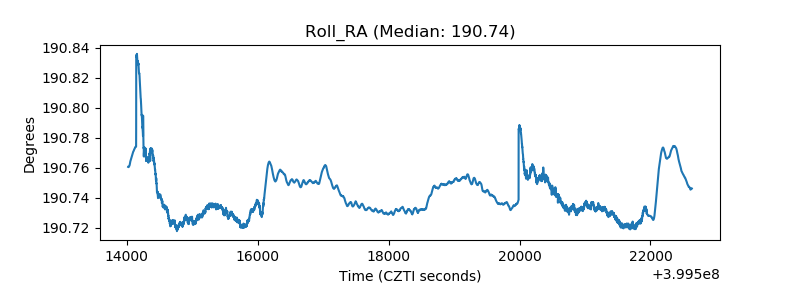 |
| Veto Counter | 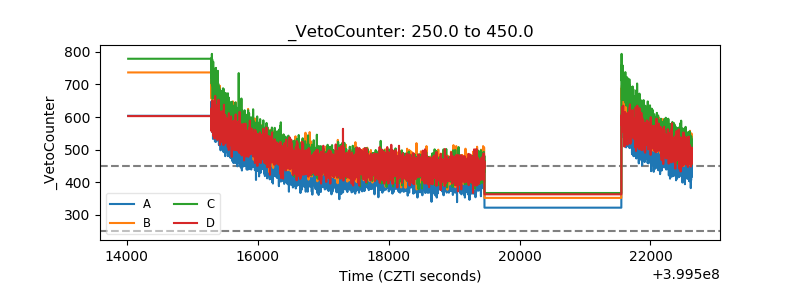 |