| Param | Original file | Final file |
|---|---|---|
| Filename | modeM0/AS1A09_002T01_9000005322_37420cztM0_level2.evt | modeM0/AS1A09_002T01_9000005322_37420cztM0_level2_quad_clean.evt |
| Size (bytes) | 394,090,560 | 87,171,840 |
| Size | 375.8 MB | 83.1 MB |
| Events in quadrant A | 2,894,470 | 571,940 |
| Events in quadrant B | 2,815,589 | 586,805 |
| Events in quadrant C | 2,929,153 | 583,276 |
| Events in quadrant D | 2,961,614 | 552,901 |
| Mode M0 | |||
|---|---|---|---|
| Quadrant | BADHDUFLAG | Total packets | Discarded packets |
| A | 0 | 11506 | 3 |
| B | 0 | 11296 | 2 |
| C | 0 | 11421 | 2 |
| D | 0 | 11852 | 2 |
| Mode M9 | |||
|---|---|---|---|
| Quadrant | BADHDUFLAG | Total packets | Discarded packets |
| A | 0 | 24 | 0 |
| B | 0 | 24 | 0 |
| C | 0 | 24 | 0 |
| D | 0 | 25 | 0 |
| Mode SS | |||
|---|---|---|---|
| Quadrant | BADHDUFLAG | Total packets | Discarded packets |
| A | 0 | 100 | 0 |
| B | 0 | 100 | 0 |
| C | 0 | 100 | 0 |
| D | 0 | 100 | 0 |
| Quadrant | Total seconds | Saturated seconds | Saturation percentage |
|---|---|---|---|
| A | 4920 | 46 | 0.934959% |
| B | 4920 | 51 | 1.036585% |
| C | 4920 | 78 | 1.585366% |
| D | 4920 | 29 | 0.589431% |
Noise dominated data is calculated using 1-second bins in cleaned event files. If a bin has >2000 counts, and if more than 50% of those come from <1% of pixels, then it is considered to be noise-dominated and hence unusable.
| Quadrant | # 1 sec bins | Bins with >0 counts | Bins with >2000 counts | High rate bins dominated by noise | Noise dominated (total time) | Noise dominated (detector-on time) | Marked lightcurve |
|---|---|---|---|---|---|---|---|
| A | 7073 | 4921 | 19 | 19 | 0.27% | 0.39% | 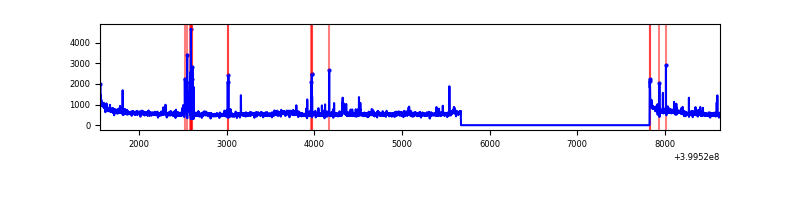 |
| B | 7073 | 4921 | 28 | 28 | 0.40% | 0.57% | 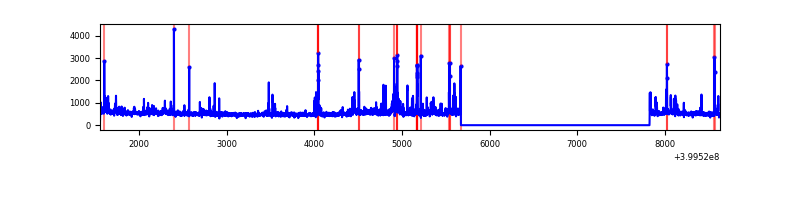 |
| C | 7073 | 4921 | 65 | 65 | 0.92% | 1.32% | 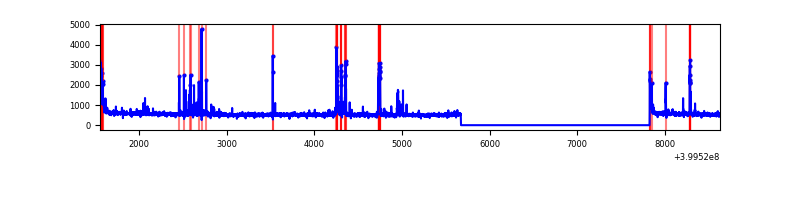 |
| D | 7073 | 4921 | 27 | 27 | 0.38% | 0.55% | 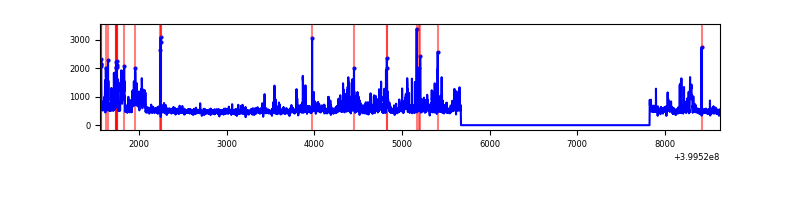 |
Top three noisy pixels from each quadrant. If the there are fewer than three noisy pixels in the level2.evt file, extra rows are filled as -1
| Pixel properties | Quadrant properties | ||||||
|---|---|---|---|---|---|---|---|
| Quadrant | DetID | PixID | Counts | Sigma | Mean | Median | Sigma |
| A | 10 | 83 | 264549 | 2184.8 | 610 | 601 | 120.8 |
| A | 15 | 222 | 100984 | 830.91 | 610 | 601 | 120.8 |
| A | 12 | 189 | 93714 | 770.73 | 610 | 601 | 120.8 |
| B | 5 | 255 | 151386 | 1355.64 | 608 | 594 | 111.2 |
| B | 5 | 172 | 118810 | 1062.78 | 608 | 594 | 111.2 |
| B | 0 | 155 | 52509 | 466.72 | 608 | 594 | 111.2 |
| C | 14 | 254 | 244467 | 1752.21 | 606 | 612 | 139.2 |
| C | 15 | 214 | 211049 | 1512.09 | 606 | 612 | 139.2 |
| C | 0 | 10 | 86006 | 613.6 | 606 | 612 | 139.2 |
| D | 12 | 227 | 204977 | 1410.72 | 604 | 590 | 144.9 |
| D | 12 | 235 | 168514 | 1159.04 | 604 | 590 | 144.9 |
| D | 2 | 250 | 68805 | 470.83 | 604 | 590 | 144.9 |
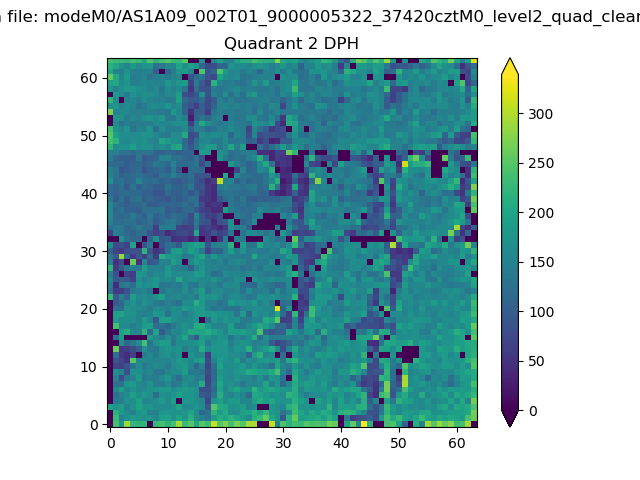
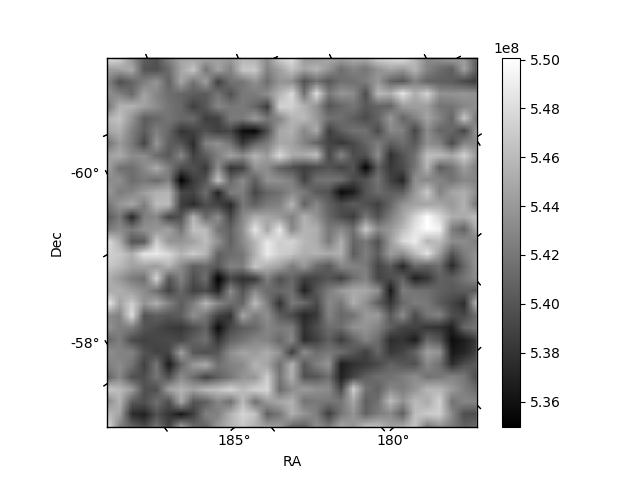
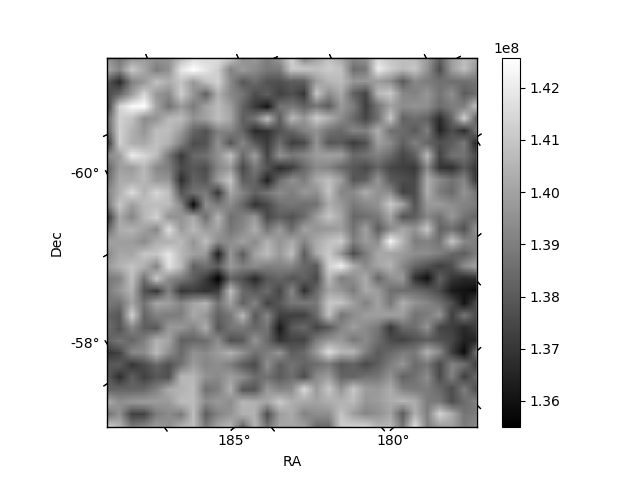
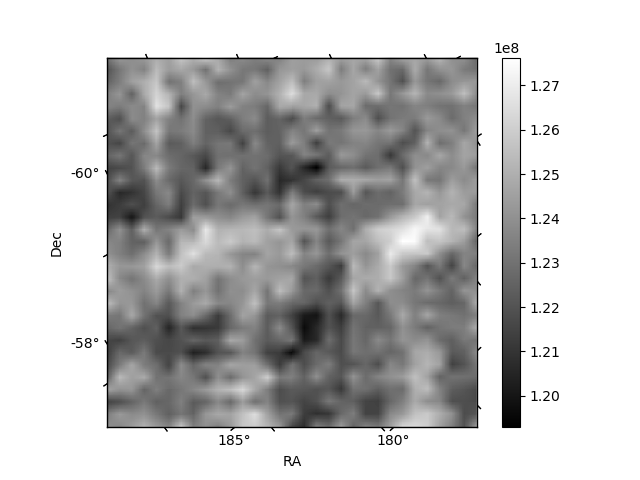
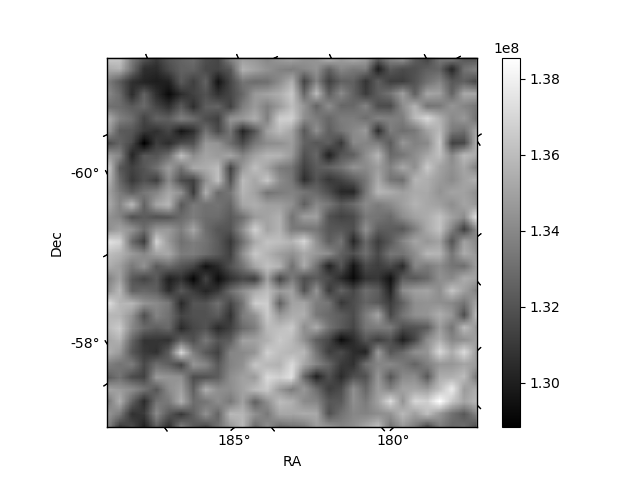
Histogram calculated using DETX and DETY for each event in the final _common_clean file
| Quadrant A | 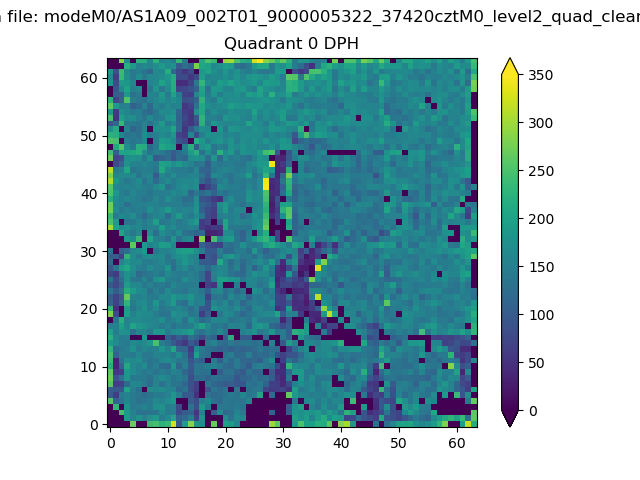 |
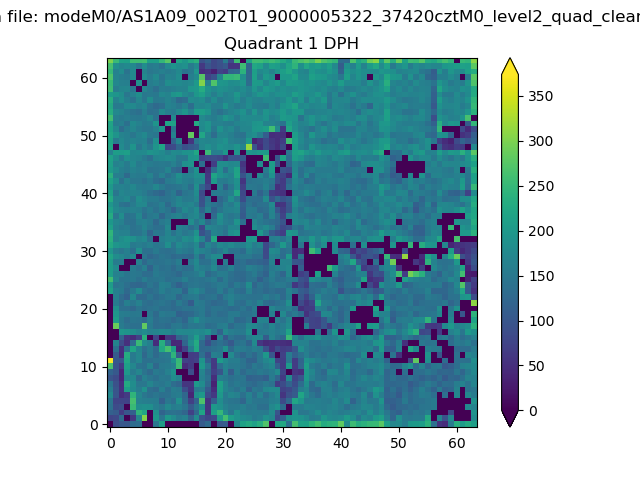 |
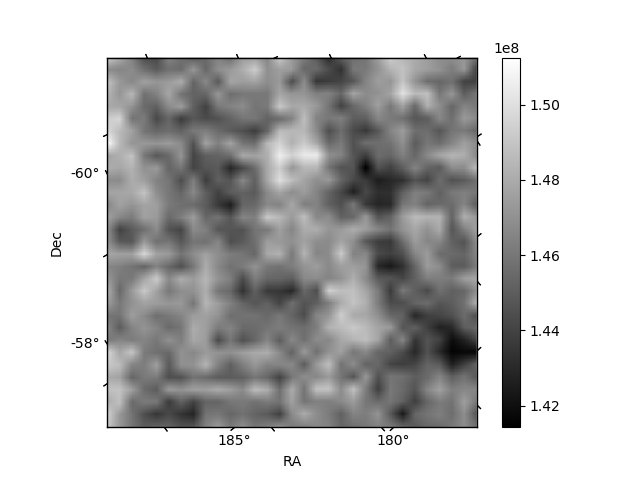
Quadrant B |
|---|---|---|---|
| Quadrant D | 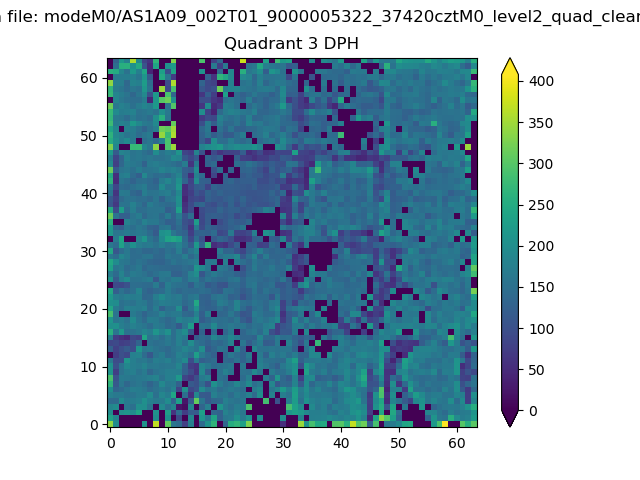 |
 |
Quadrant C |
| Plot type | Count rate plots | Images |
|---|---|---|
| Comparison with Poisson distribution Blue bars denote a histogram of data divided into 1 sec bins. Red curve is a Poisson curve with rate = median count rate of data. |
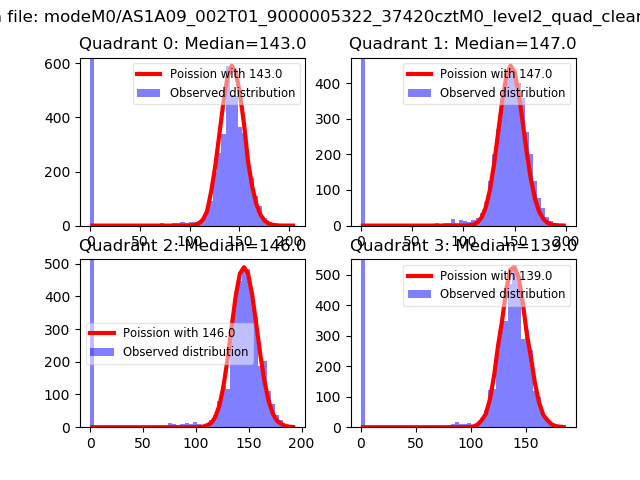 |
 |
| Quadrant-wise count rates Data is divided into 100 sec bins |
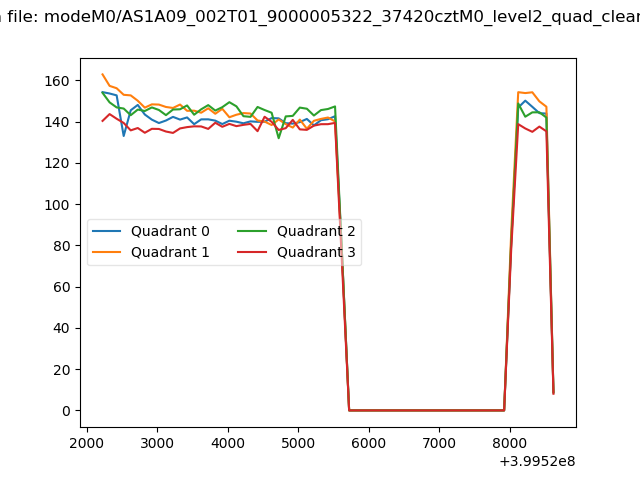 |
|
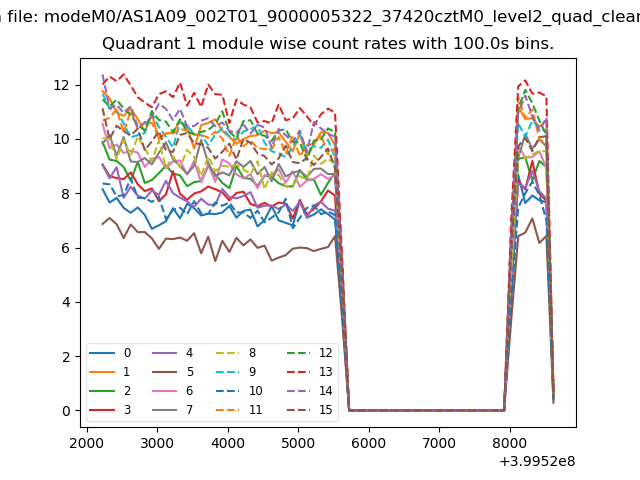
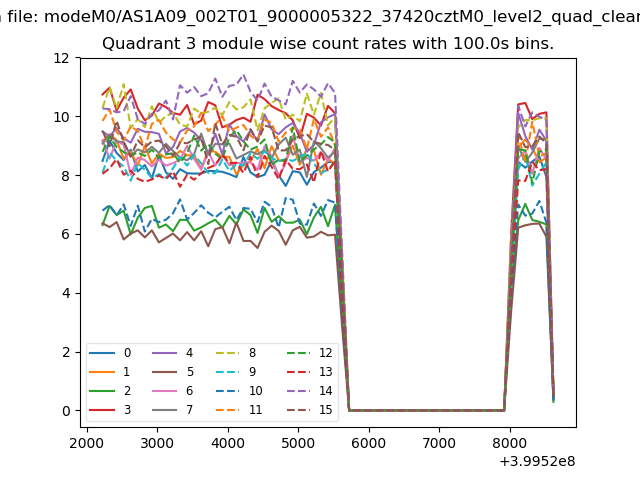
| Module-wise count rates for Quadrant A Data is divided into 100 sec bins |
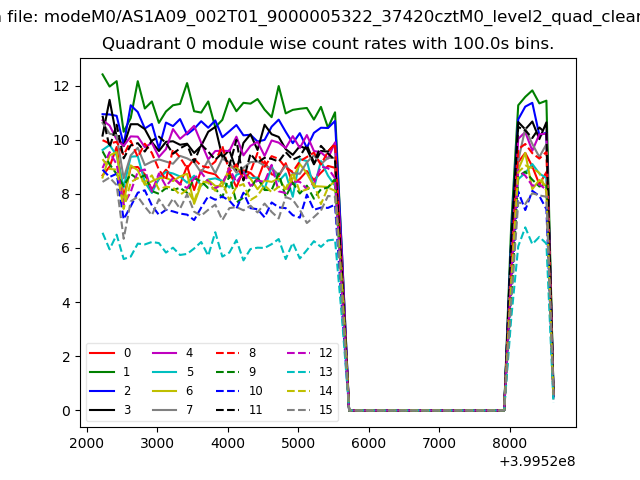 |
 |
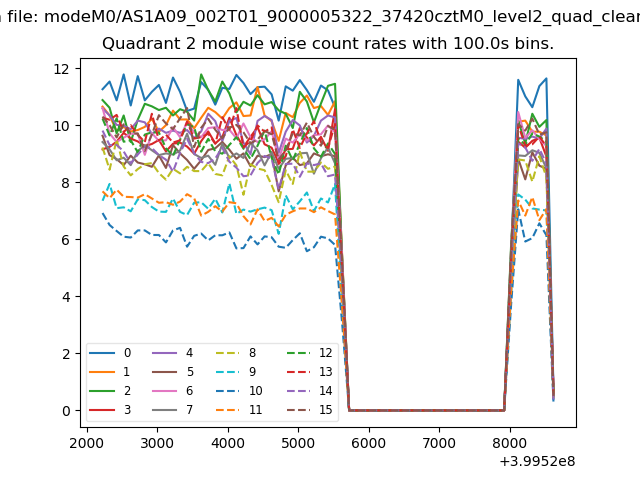
| Module-wise count rates for Quadrant B Data is divided into 100 sec bins |
 |
 |
| Module-wise count rates for Quadrant C Data is divided into 100 sec bins |
 |
 |
| Module-wise count rates for Quadrant D Data is divided into 100 sec bins |
 |
 |
| Parameter | Plot |
|---|---|
| CZT HV Monitor |  |
| D_VDD | 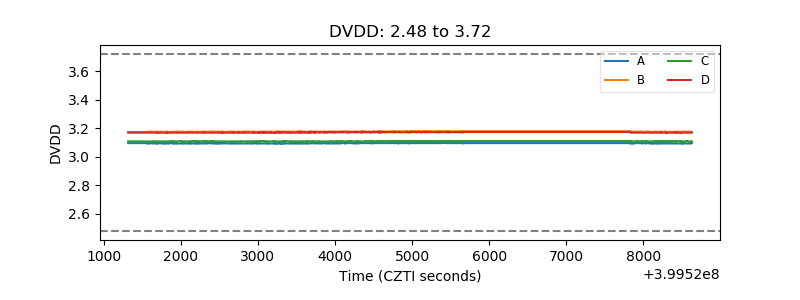 |
| Temperature 1 | 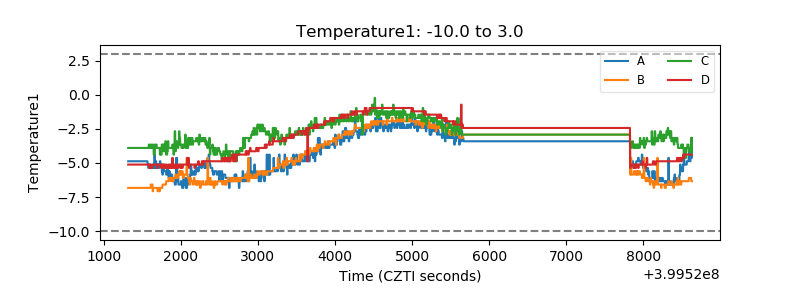 |
| Veto HV Monitor | 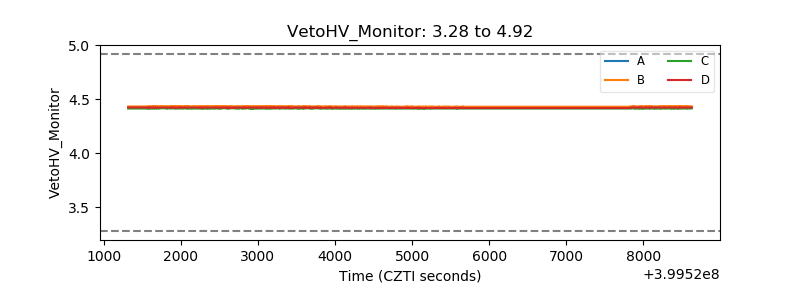 |
| Veto LLD | 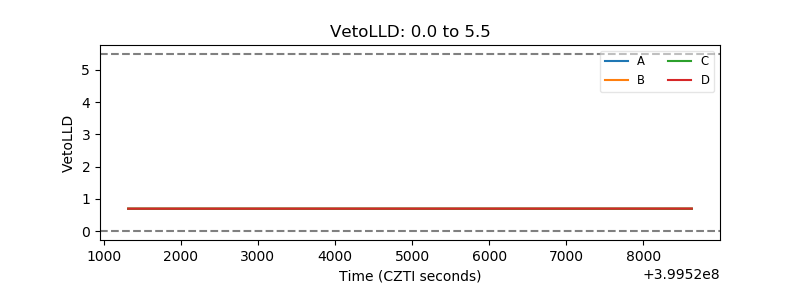 |
| Alpha Counter | 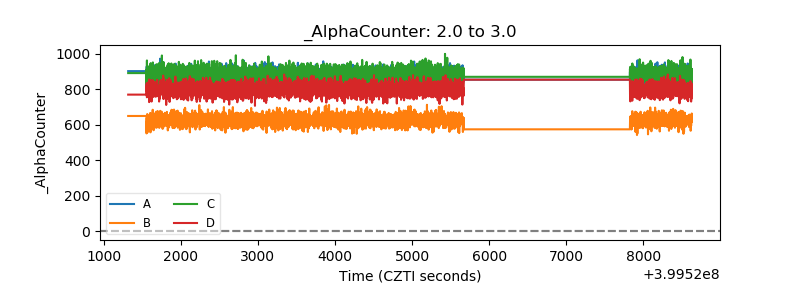 |
| _CPM_Rate | 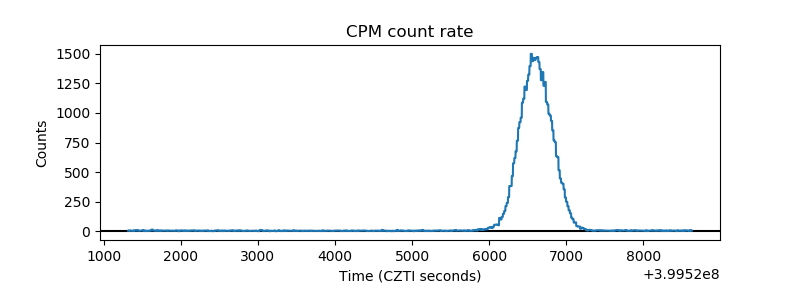 |
| CZT Counter | 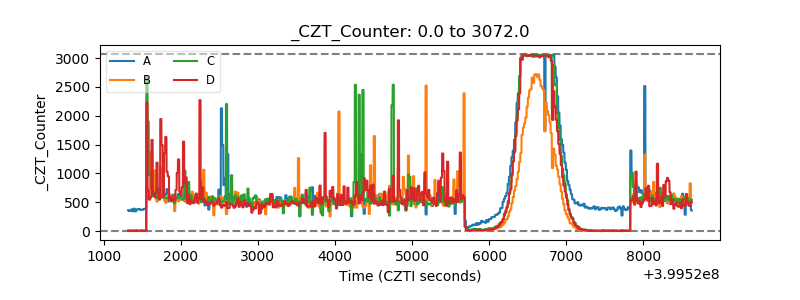 |
| +2.5 Volts monitor | 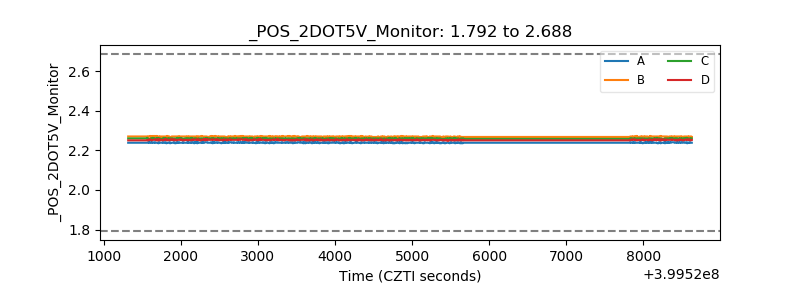 |
| +5 Volts monitor | 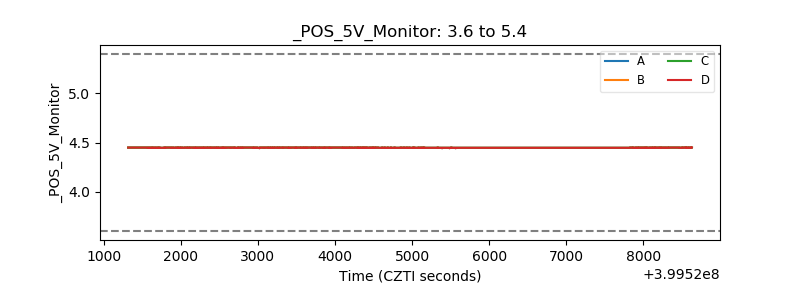 |
| _ROLL_ROT | 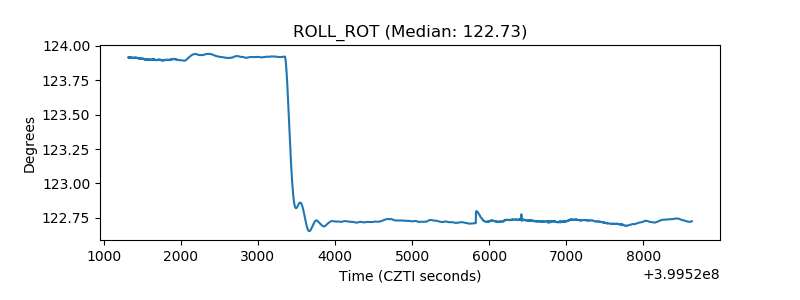 |
| _Roll_DEC | 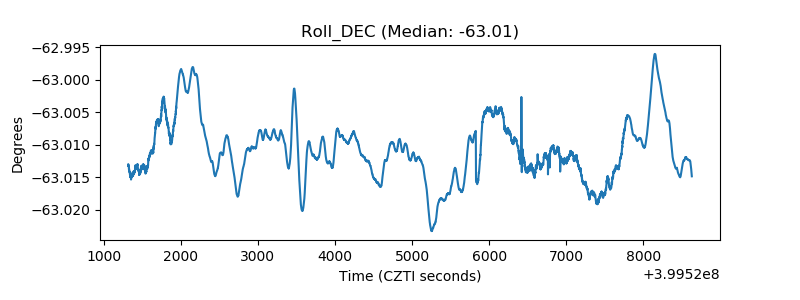 |
| _Roll_RA | 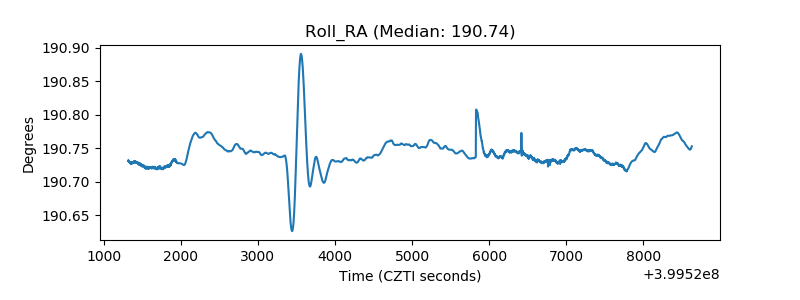 |
| Veto Counter | 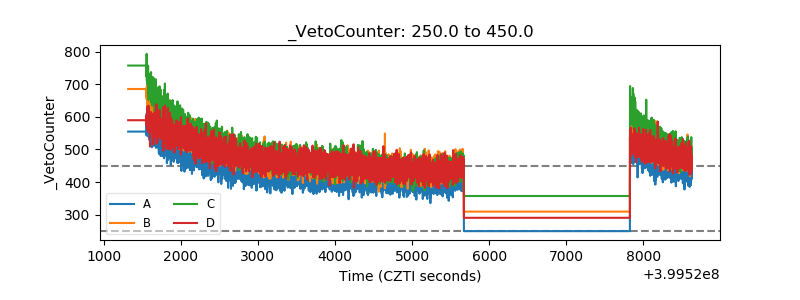 |