| Param | Original file | Final file |
|---|---|---|
| Filename | modeM0/AS1A09_002T01_9000005322_37421cztM0_level2.evt | modeM0/AS1A09_002T01_9000005322_37421cztM0_level2_quad_clean.evt |
| Size (bytes) | 449,444,160 | 96,454,080 |
| Size | 428.6 MB | 92.0 MB |
| Events in quadrant A | 2,879,413 | 648,424 |
| Events in quadrant B | 3,113,354 | 661,299 |
| Events in quadrant C | 2,786,558 | 664,199 |
| Events in quadrant D | 4,491,868 | 595,702 |
| Mode M0 | |||
|---|---|---|---|
| Quadrant | BADHDUFLAG | Total packets | Discarded packets |
| A | 0 | 11519 | 3 |
| B | 0 | 12358 | 2 |
| C | 0 | 11070 | 2 |
| D | 0 | 16551 | 2 |
| Mode M9 | |||
|---|---|---|---|
| Quadrant | BADHDUFLAG | Total packets | Discarded packets |
| A | 0 | 30 | 0 |
| B | 0 | 30 | 0 |
| C | 0 | 30 | 0 |
| D | 0 | 31 | 0 |
| Mode SS | |||
|---|---|---|---|
| Quadrant | BADHDUFLAG | Total packets | Discarded packets |
| A | 0 | 102 | 0 |
| B | 0 | 102 | 0 |
| C | 0 | 102 | 0 |
| D | 0 | 102 | 0 |
| Quadrant | Total seconds | Saturated seconds | Saturation percentage |
|---|---|---|---|
| A | 5011 | 80 | 1.596488% |
| B | 5011 | 138 | 2.753941% |
| C | 5011 | 60 | 1.197366% |
| D | 5011 | 627 | 12.512473% |
Noise dominated data is calculated using 1-second bins in cleaned event files. If a bin has >2000 counts, and if more than 50% of those come from <1% of pixels, then it is considered to be noise-dominated and hence unusable.
| Quadrant | # 1 sec bins | Bins with >0 counts | Bins with >2000 counts | High rate bins dominated by noise | Noise dominated (total time) | Noise dominated (detector-on time) | Marked lightcurve |
|---|---|---|---|---|---|---|---|
| A | 7134 | 5012 | 59 | 59 | 0.83% | 1.18% | 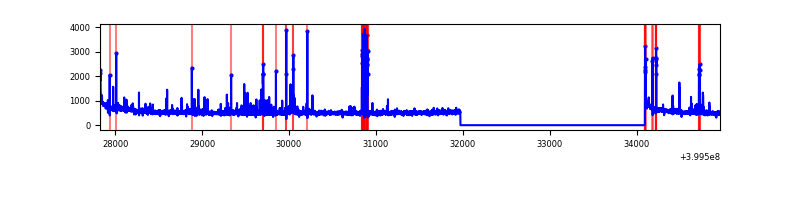 |
| B | 7134 | 5012 | 91 | 91 | 1.28% | 1.82% | 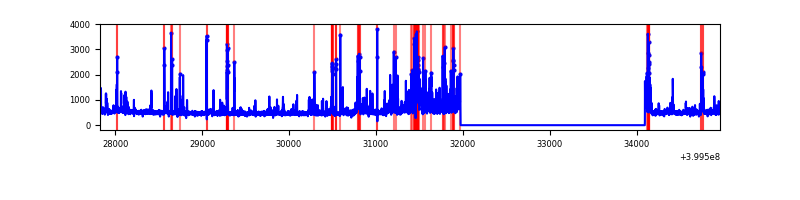 |
| C | 7134 | 5012 | 55 | 55 | 0.77% | 1.10% | 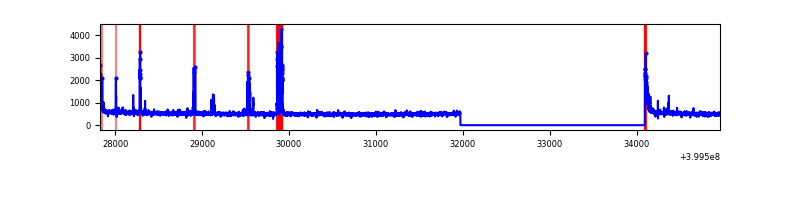 |
| D | 7134 | 5012 | 600 | 600 | 8.41% | 11.97% | 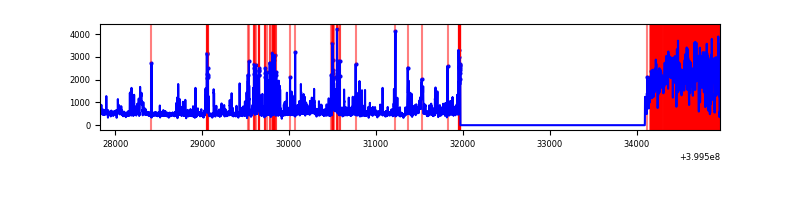 |
Top three noisy pixels from each quadrant. If the there are fewer than three noisy pixels in the level2.evt file, extra rows are filled as -1
| Pixel properties | Quadrant properties | ||||||
|---|---|---|---|---|---|---|---|
| Quadrant | DetID | PixID | Counts | Sigma | Mean | Median | Sigma |
| A | 10 | 83 | 269389 | 2264.76 | 595 | 585 | 118.7 |
| A | 6 | 10 | 150541 | 1263.43 | 595 | 585 | 118.7 |
| A | 15 | 222 | 101835 | 853.07 | 595 | 585 | 118.7 |
| B | 5 | 255 | 576755 | 5246.72 | 591 | 577 | 109.8 |
| B | 5 | 172 | 83285 | 753.14 | 591 | 577 | 109.8 |
| B | 5 | 200 | 74485 | 673.01 | 591 | 577 | 109.8 |
| C | 15 | 214 | 216185 | 1588.21 | 589 | 594 | 135.7 |
| C | 14 | 254 | 179448 | 1317.57 | 589 | 594 | 135.7 |
| C | 0 | 10 | 81293 | 594.49 | 589 | 594 | 135.7 |
| D | 10 | 253 | 1543230 | 11279.12 | 568 | 553 | 136.8 |
| D | 12 | 227 | 186266 | 1357.82 | 568 | 553 | 136.8 |
| D | 13 | 249 | 182480 | 1330.14 | 568 | 553 | 136.8 |
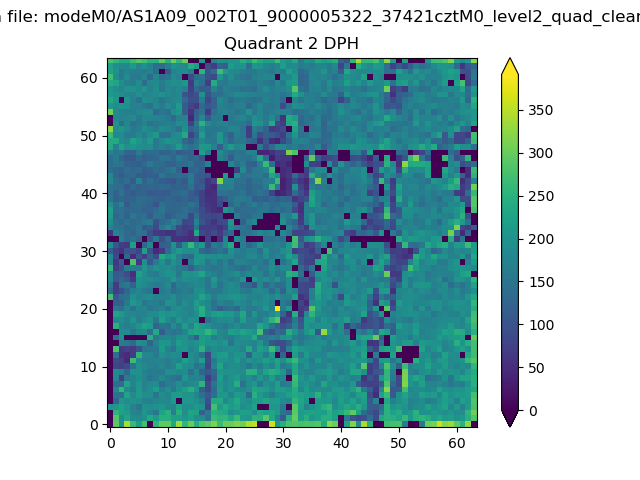
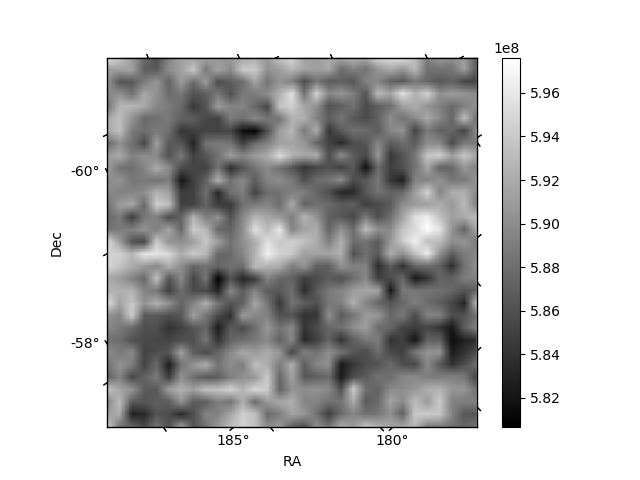
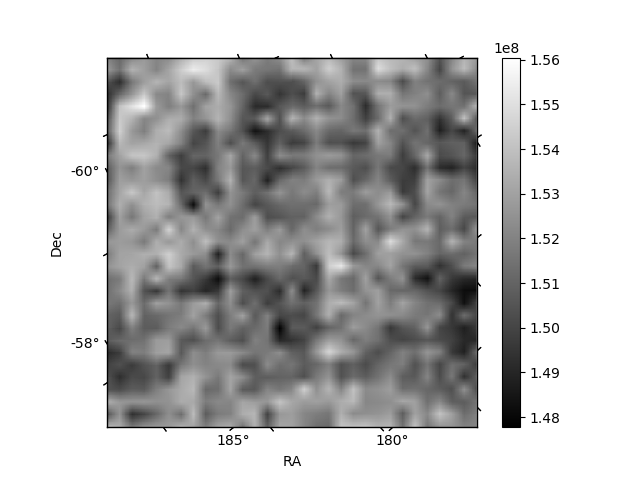
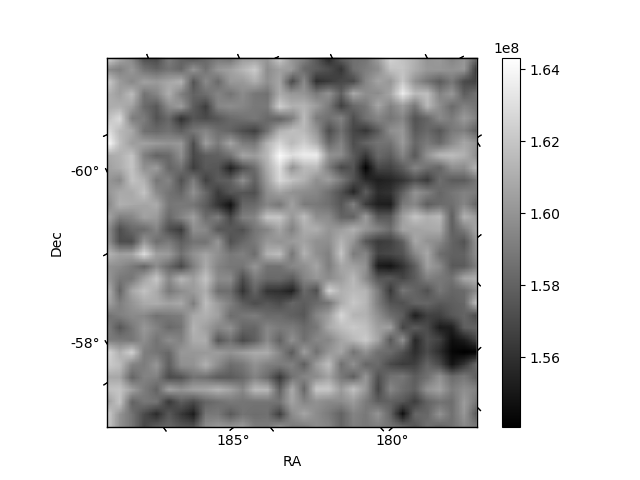
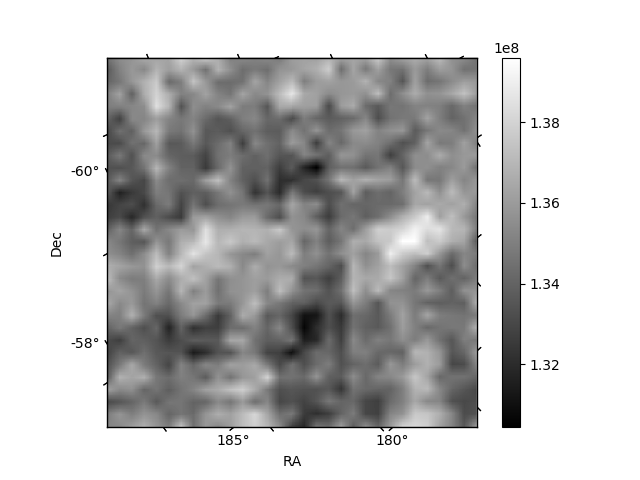
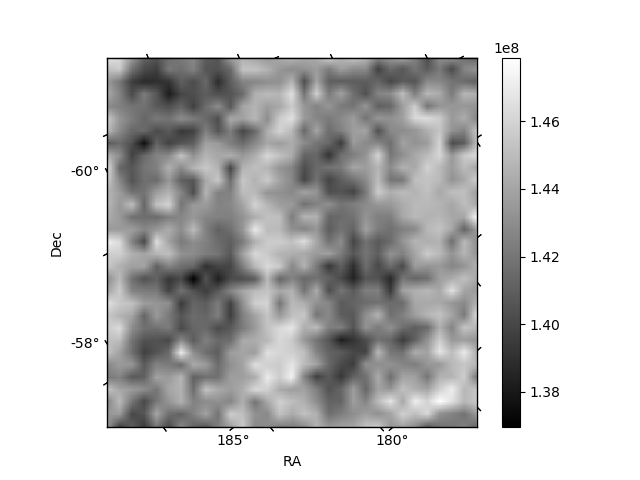
Histogram calculated using DETX and DETY for each event in the final _common_clean file
| Quadrant A | 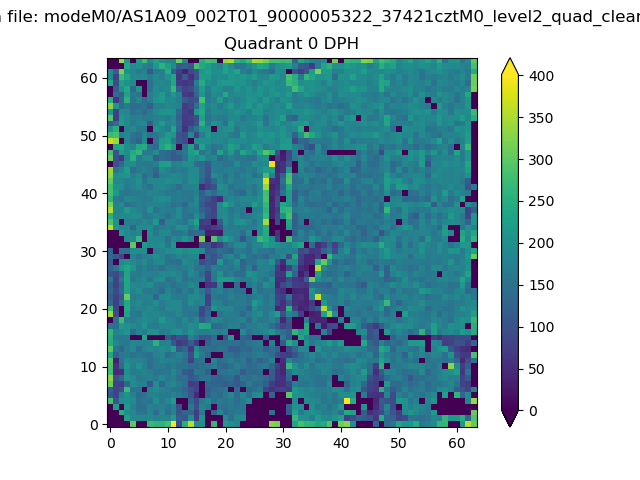 |
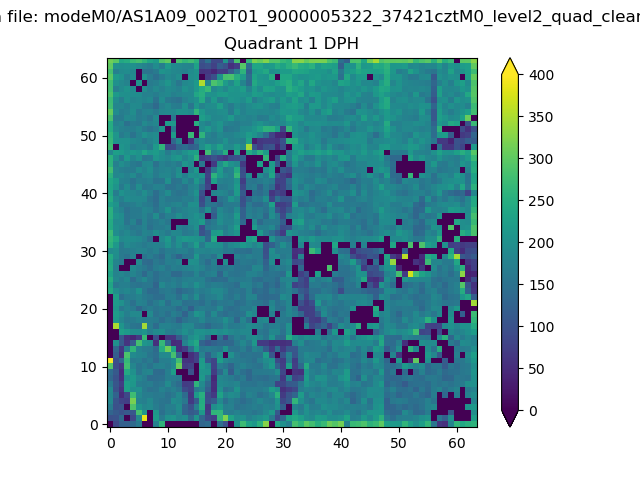 |
Quadrant B |
|---|---|---|---|
| Quadrant D | 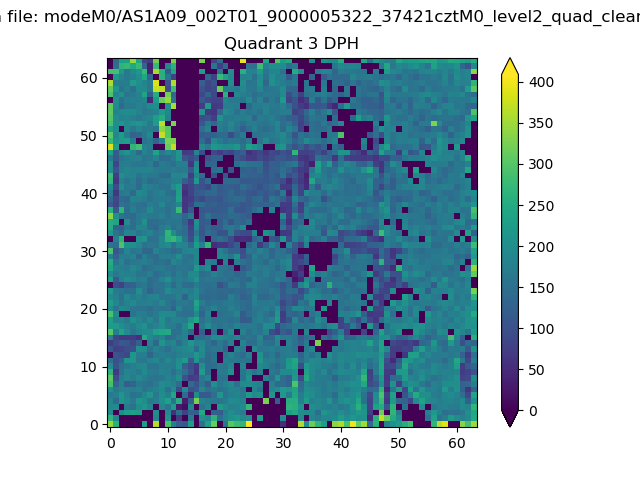 |
 |
Quadrant C |
| Plot type | Count rate plots | Images |
|---|---|---|
| Comparison with Poisson distribution Blue bars denote a histogram of data divided into 1 sec bins. Red curve is a Poisson curve with rate = median count rate of data. |
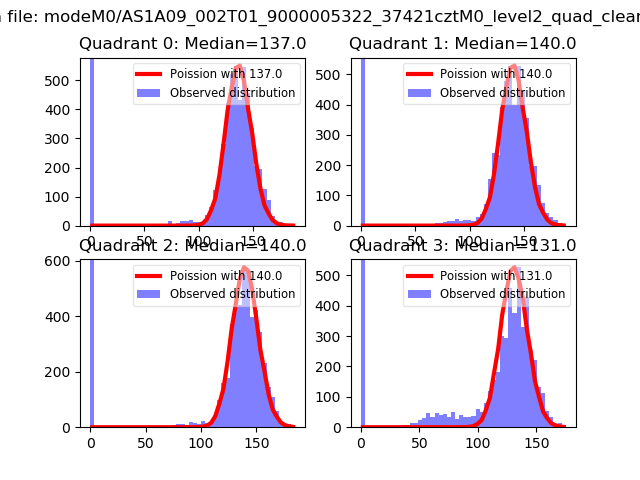 |
 |
| Quadrant-wise count rates Data is divided into 100 sec bins |
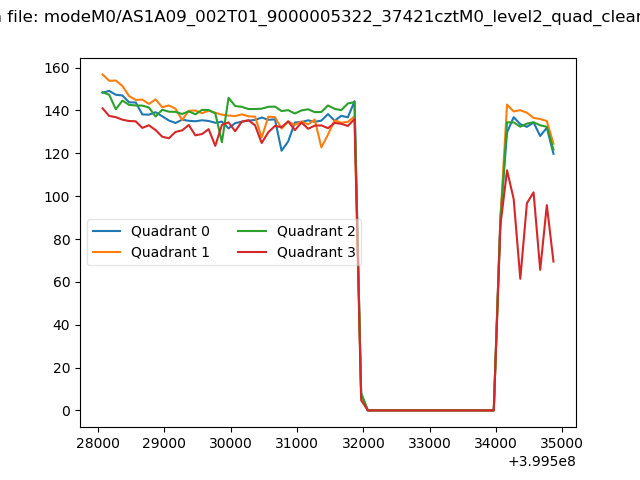 |
|
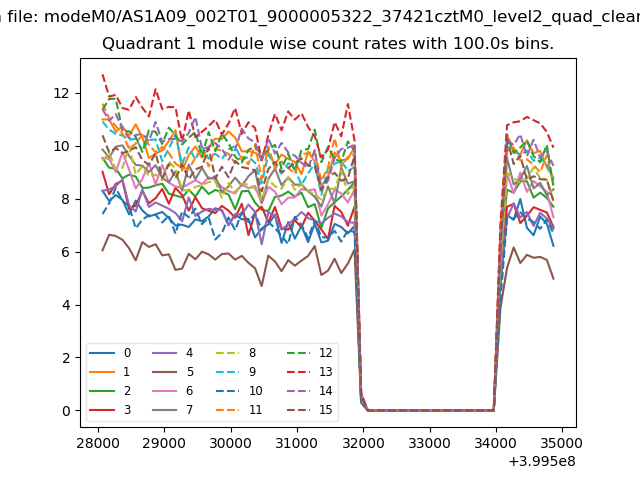
| Module-wise count rates for Quadrant A Data is divided into 100 sec bins |
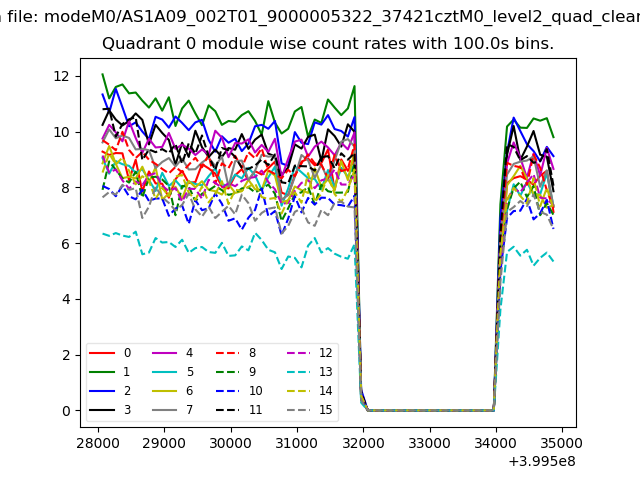 |
 |
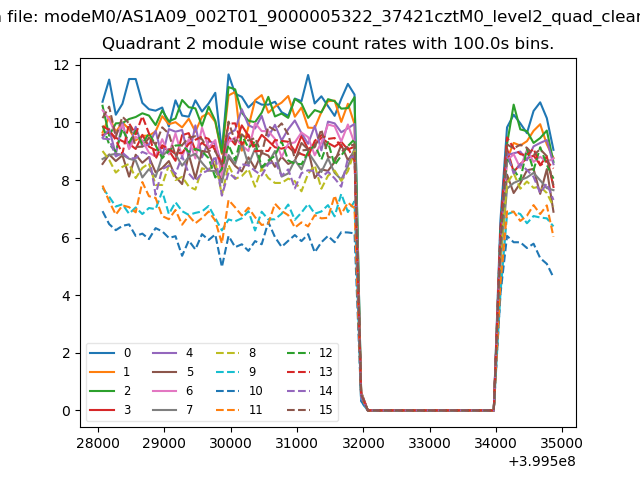
| Module-wise count rates for Quadrant B Data is divided into 100 sec bins |
 |
 |
| Module-wise count rates for Quadrant C Data is divided into 100 sec bins |
 |
 |
| Module-wise count rates for Quadrant D Data is divided into 100 sec bins |
 |
 |
| Parameter | Plot |
|---|---|
| CZT HV Monitor | 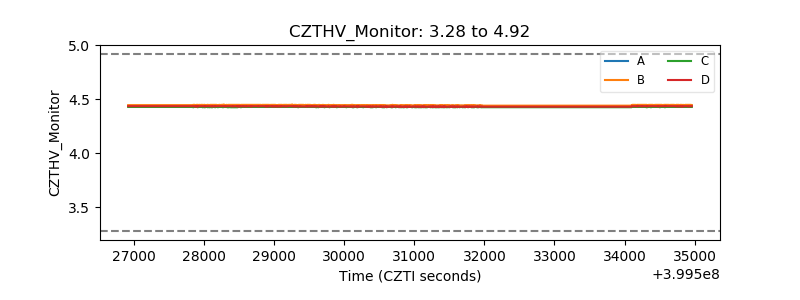 |
| D_VDD | 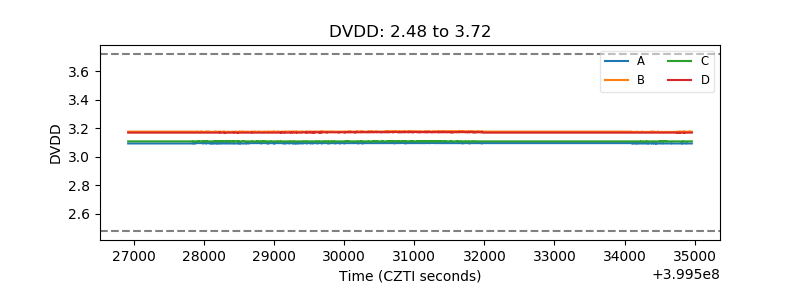 |
| Temperature 1 | 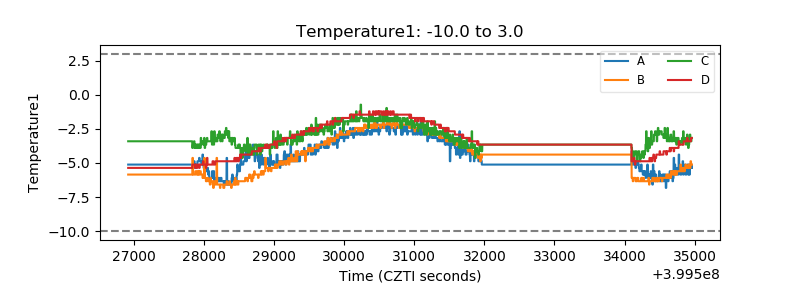 |
| Veto HV Monitor | 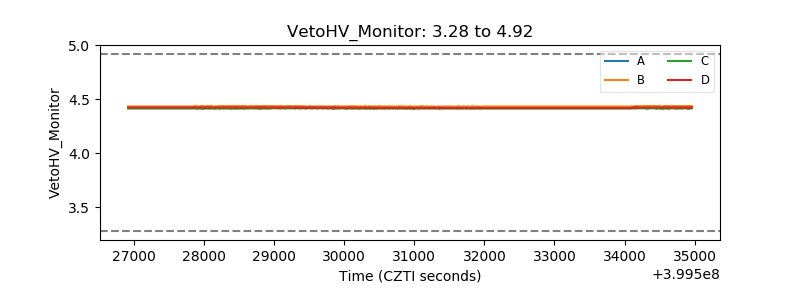 |
| Veto LLD | 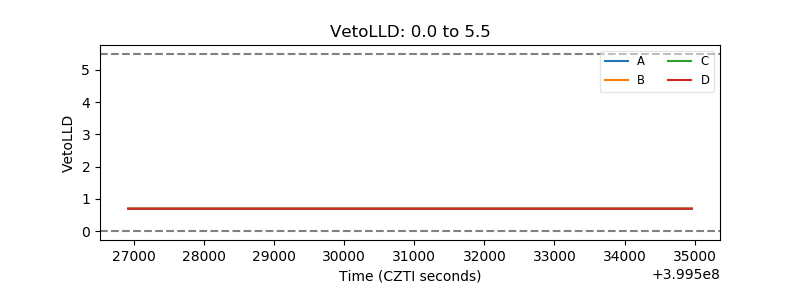 |
| Alpha Counter | 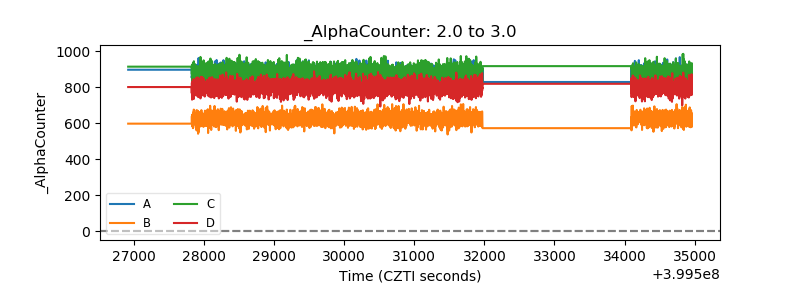 |
| _CPM_Rate | 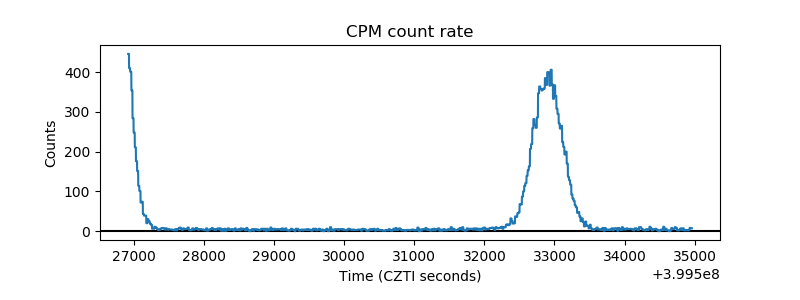 |
| CZT Counter | 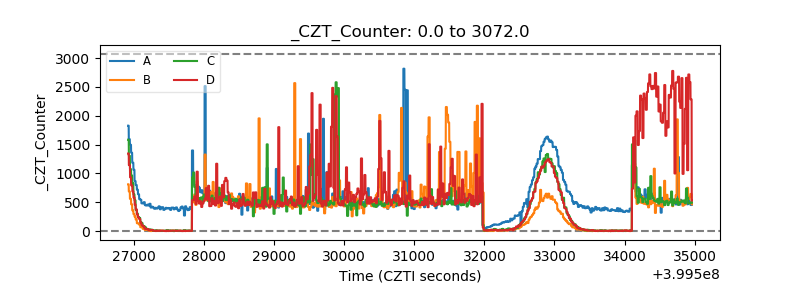 |
| +2.5 Volts monitor | 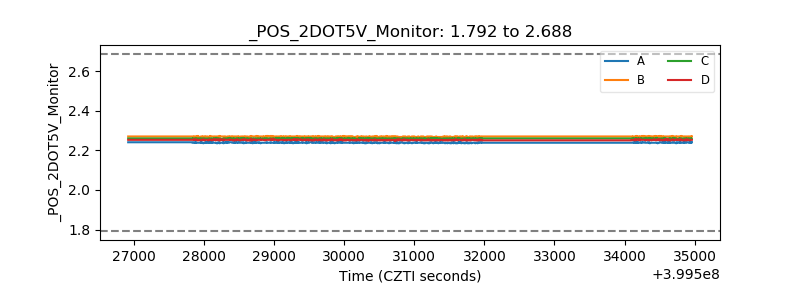 |
| +5 Volts monitor | 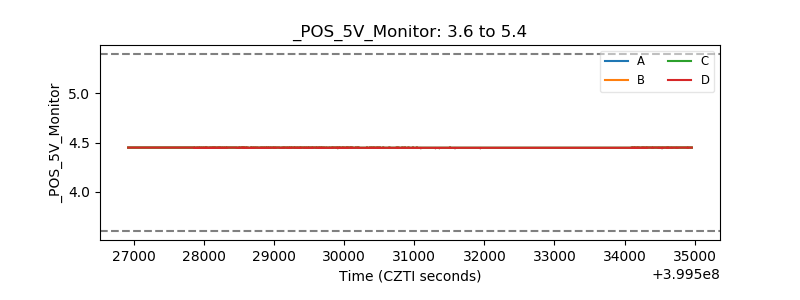 |
| _ROLL_ROT |  |
| _Roll_DEC | 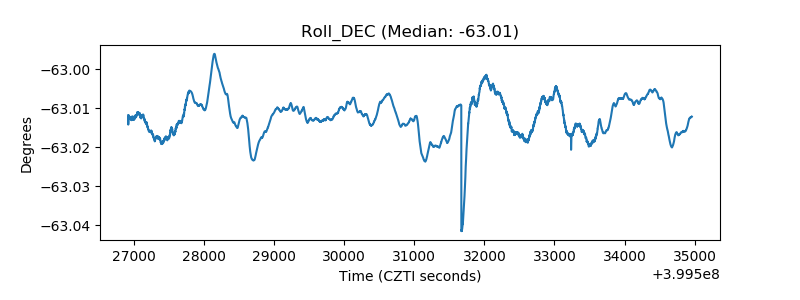 |
| _Roll_RA | 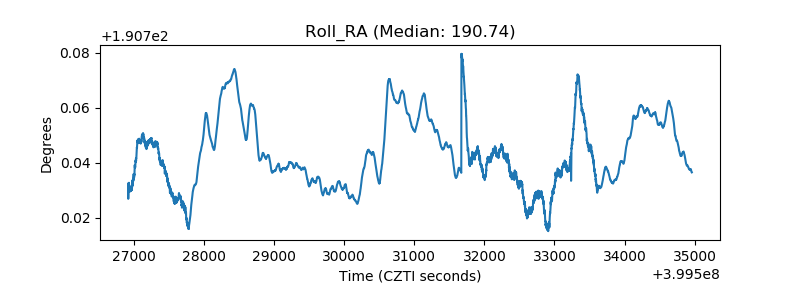 |
| Veto Counter | 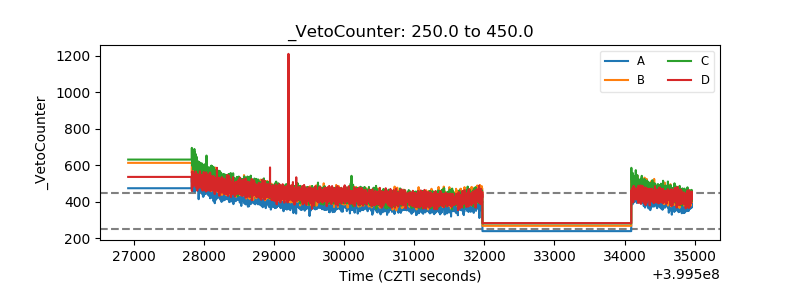 |