| Param | Original file | Final file |
|---|---|---|
| Filename | modeM0/AS1A09_002T01_9000005322_37422cztM0_level2.evt | modeM0/AS1A09_002T01_9000005322_37422cztM0_level2_quad_clean.evt |
| Size (bytes) | 432,498,240 | 92,712,960 |
| Size | 412.5 MB | 88.4 MB |
| Events in quadrant A | 2,642,757 | 620,809 |
| Events in quadrant B | 2,547,294 | 633,259 |
| Events in quadrant C | 2,433,000 | 641,476 |
| Events in quadrant D | 5,141,409 | 567,218 |
| Mode M0 | |||
|---|---|---|---|
| Quadrant | BADHDUFLAG | Total packets | Discarded packets |
| A | 0 | 10803 | 2 |
| B | 0 | 10788 | 1 |
| C | 0 | 10073 | 1 |
| D | 0 | 18656 | 1 |
| Mode M9 | |||
|---|---|---|---|
| Quadrant | BADHDUFLAG | Total packets | Discarded packets |
| A | 0 | 19 | 0 |
| B | 0 | 19 | 0 |
| C | 0 | 19 | 0 |
| D | 0 | 19 | 0 |
| Mode SS | |||
|---|---|---|---|
| Quadrant | BADHDUFLAG | Total packets | Discarded packets |
| A | 0 | 102 | 0 |
| B | 0 | 102 | 0 |
| C | 0 | 102 | 0 |
| D | 0 | 102 | 0 |
| Quadrant | Total seconds | Saturated seconds | Saturation percentage |
|---|---|---|---|
| A | 4909 | 49 | 0.998167% |
| B | 4909 | 58 | 1.181503% |
| C | 4909 | 5 | 0.101854% |
| D | 4909 | 629 | 12.813200% |
Noise dominated data is calculated using 1-second bins in cleaned event files. If a bin has >2000 counts, and if more than 50% of those come from <1% of pixels, then it is considered to be noise-dominated and hence unusable.
| Quadrant | # 1 sec bins | Bins with >0 counts | Bins with >2000 counts | High rate bins dominated by noise | Noise dominated (total time) | Noise dominated (detector-on time) | Marked lightcurve |
|---|---|---|---|---|---|---|---|
| A | 6852 | 4910 | 35 | 35 | 0.51% | 0.71% | 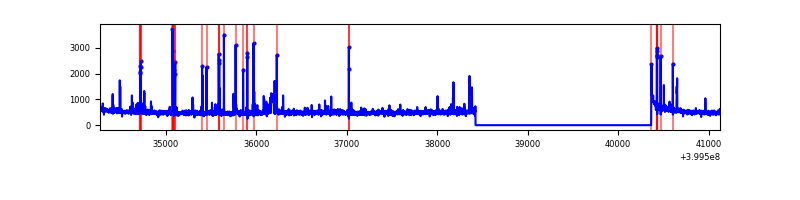 |
| B | 6852 | 4910 | 35 | 35 | 0.51% | 0.71% | 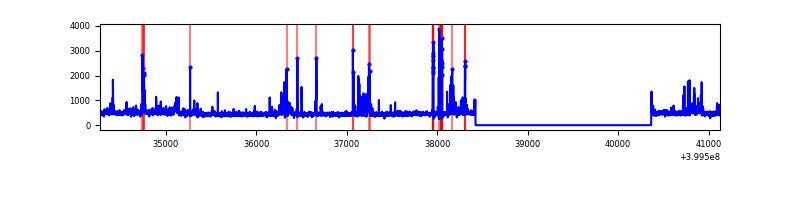 |
| C | 6852 | 4910 | 1 | 1 | 0.01% | 0.02% | 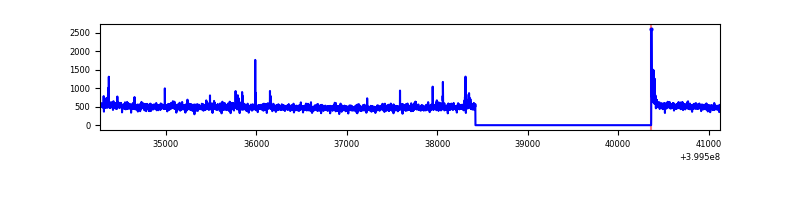 |
| D | 6852 | 4910 | 598 | 598 | 8.73% | 12.18% | 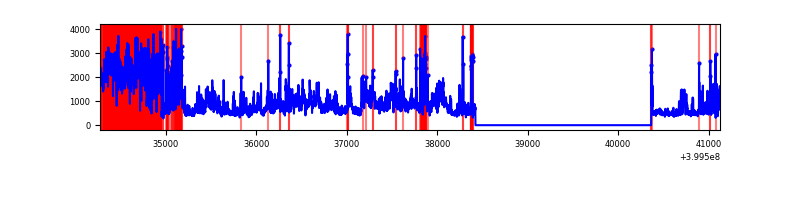 |
Top three noisy pixels from each quadrant. If the there are fewer than three noisy pixels in the level2.evt file, extra rows are filled as -1
| Pixel properties | Quadrant properties | ||||||
|---|---|---|---|---|---|---|---|
| Quadrant | DetID | PixID | Counts | Sigma | Mean | Median | Sigma |
| A | 10 | 83 | 220883 | 1959.34 | 559 | 548 | 112.5 |
| A | 15 | 222 | 127404 | 1128.07 | 559 | 548 | 112.5 |
| A | 9 | 143 | 74981 | 661.9 | 559 | 548 | 112.5 |
| B | 5 | 172 | 166634 | 1574.31 | 553 | 539 | 105.5 |
| B | 15 | 85 | 63983 | 601.35 | 553 | 539 | 105.5 |
| B | 4 | 232 | 57880 | 543.5 | 553 | 539 | 105.5 |
| C | 15 | 214 | 206832 | 1621.36 | 550 | 554 | 127.2 |
| C | 14 | 254 | 35799 | 277.03 | 550 | 554 | 127.2 |
| C | 0 | 10 | 27670 | 213.13 | 550 | 554 | 127.2 |
| D | 10 | 253 | 1473969 | 11592.23 | 526 | 511 | 127.1 |
| D | 12 | 227 | 938739 | 7381.38 | 526 | 511 | 127.1 |
| D | 12 | 235 | 221128 | 1735.67 | 526 | 511 | 127.1 |
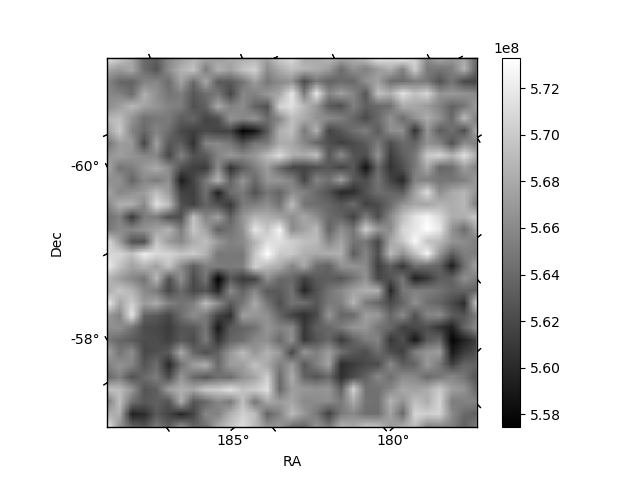
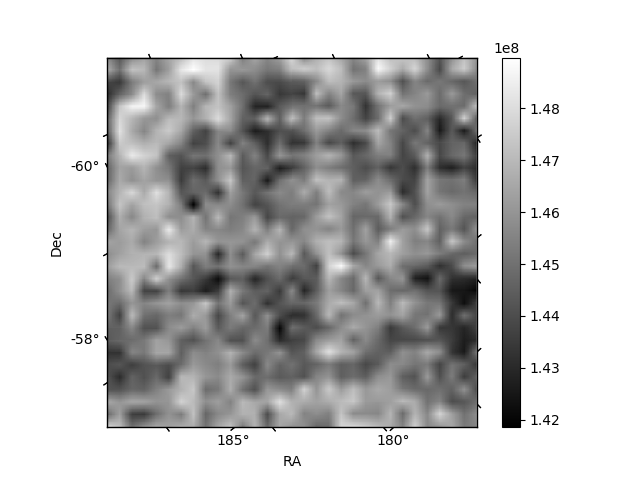
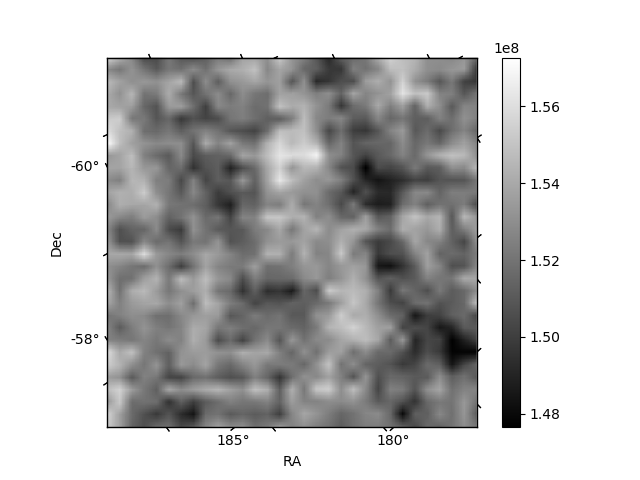
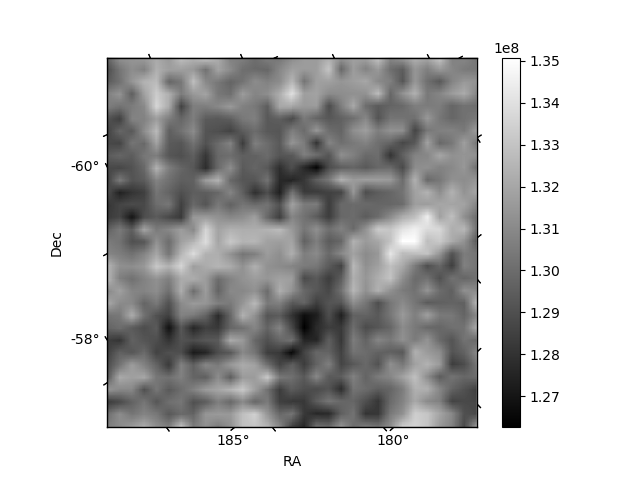
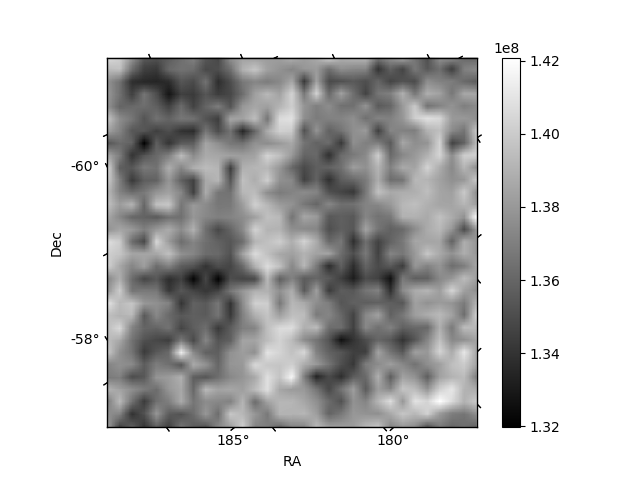
Histogram calculated using DETX and DETY for each event in the final _common_clean file
| Quadrant A | 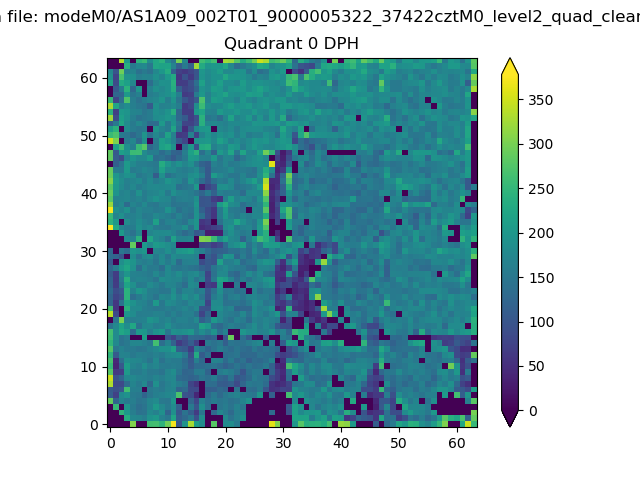 |
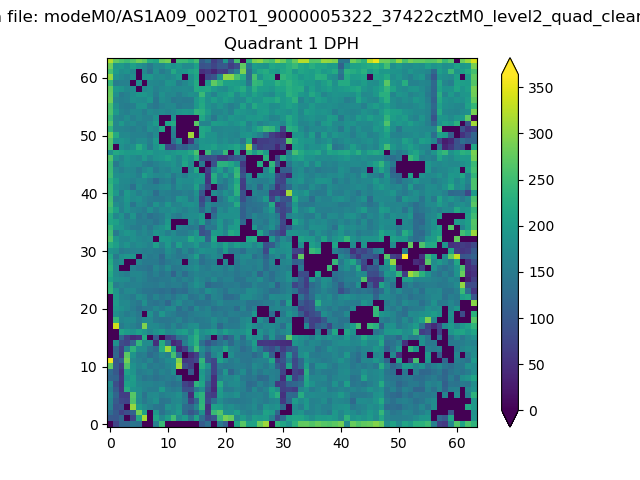 |
Quadrant B |
|---|---|---|---|
| Quadrant D | 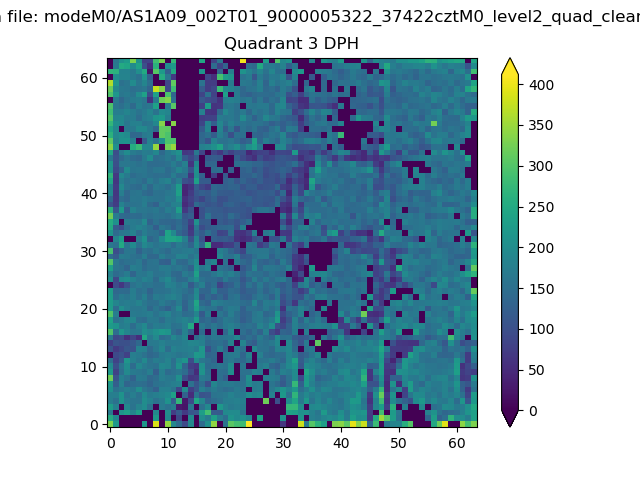 |
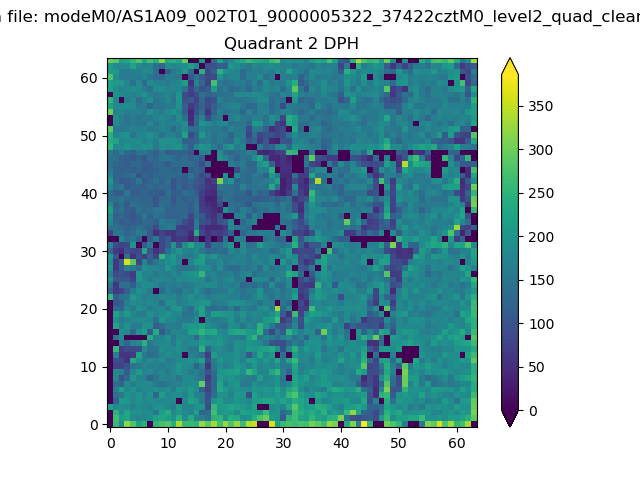 |
Quadrant C |
| Plot type | Count rate plots | Images |
|---|---|---|
| Comparison with Poisson distribution Blue bars denote a histogram of data divided into 1 sec bins. Red curve is a Poisson curve with rate = median count rate of data. |
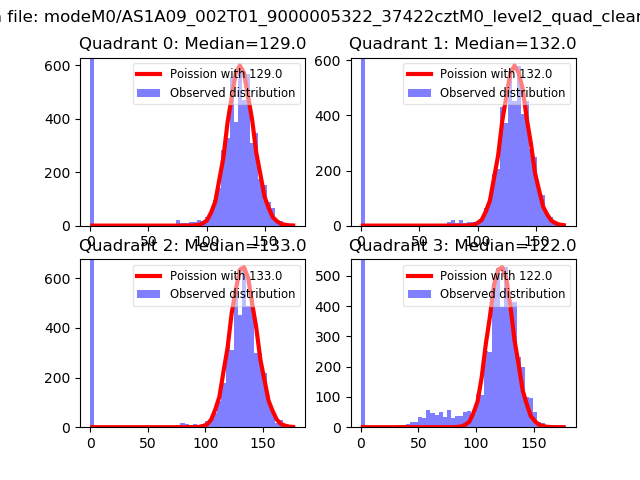 |
 |
| Quadrant-wise count rates Data is divided into 100 sec bins |
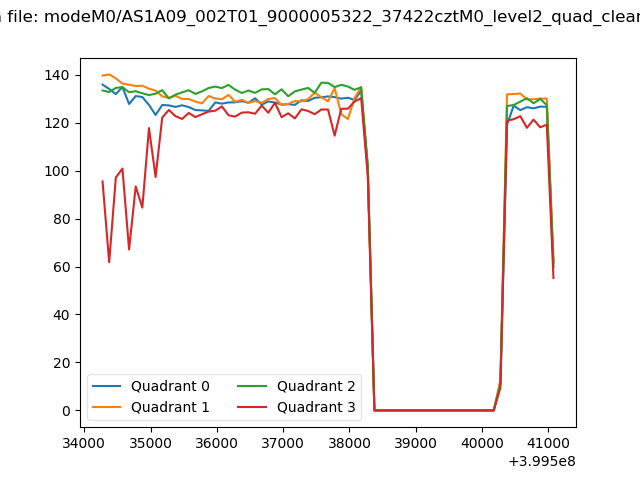 |
|
| Module-wise count rates for Quadrant A Data is divided into 100 sec bins |
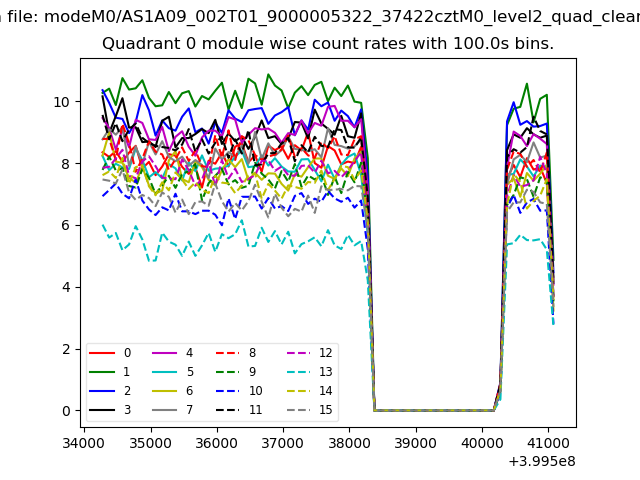 |
 |
| Module-wise count rates for Quadrant B Data is divided into 100 sec bins |
 |
 |
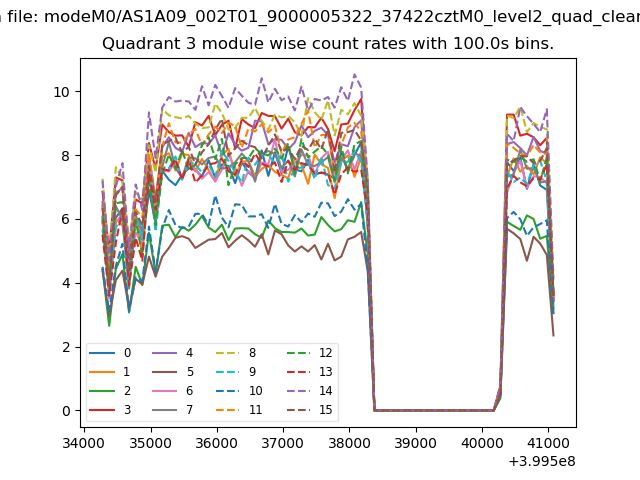
| Module-wise count rates for Quadrant C Data is divided into 100 sec bins |
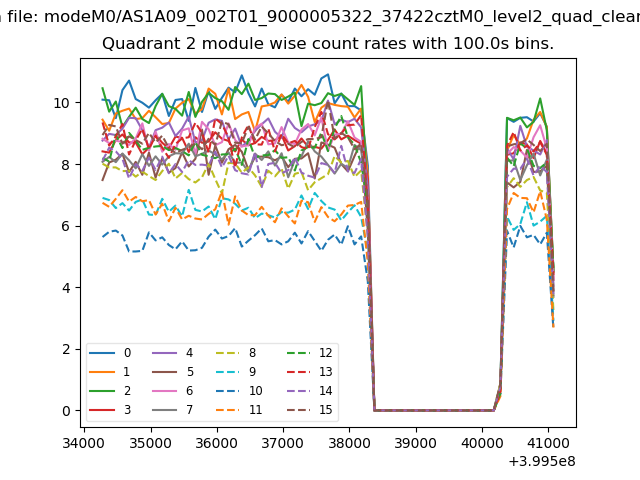 |
 |
| Module-wise count rates for Quadrant D Data is divided into 100 sec bins |
 |
 |
| Parameter | Plot |
|---|---|
| CZT HV Monitor | 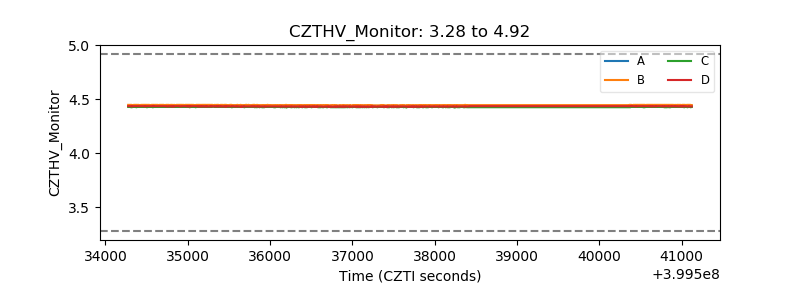 |
| D_VDD | 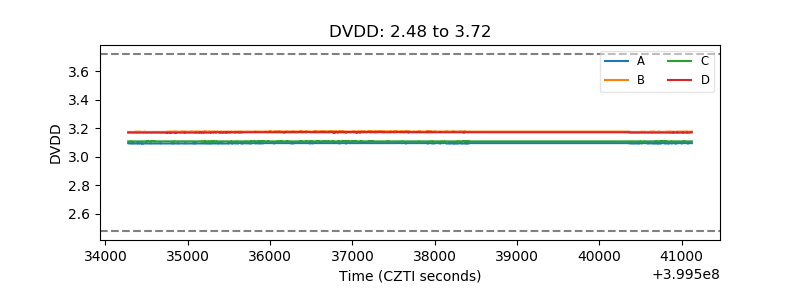 |
| Temperature 1 | 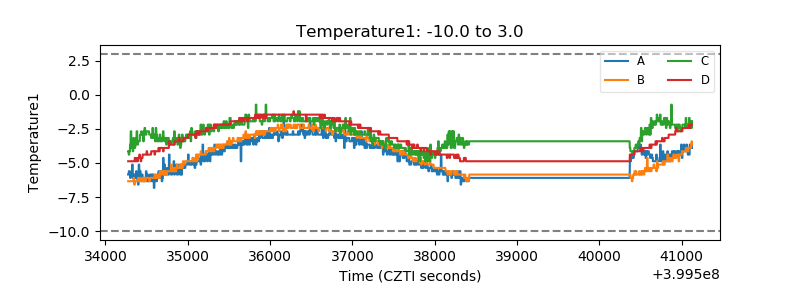 |
| Veto HV Monitor | 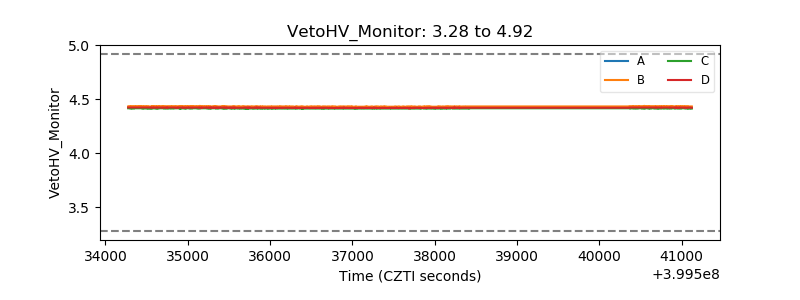 |
| Veto LLD | 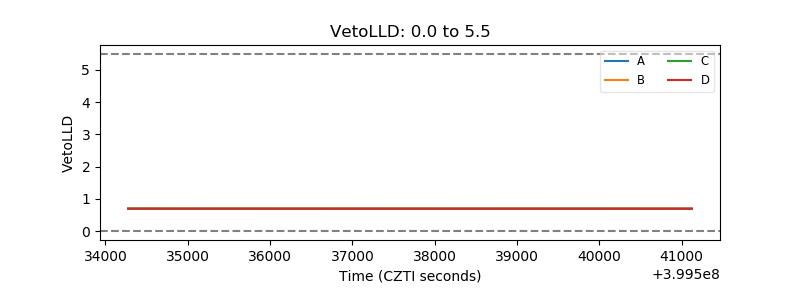 |
| Alpha Counter | 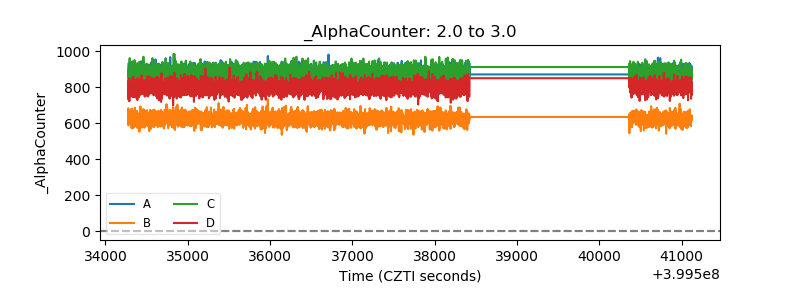 |
| _CPM_Rate | 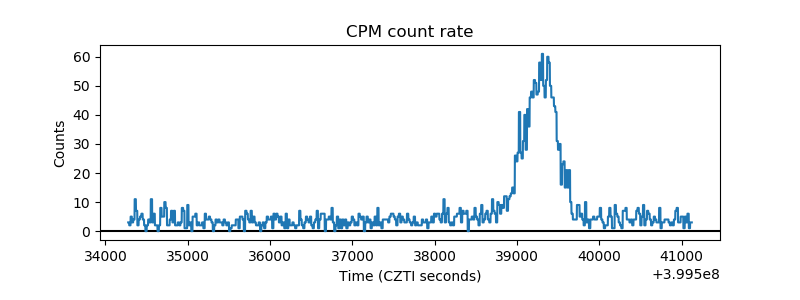 |
| CZT Counter | 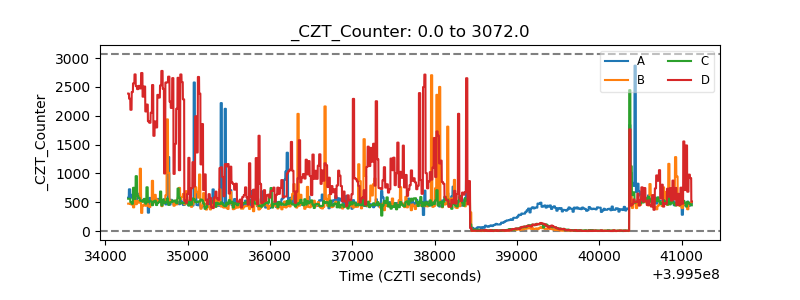 |
| +2.5 Volts monitor | 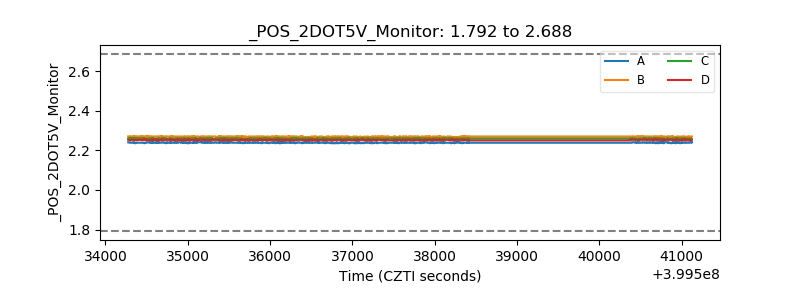 |
| +5 Volts monitor | 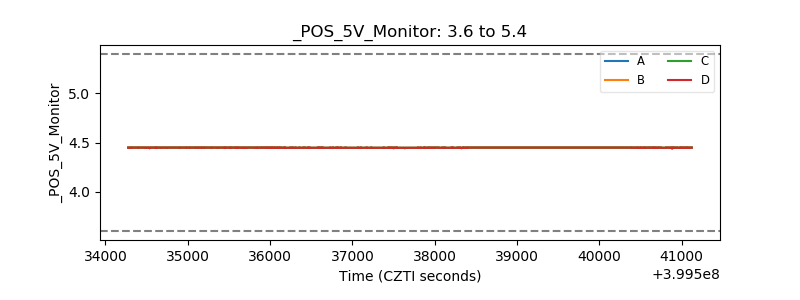 |
| _ROLL_ROT | 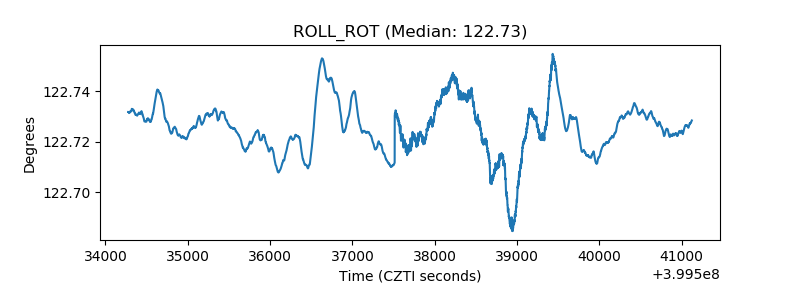 |
| _Roll_DEC | 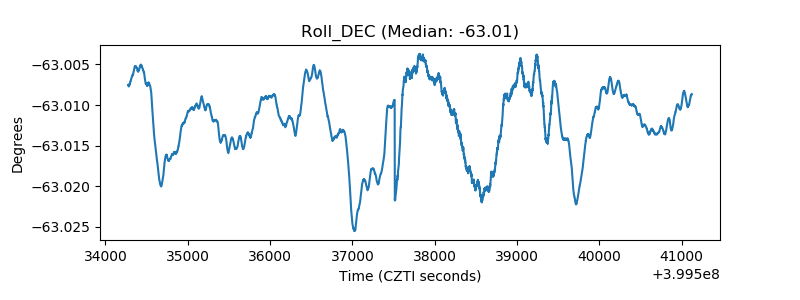 |
| _Roll_RA | 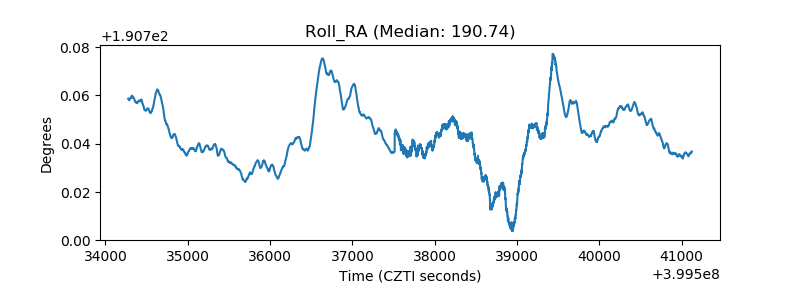 |
| Veto Counter | 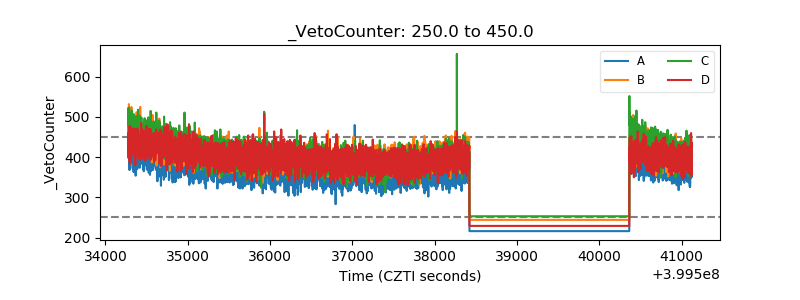 |