| Param | Original file | Final file |
|---|---|---|
| Filename | modeM0/AS1A09_002T01_9000005322_37423cztM0_level2.evt | modeM0/AS1A09_002T01_9000005322_37423cztM0_level2_quad_clean.evt |
| Size (bytes) | 408,326,400 | 88,571,520 |
| Size | 389.4 MB | 84.5 MB |
| Events in quadrant A | 2,988,830 | 570,695 |
| Events in quadrant B | 2,742,442 | 581,370 |
| Events in quadrant C | 2,852,067 | 591,234 |
| Events in quadrant D | 3,410,232 | 555,448 |
| Mode M0 | |||
|---|---|---|---|
| Quadrant | BADHDUFLAG | Total packets | Discarded packets |
| A | 0 | 12123 | 3 |
| B | 0 | 11806 | 2 |
| C | 0 | 11841 | 2 |
| D | 0 | 13835 | 2 |
| Mode M9 | |||
|---|---|---|---|
| Quadrant | BADHDUFLAG | Total packets | Discarded packets |
| A | 0 | 16 | 0 |
| B | 0 | 16 | 0 |
| C | 0 | 16 | 0 |
| D | 0 | 17 | 0 |
| Mode SS | |||
|---|---|---|---|
| Quadrant | BADHDUFLAG | Total packets | Discarded packets |
| A | 0 | 112 | 0 |
| B | 0 | 112 | 0 |
| C | 0 | 112 | 0 |
| D | 0 | 112 | 0 |
| Quadrant | Total seconds | Saturated seconds | Saturation percentage |
|---|---|---|---|
| A | 5479 | 33 | 0.602300% |
| B | 5479 | 43 | 0.784815% |
| C | 5479 | 41 | 0.748312% |
| D | 5479 | 140 | 2.555211% |
Noise dominated data is calculated using 1-second bins in cleaned event files. If a bin has >2000 counts, and if more than 50% of those come from <1% of pixels, then it is considered to be noise-dominated and hence unusable.
| Quadrant | # 1 sec bins | Bins with >0 counts | Bins with >2000 counts | High rate bins dominated by noise | Noise dominated (total time) | Noise dominated (detector-on time) | Marked lightcurve |
|---|---|---|---|---|---|---|---|
| A | 7062 | 5480 | 23 | 23 | 0.33% | 0.42% | 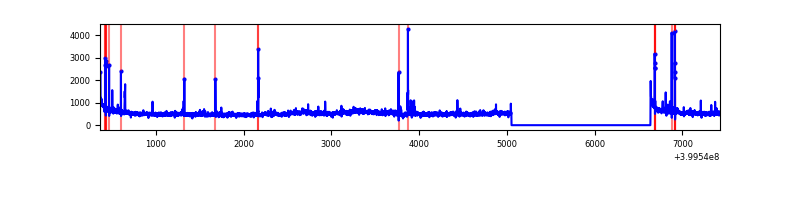 |
| B | 7062 | 5480 | 33 | 33 | 0.47% | 0.60% | 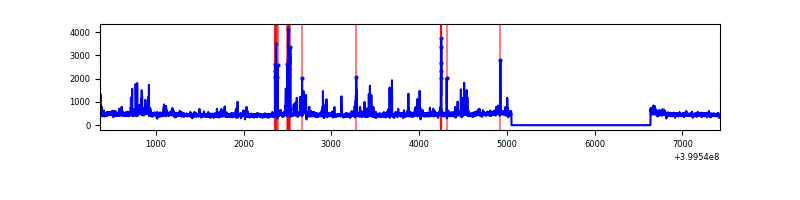 |
| C | 7062 | 5480 | 36 | 36 | 0.51% | 0.66% | 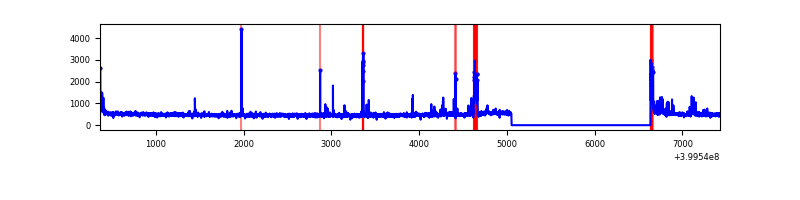 |
| D | 7062 | 5480 | 120 | 120 | 1.70% | 2.19% | 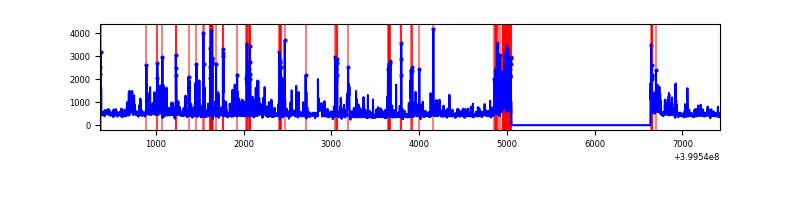 |
Top three noisy pixels from each quadrant. If the there are fewer than three noisy pixels in the level2.evt file, extra rows are filled as -1
| Pixel properties | Quadrant properties | ||||||
|---|---|---|---|---|---|---|---|
| Quadrant | DetID | PixID | Counts | Sigma | Mean | Median | Sigma |
| A | 10 | 83 | 289749 | 2330.03 | 617 | 605 | 124.1 |
| A | 15 | 222 | 188910 | 1517.43 | 617 | 605 | 124.1 |
| A | 9 | 143 | 38844 | 308.14 | 617 | 605 | 124.1 |
| B | 5 | 172 | 150583 | 1297.5 | 608 | 593 | 115.6 |
| B | 5 | 255 | 56140 | 480.51 | 608 | 593 | 115.6 |
| B | 4 | 232 | 35776 | 304.35 | 608 | 593 | 115.6 |
| C | 15 | 214 | 235973 | 1663.11 | 605 | 609 | 141.5 |
| C | 14 | 254 | 178825 | 1259.29 | 605 | 609 | 141.5 |
| C | 0 | 10 | 71320 | 499.65 | 605 | 609 | 141.5 |
| D | 2 | 249 | 349817 | 2377.75 | 602 | 586 | 146.9 |
| D | 1 | 47 | 202927 | 1377.64 | 602 | 586 | 146.9 |
| D | 13 | 249 | 160663 | 1089.89 | 602 | 586 | 146.9 |
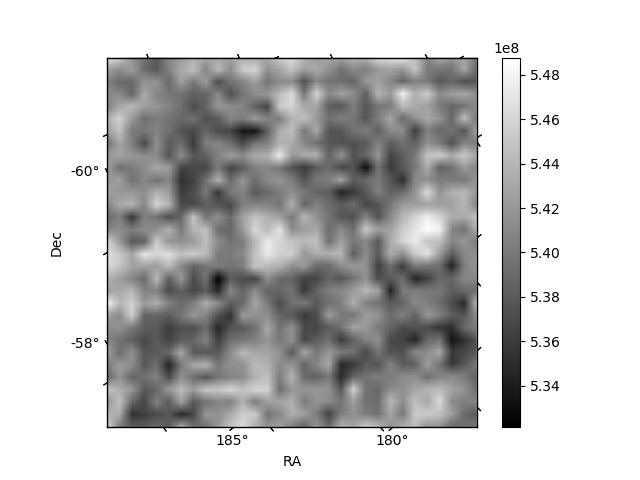
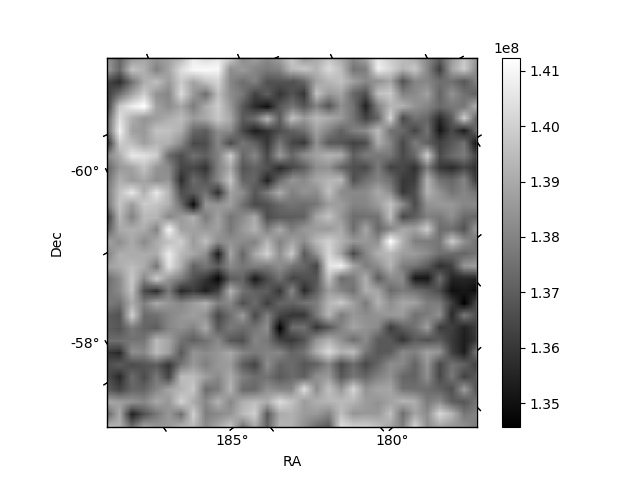
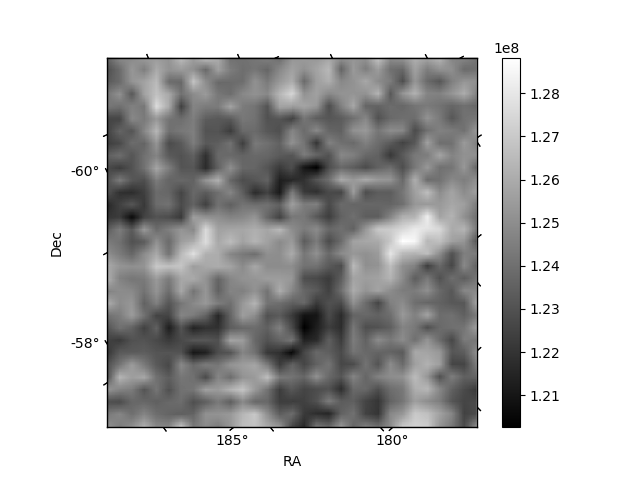
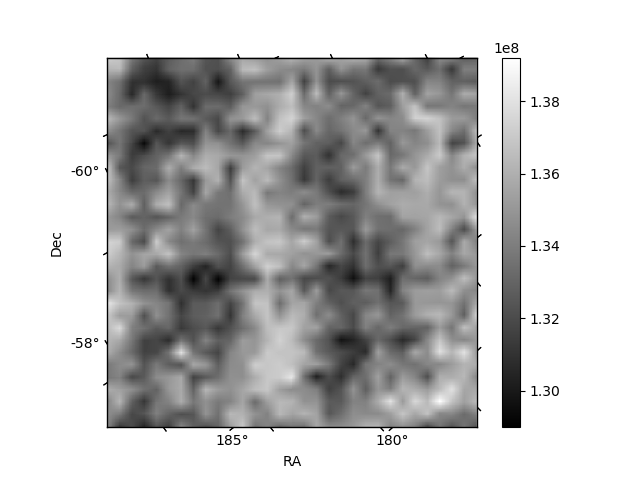
Histogram calculated using DETX and DETY for each event in the final _common_clean file
| Quadrant A | 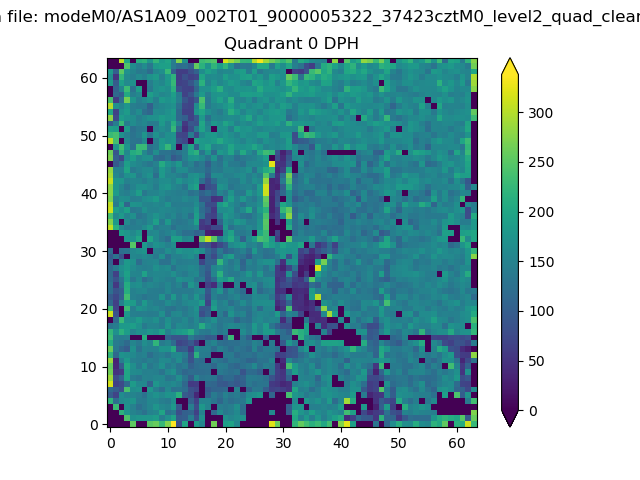 |
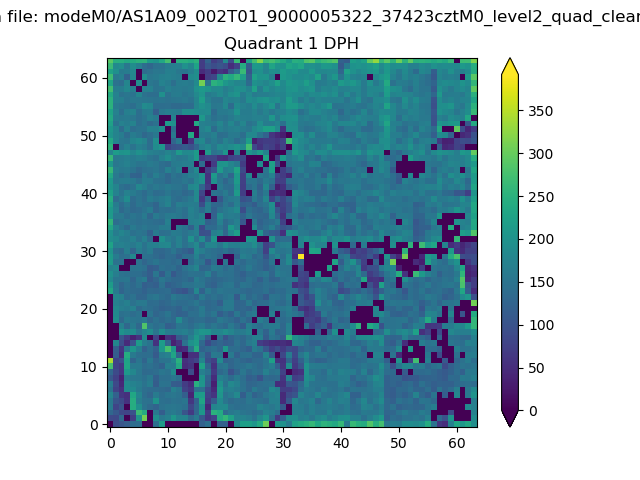 |
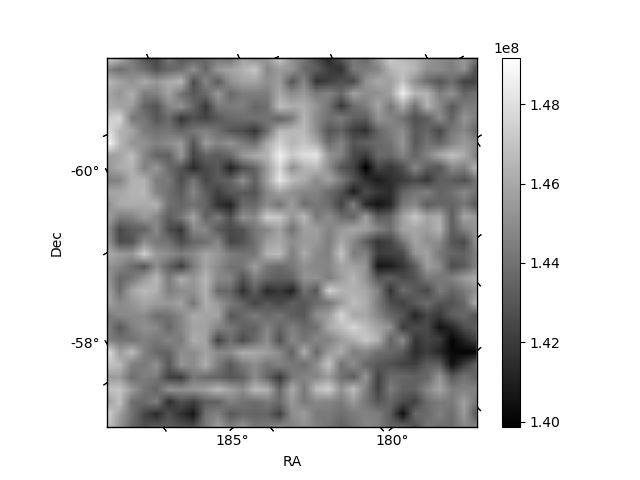
Quadrant B |
|---|---|---|---|
| Quadrant D | 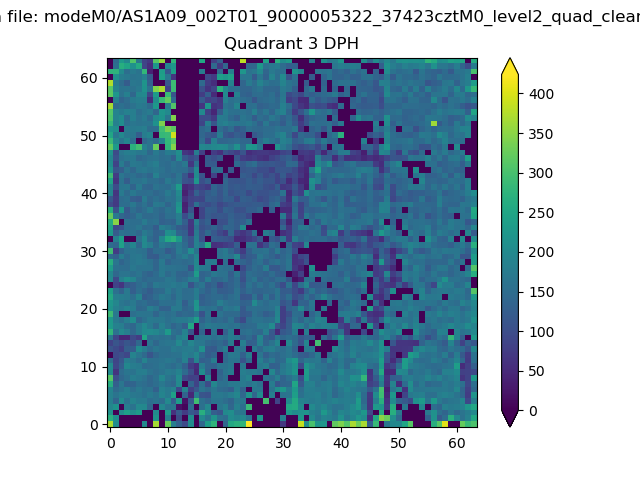 |
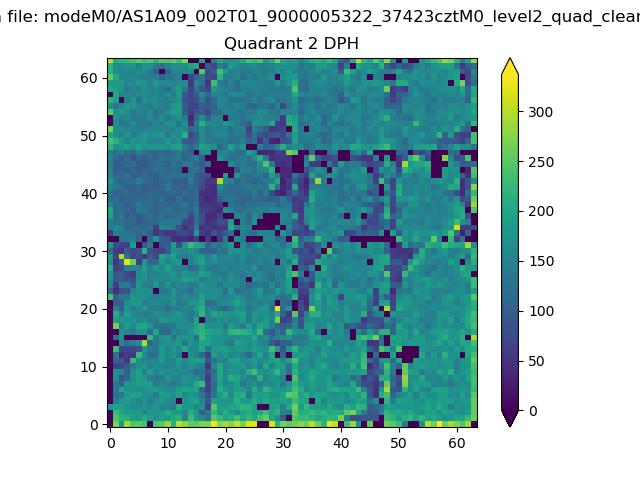 |
Quadrant C |
| Plot type | Count rate plots | Images |
|---|---|---|
| Comparison with Poisson distribution Blue bars denote a histogram of data divided into 1 sec bins. Red curve is a Poisson curve with rate = median count rate of data. |
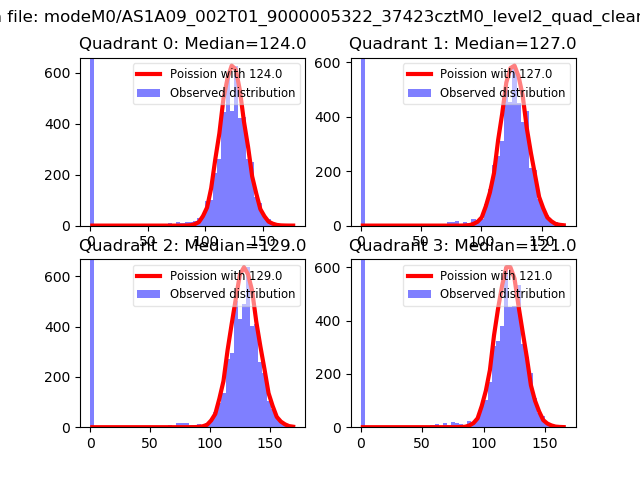 |
 |
| Quadrant-wise count rates Data is divided into 100 sec bins |
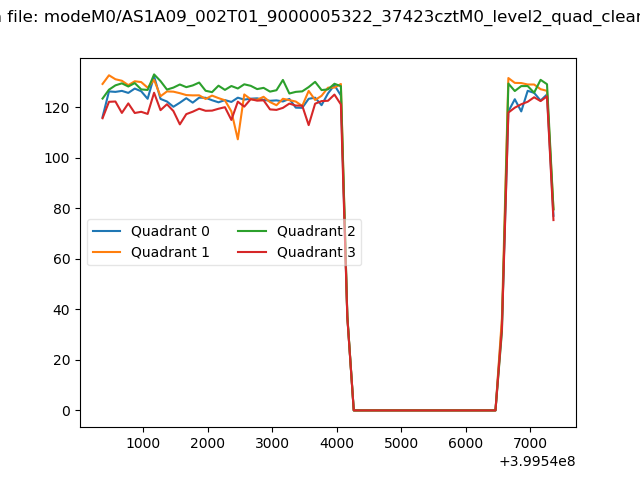 |
|
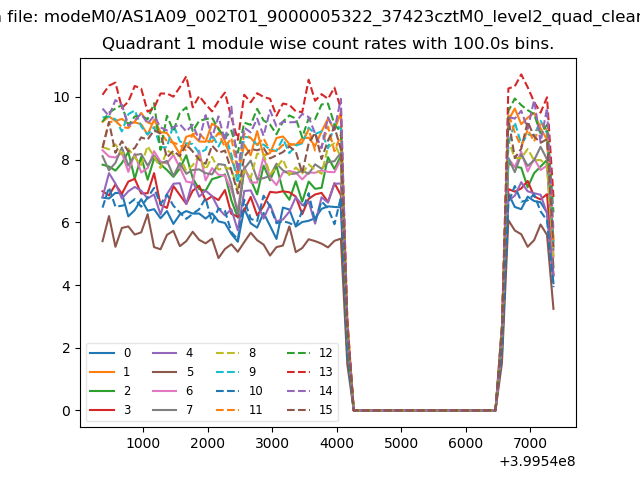
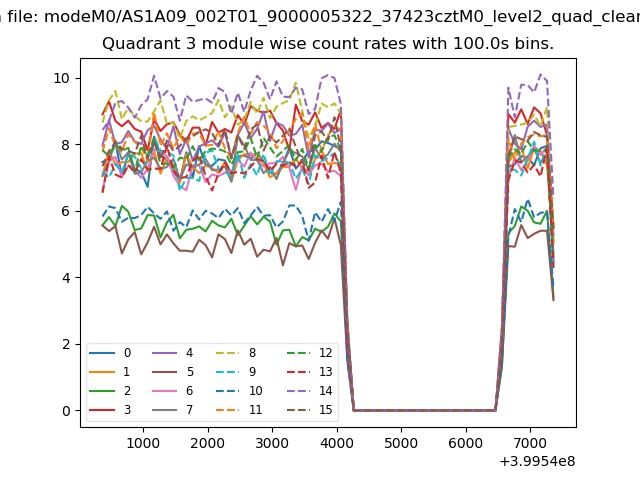
| Module-wise count rates for Quadrant A Data is divided into 100 sec bins |
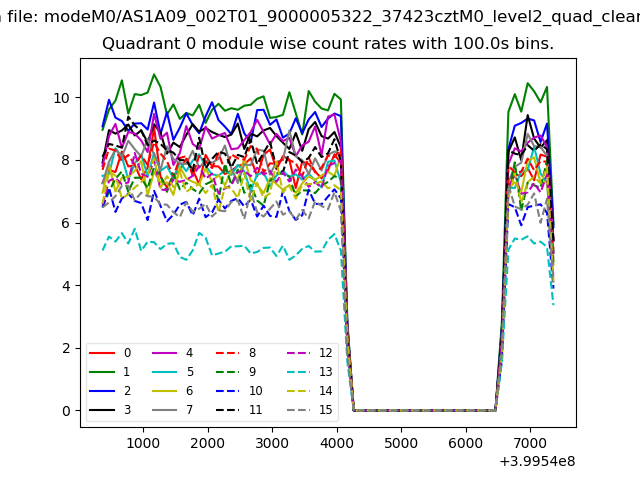 |
 |
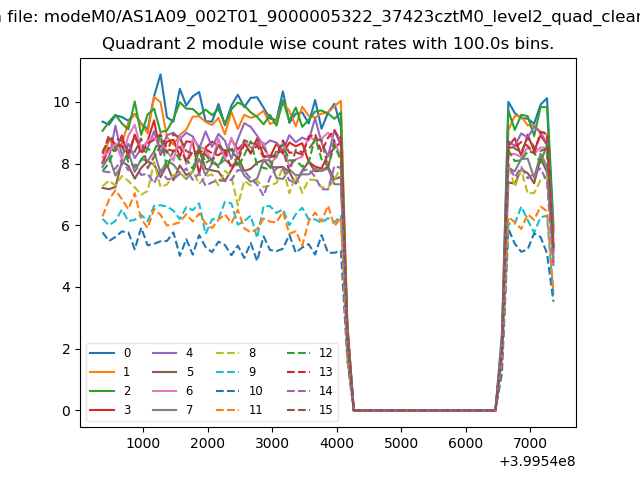
| Module-wise count rates for Quadrant B Data is divided into 100 sec bins |
 |
 |
| Module-wise count rates for Quadrant C Data is divided into 100 sec bins |
 |
 |
| Module-wise count rates for Quadrant D Data is divided into 100 sec bins |
 |
 |
| Parameter | Plot |
|---|---|
| CZT HV Monitor |  |
| D_VDD | 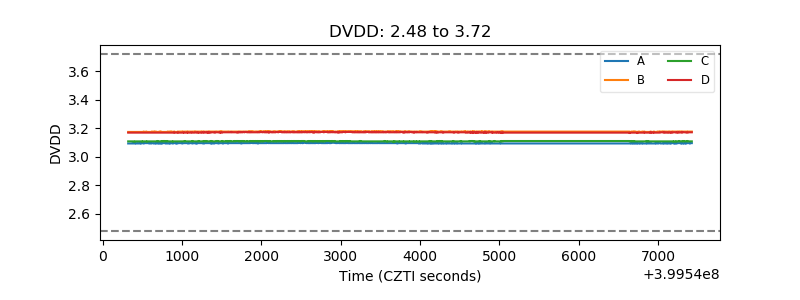 |
| Temperature 1 | 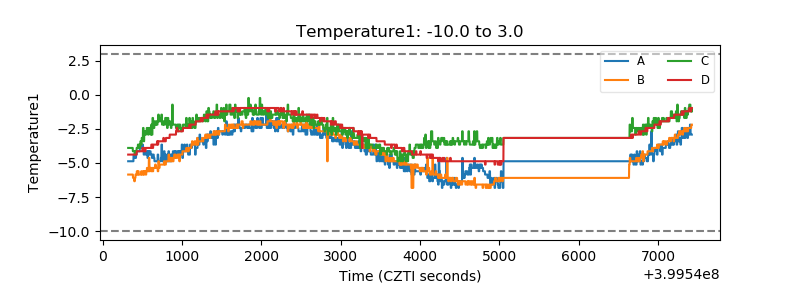 |
| Veto HV Monitor | 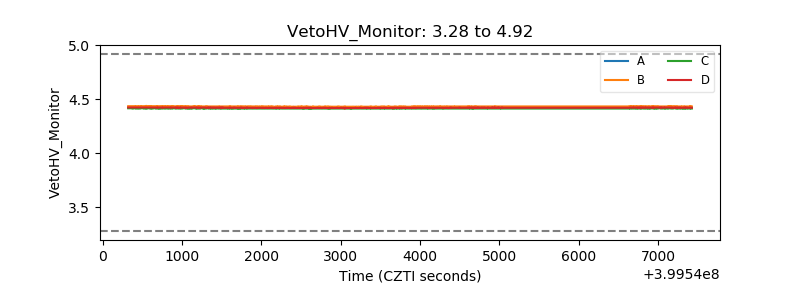 |
| Veto LLD | 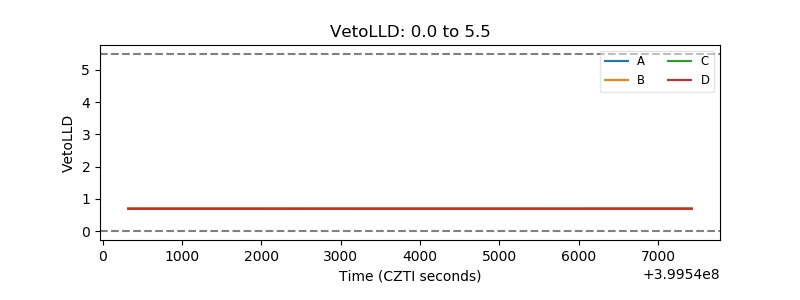 |
| Alpha Counter | 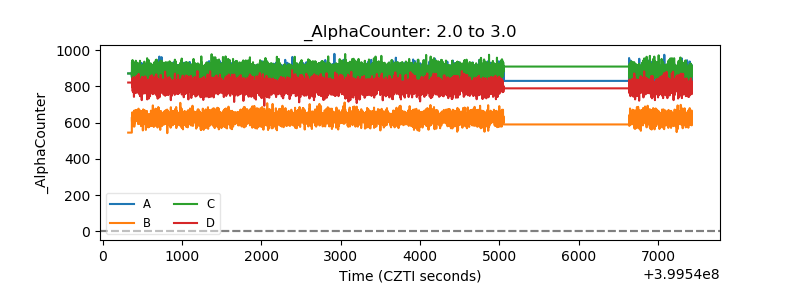 |
| _CPM_Rate | 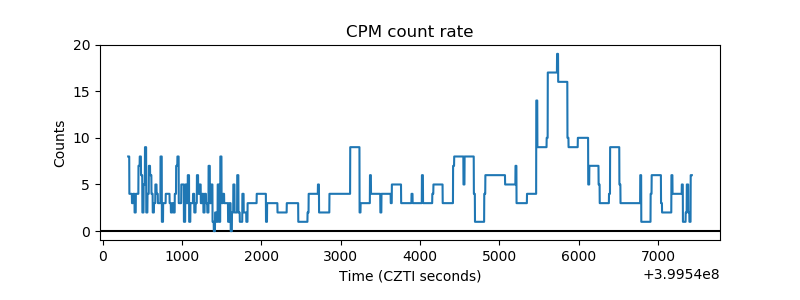 |
| CZT Counter | 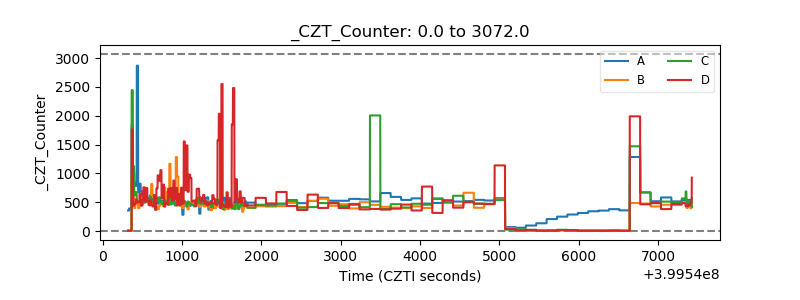 |
| +2.5 Volts monitor | 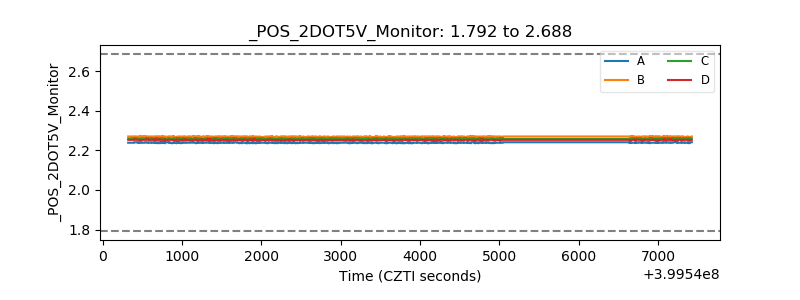 |
| +5 Volts monitor | 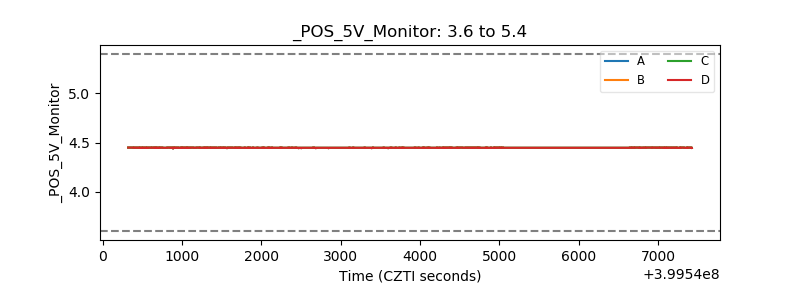 |
| _ROLL_ROT | 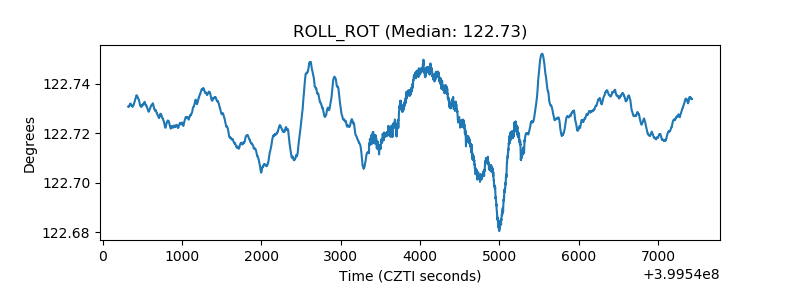 |
| _Roll_DEC | 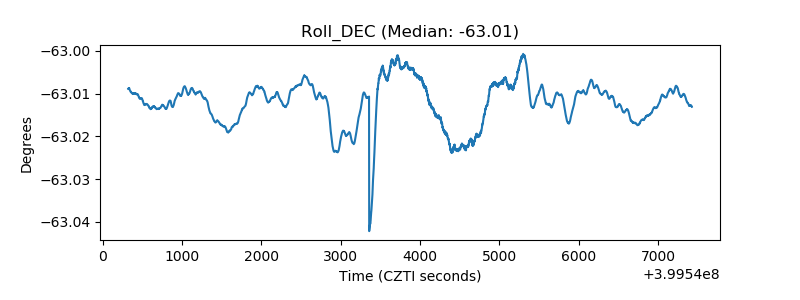 |
| _Roll_RA | 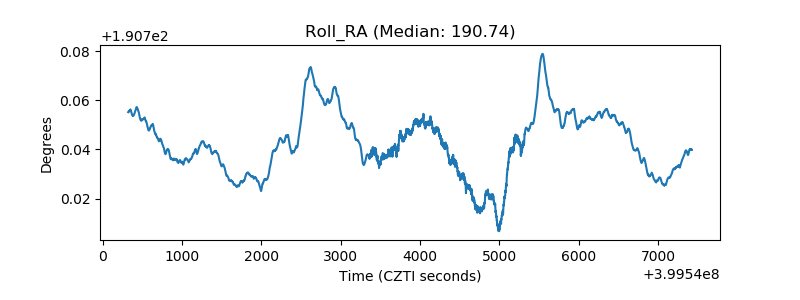 |
| Veto Counter | 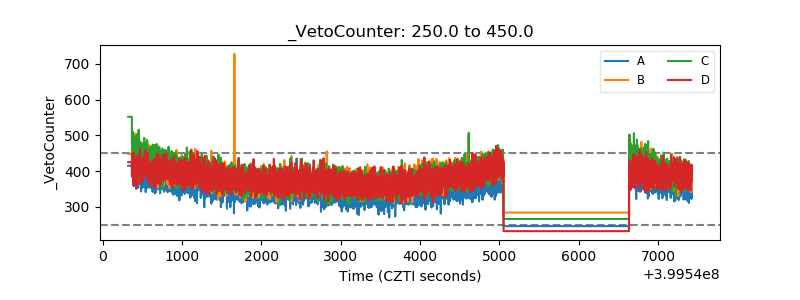 |