| Param | Original file | Final file |
|---|---|---|
| Filename | modeM0/AS1A09_002T01_9000005322_37424cztM0_level2.evt | modeM0/AS1A09_002T01_9000005322_37424cztM0_level2_quad_clean.evt |
| Size (bytes) | 516,110,400 | 85,003,200 |
| Size | 492.2 MB | 81.1 MB |
| Events in quadrant A | 3,471,946 | 546,575 |
| Events in quadrant B | 3,065,280 | 557,655 |
| Events in quadrant C | 3,417,551 | 562,750 |
| Events in quadrant D | 5,273,960 | 492,985 |
| Mode M0 | |||
|---|---|---|---|
| Quadrant | BADHDUFLAG | Total packets | Discarded packets |
| A | 0 | 13948 | 3 |
| B | 0 | 13083 | 2 |
| C | 0 | 13814 | 2 |
| D | 0 | 19688 | 2 |
| Mode M9 | |||
|---|---|---|---|
| Quadrant | BADHDUFLAG | Total packets | Discarded packets |
| A | 0 | 17 | 0 |
| B | 0 | 17 | 0 |
| C | 0 | 17 | 0 |
| D | 0 | 18 | 0 |
| Mode SS | |||
|---|---|---|---|
| Quadrant | BADHDUFLAG | Total packets | Discarded packets |
| A | 0 | 120 | 0 |
| B | 0 | 120 | 0 |
| C | 0 | 120 | 0 |
| D | 0 | 120 | 0 |
| Quadrant | Total seconds | Saturated seconds | Saturation percentage |
|---|---|---|---|
| A | 5924 | 43 | 0.725861% |
| B | 5924 | 62 | 1.046590% |
| C | 5924 | 90 | 1.519244% |
| D | 5924 | 966 | 16.306550% |
Noise dominated data is calculated using 1-second bins in cleaned event files. If a bin has >2000 counts, and if more than 50% of those come from <1% of pixels, then it is considered to be noise-dominated and hence unusable.
| Quadrant | # 1 sec bins | Bins with >0 counts | Bins with >2000 counts | High rate bins dominated by noise | Noise dominated (total time) | Noise dominated (detector-on time) | Marked lightcurve |
|---|---|---|---|---|---|---|---|
| A | 7267 | 5925 | 19 | 19 | 0.26% | 0.32% | 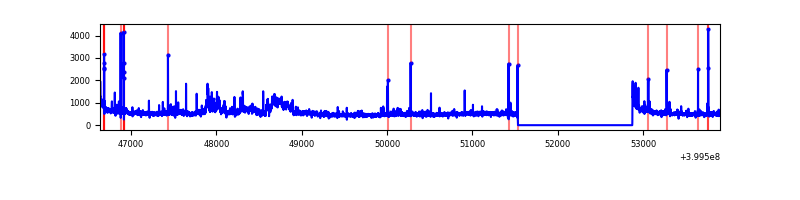 |
| B | 7267 | 5925 | 34 | 34 | 0.47% | 0.57% | 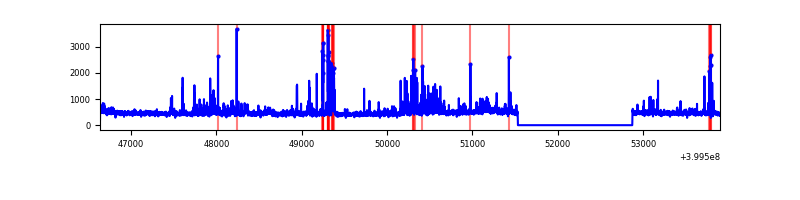 |
| C | 7267 | 5925 | 69 | 69 | 0.95% | 1.16% | 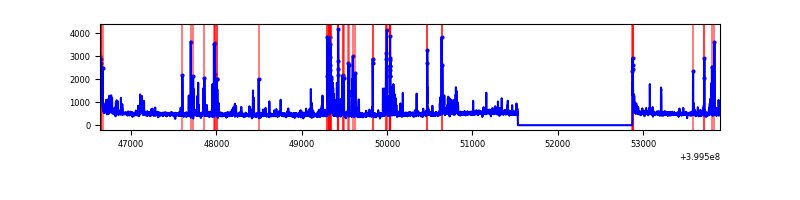 |
| D | 7267 | 5925 | 888 | 888 | 12.22% | 14.99% | 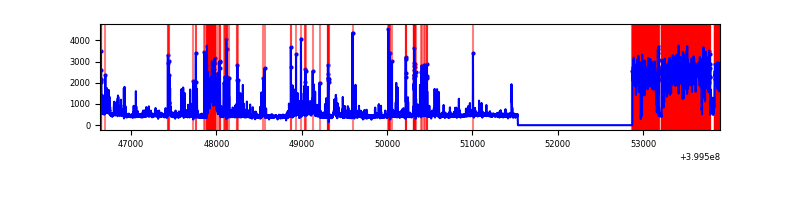 |
Top three noisy pixels from each quadrant. If the there are fewer than three noisy pixels in the level2.evt file, extra rows are filled as -1
| Pixel properties | Quadrant properties | ||||||
|---|---|---|---|---|---|---|---|
| Quadrant | DetID | PixID | Counts | Sigma | Mean | Median | Sigma |
| A | 15 | 222 | 400598 | 2991.51 | 663 | 649 | 133.7 |
| A | 10 | 83 | 303999 | 2268.98 | 663 | 649 | 133.7 |
| A | 6 | 10 | 74345 | 551.23 | 663 | 649 | 133.7 |
| B | 4 | 171 | 194019 | 1548.49 | 655 | 638 | 124.9 |
| B | 5 | 172 | 105427 | 839.1 | 655 | 638 | 124.9 |
| B | 5 | 255 | 58133 | 460.39 | 655 | 638 | 124.9 |
| C | 14 | 254 | 533539 | 3535.29 | 646 | 651 | 150.7 |
| C | 15 | 214 | 252840 | 1673.08 | 646 | 651 | 150.7 |
| C | 0 | 10 | 71971 | 473.15 | 646 | 651 | 150.7 |
| D | 12 | 227 | 1735508 | 11609.02 | 613 | 596 | 149.4 |
| D | 13 | 249 | 311825 | 2082.56 | 613 | 596 | 149.4 |
| D | 10 | 253 | 269151 | 1797.01 | 613 | 596 | 149.4 |
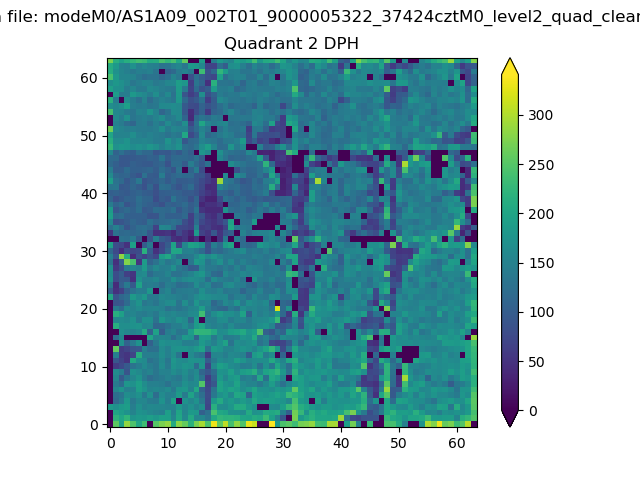
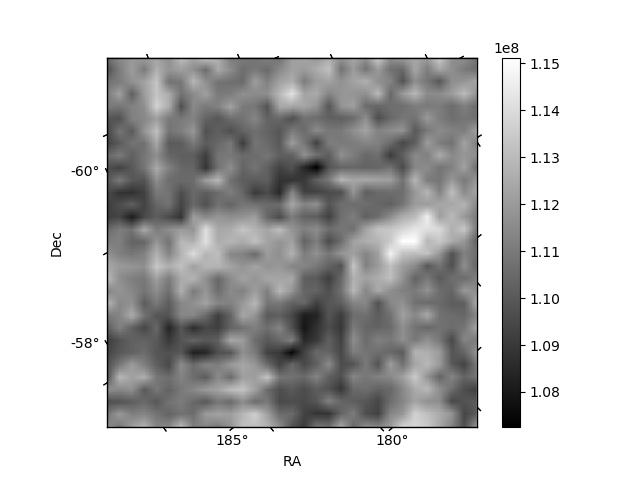
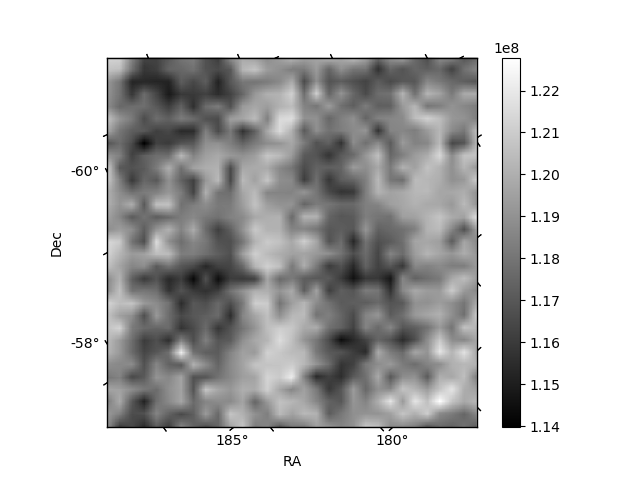
Histogram calculated using DETX and DETY for each event in the final _common_clean file
| Quadrant A | 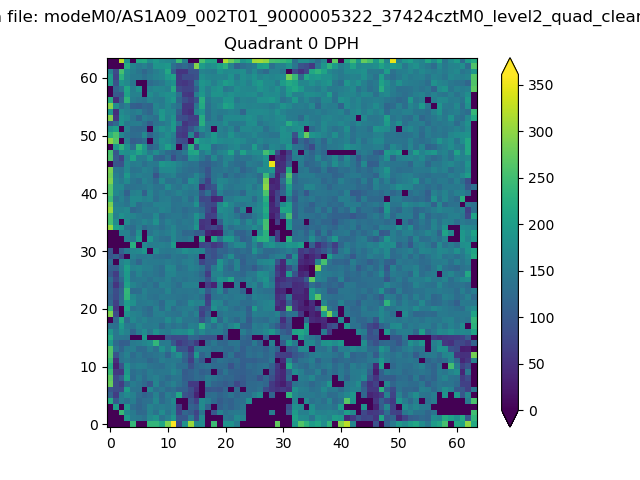 |
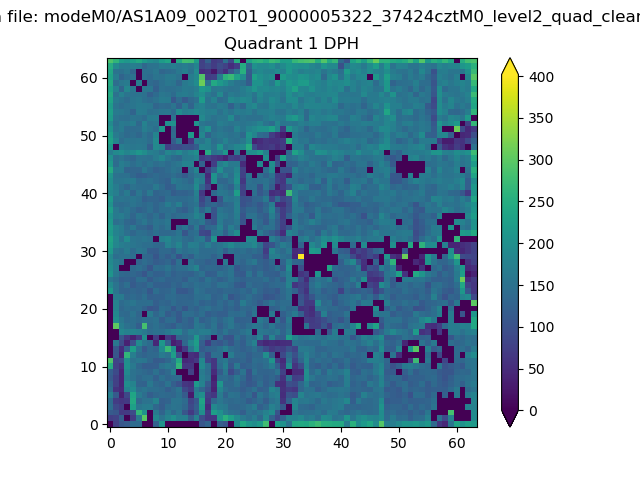 |
Quadrant B |
|---|---|---|---|
| Quadrant D | 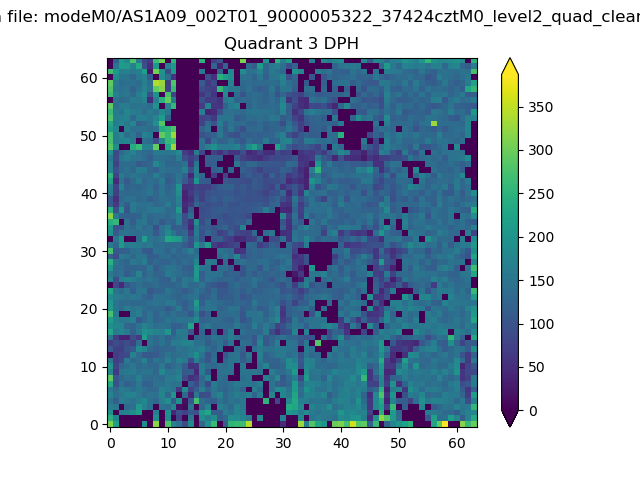 |
 |
Quadrant C |
| Plot type | Count rate plots | Images |
|---|---|---|
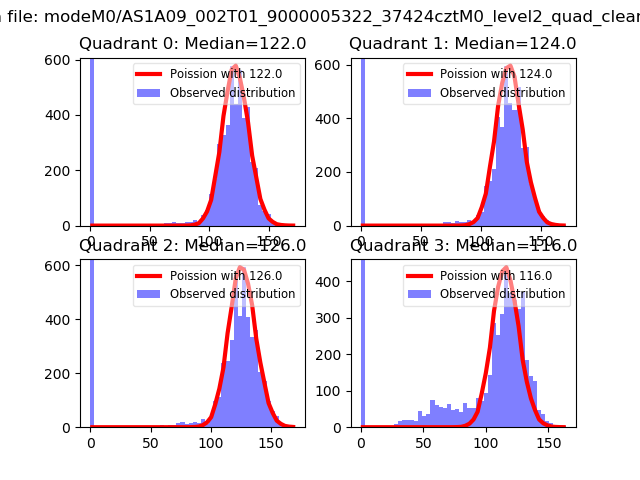
| Comparison with Poisson distribution Blue bars denote a histogram of data divided into 1 sec bins. Red curve is a Poisson curve with rate = median count rate of data. |
 |
 |
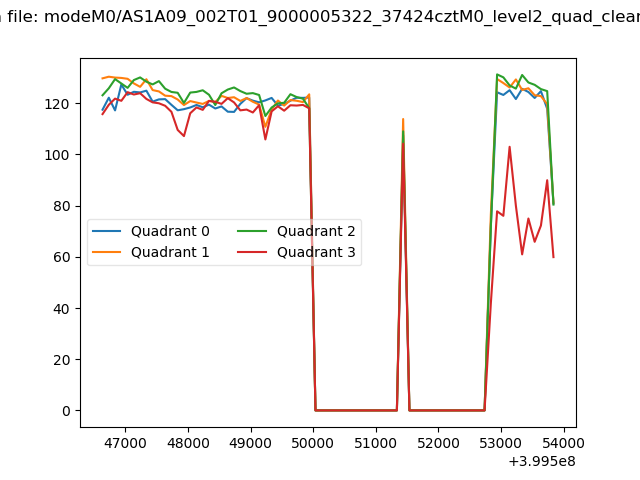
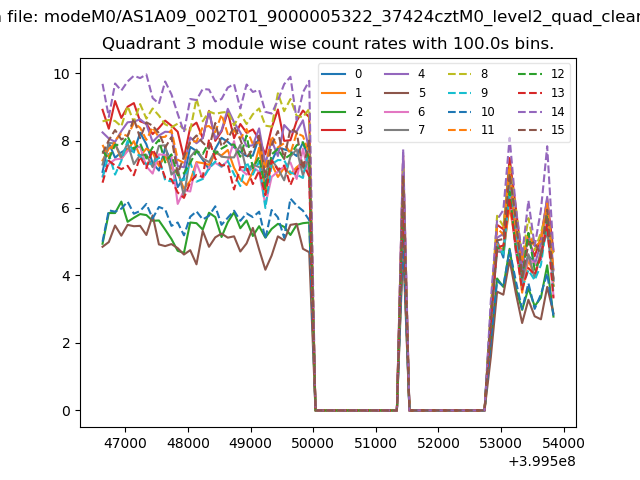
| Quadrant-wise count rates Data is divided into 100 sec bins |
 |
|
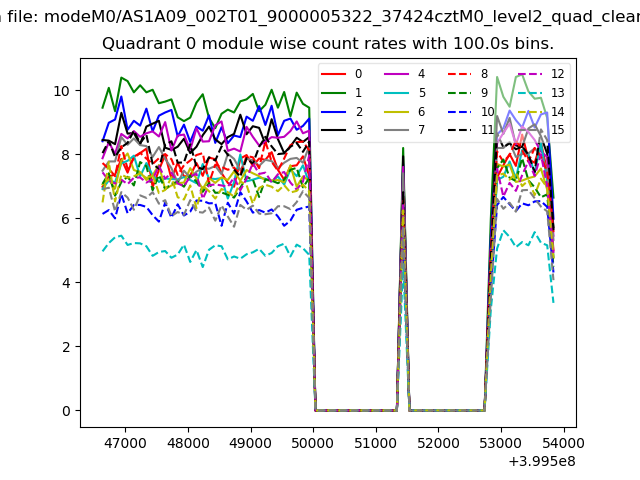
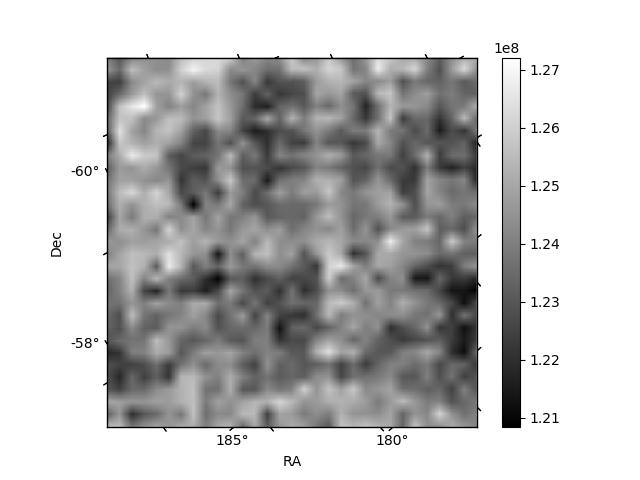
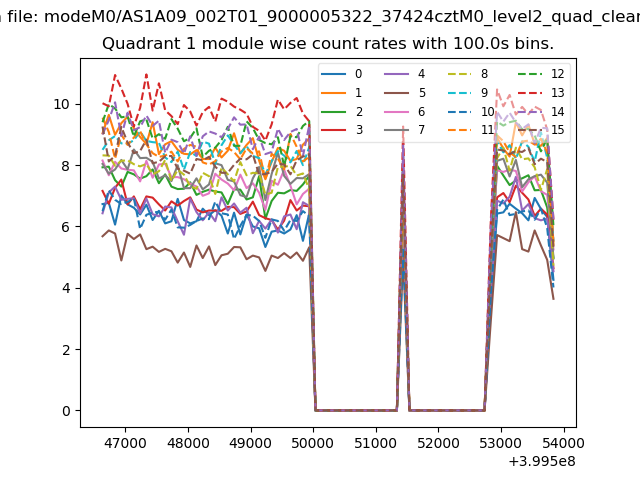
| Module-wise count rates for Quadrant A Data is divided into 100 sec bins |
 |
 |
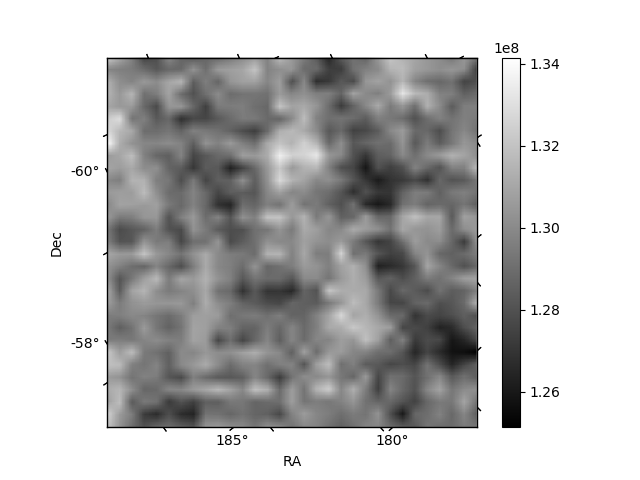
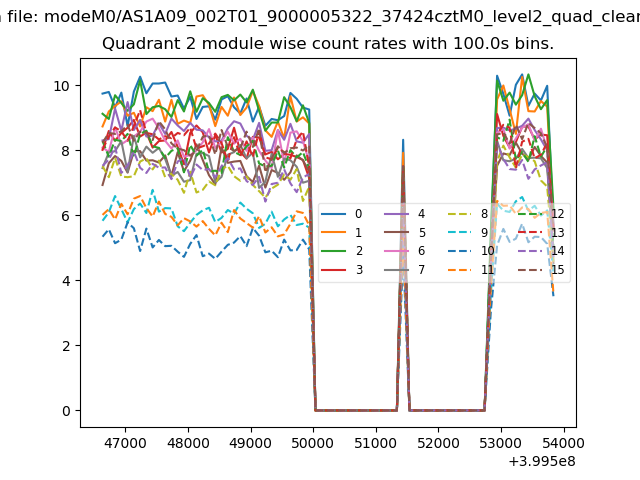
| Module-wise count rates for Quadrant B Data is divided into 100 sec bins |
 |
 |
| Module-wise count rates for Quadrant C Data is divided into 100 sec bins |
 |
 |
| Module-wise count rates for Quadrant D Data is divided into 100 sec bins |
 |
 |
| Parameter | Plot |
|---|---|
| CZT HV Monitor | 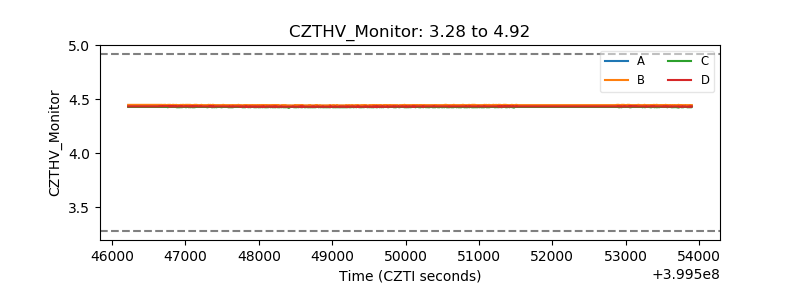 |
| D_VDD | 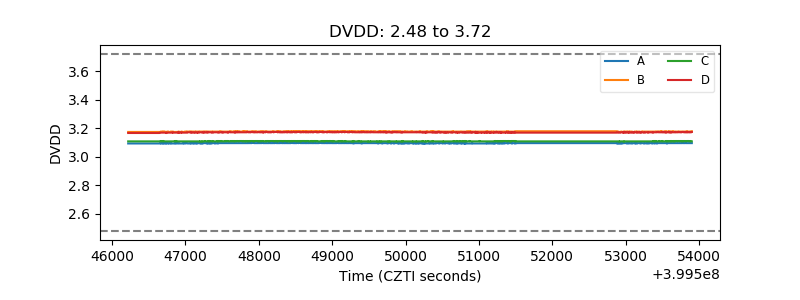 |
| Temperature 1 | 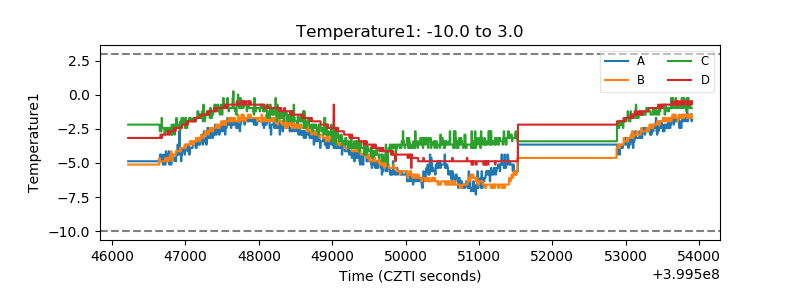 |
| Veto HV Monitor | 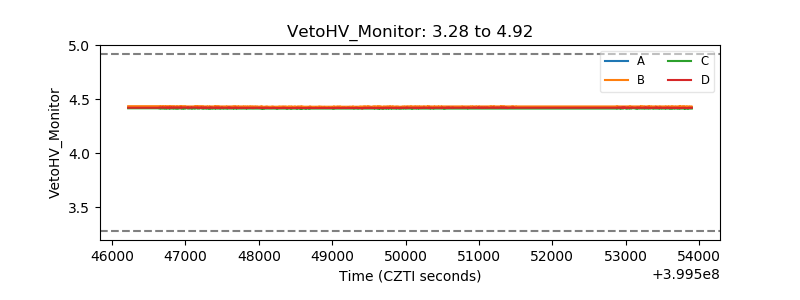 |
| Veto LLD | 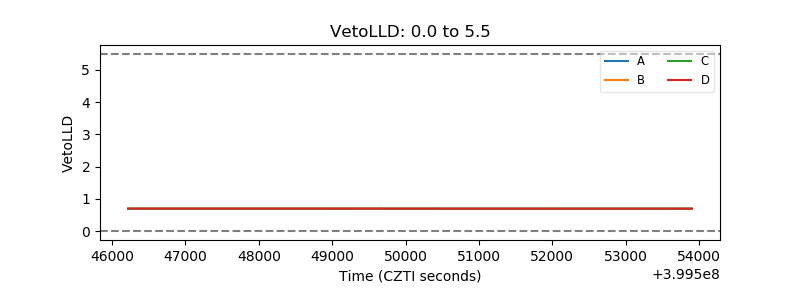 |
| Alpha Counter | 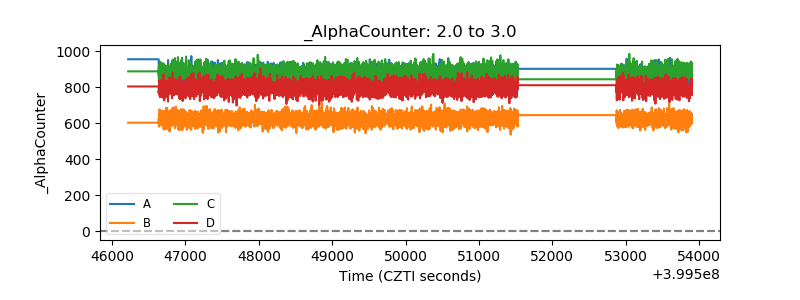 |
| _CPM_Rate | 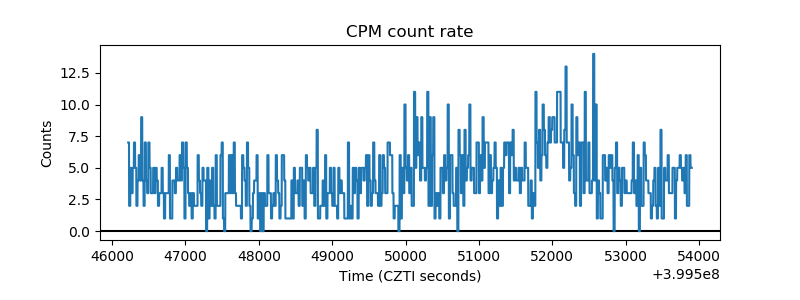 |
| CZT Counter | 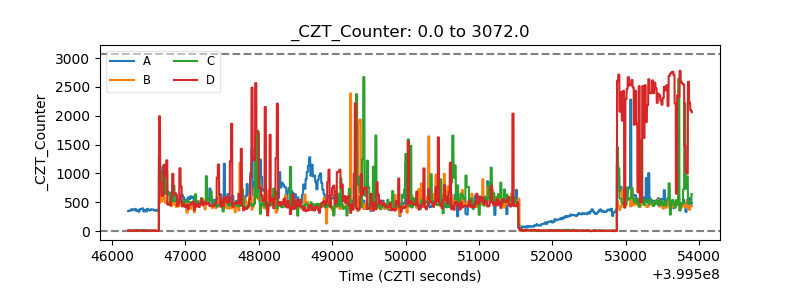 |
| +2.5 Volts monitor | 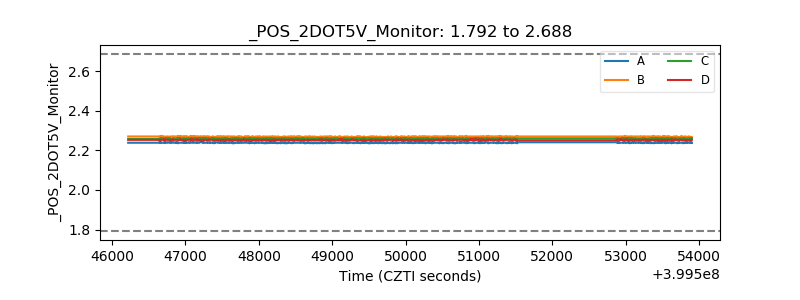 |
| +5 Volts monitor | 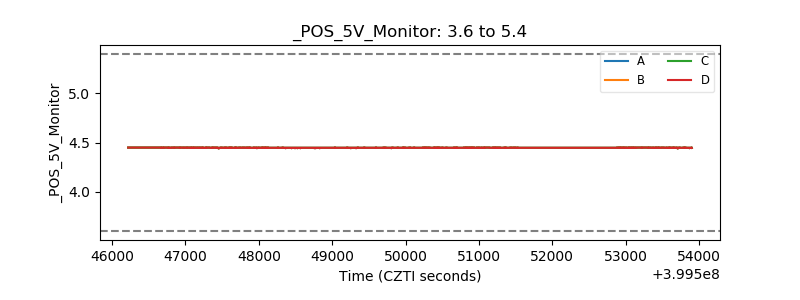 |
| _ROLL_ROT | 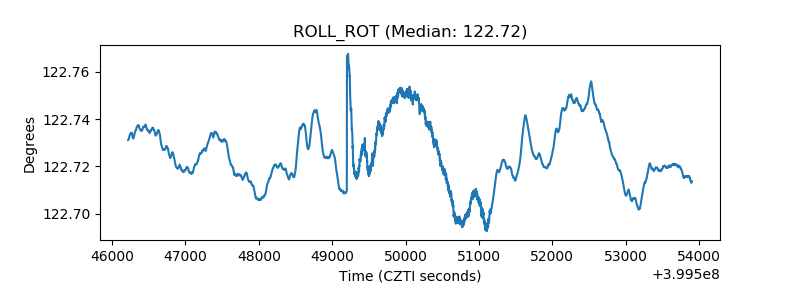 |
| _Roll_DEC | 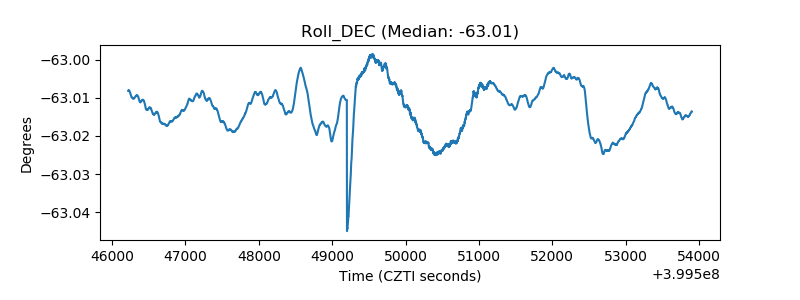 |
| _Roll_RA | 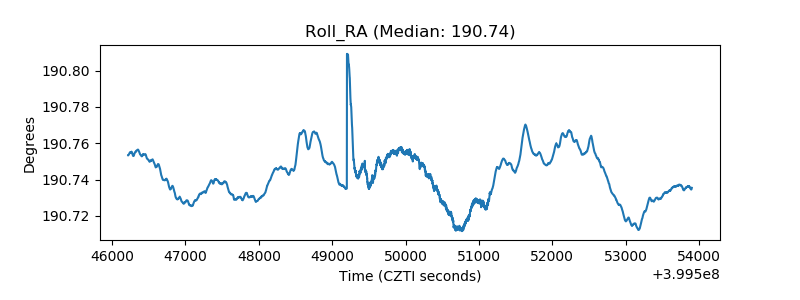 |
| Veto Counter | 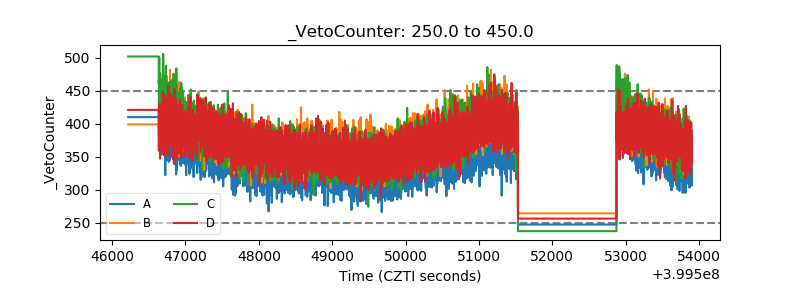 |