| Param | Original file | Final file |
|---|---|---|
| Filename | modeM0/AS1A09_002T01_9000005322_37425cztM0_level2.evt | modeM0/AS1A09_002T01_9000005322_37425cztM0_level2_quad_clean.evt |
| Size (bytes) | 613,667,520 | 83,367,360 |
| Size | 585.2 MB | 79.5 MB |
| Events in quadrant A | 3,395,874 | 542,988 |
| Events in quadrant B | 3,185,502 | 553,313 |
| Events in quadrant C | 3,200,899 | 562,539 |
| Events in quadrant D | 8,401,272 | 450,466 |
| Mode M0 | |||
|---|---|---|---|
| Quadrant | BADHDUFLAG | Total packets | Discarded packets |
| A | 0 | 13716 | 2 |
| B | 0 | 13370 | 1 |
| C | 0 | 13161 | 1 |
| D | 0 | 29140 | 1 |
| Mode M9 | |||
|---|---|---|---|
| Quadrant | BADHDUFLAG | Total packets | Discarded packets |
| A | 0 | 13 | 0 |
| B | 0 | 13 | 0 |
| C | 0 | 13 | 0 |
| D | 0 | 13 | 0 |
| Mode SS | |||
|---|---|---|---|
| Quadrant | BADHDUFLAG | Total packets | Discarded packets |
| A | 0 | 120 | 0 |
| B | 0 | 120 | 0 |
| C | 0 | 120 | 0 |
| D | 0 | 120 | 0 |
| Quadrant | Total seconds | Saturated seconds | Saturation percentage |
|---|---|---|---|
| A | 5937 | 88 | 1.482230% |
| B | 5937 | 81 | 1.364325% |
| C | 5937 | 54 | 0.909550% |
| D | 5937 | 1449 | 24.406266% |
Noise dominated data is calculated using 1-second bins in cleaned event files. If a bin has >2000 counts, and if more than 50% of those come from <1% of pixels, then it is considered to be noise-dominated and hence unusable.
| Quadrant | # 1 sec bins | Bins with >0 counts | Bins with >2000 counts | High rate bins dominated by noise | Noise dominated (total time) | Noise dominated (detector-on time) | Marked lightcurve |
|---|---|---|---|---|---|---|---|
| A | 7218 | 5937 | 74 | 74 | 1.03% | 1.25% | 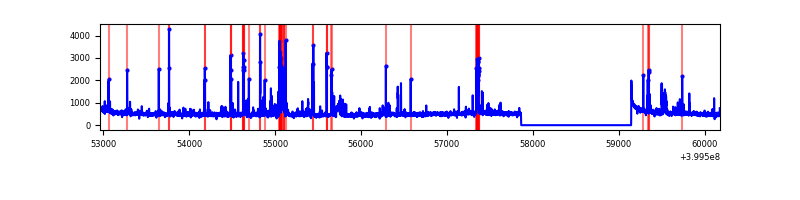 |
| B | 7219 | 5938 | 54 | 54 | 0.75% | 0.91% | 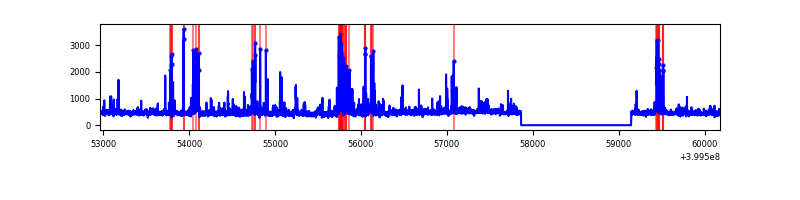 |
| C | 7219 | 5938 | 40 | 40 | 0.55% | 0.67% | 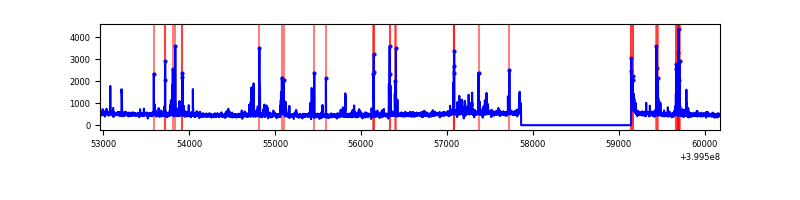 |
| D | 7219 | 5938 | 1434 | 1434 | 19.86% | 24.15% | 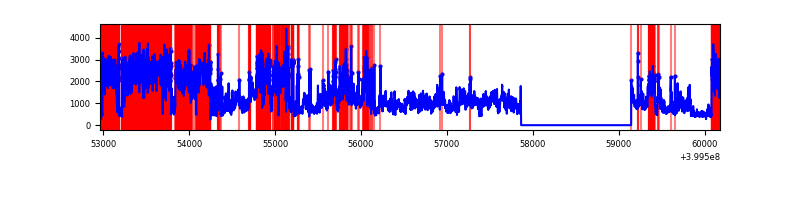 |
Top three noisy pixels from each quadrant. If the there are fewer than three noisy pixels in the level2.evt file, extra rows are filled as -1
| Pixel properties | Quadrant properties | ||||||
|---|---|---|---|---|---|---|---|
| Quadrant | DetID | PixID | Counts | Sigma | Mean | Median | Sigma |
| A | 10 | 83 | 280694 | 2093.35 | 662 | 649 | 133.8 |
| A | 15 | 222 | 248060 | 1849.41 | 662 | 649 | 133.8 |
| A | 9 | 143 | 237920 | 1773.61 | 662 | 649 | 133.8 |
| B | 5 | 172 | 285808 | 2272.76 | 656 | 637 | 125.5 |
| B | 4 | 171 | 127794 | 1013.42 | 656 | 637 | 125.5 |
| B | 5 | 255 | 56394 | 444.37 | 656 | 637 | 125.5 |
| C | 14 | 254 | 323338 | 2143.83 | 647 | 653 | 150.5 |
| C | 15 | 214 | 251997 | 1669.86 | 647 | 653 | 150.5 |
| C | 0 | 10 | 37730 | 246.33 | 647 | 653 | 150.5 |
| D | 12 | 227 | 4596410 | 31974.0 | 588 | 573 | 143.7 |
| D | 13 | 249 | 704498 | 4897.32 | 588 | 573 | 143.7 |
| D | 10 | 253 | 281156 | 1952.06 | 588 | 573 | 143.7 |
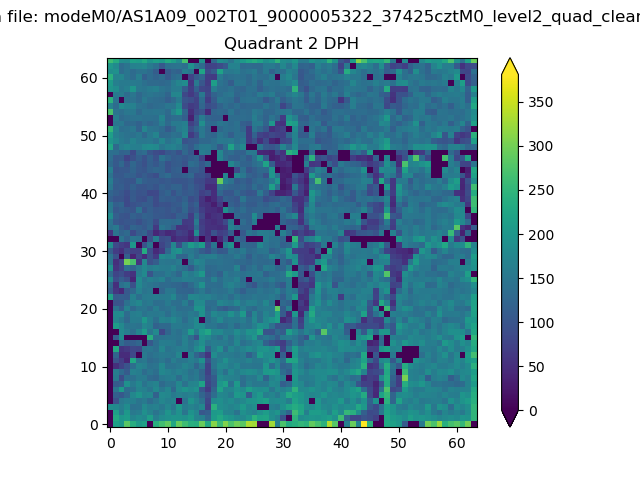
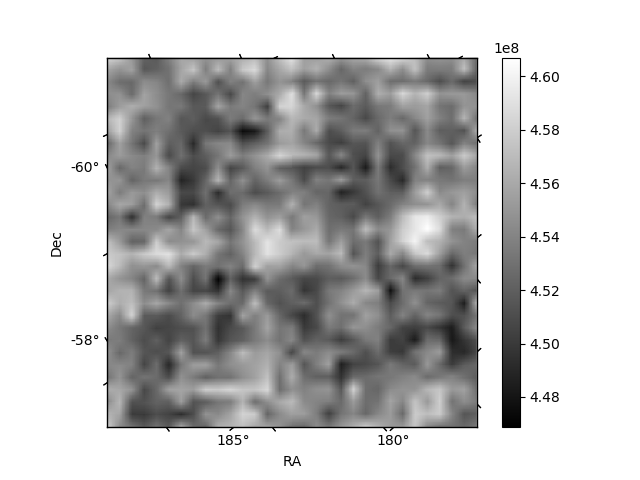
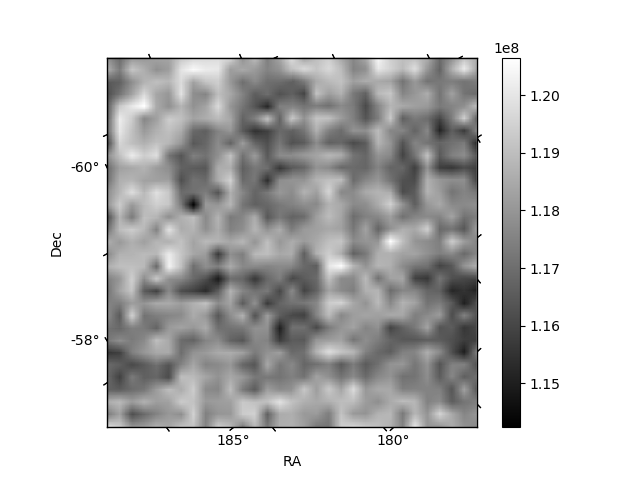
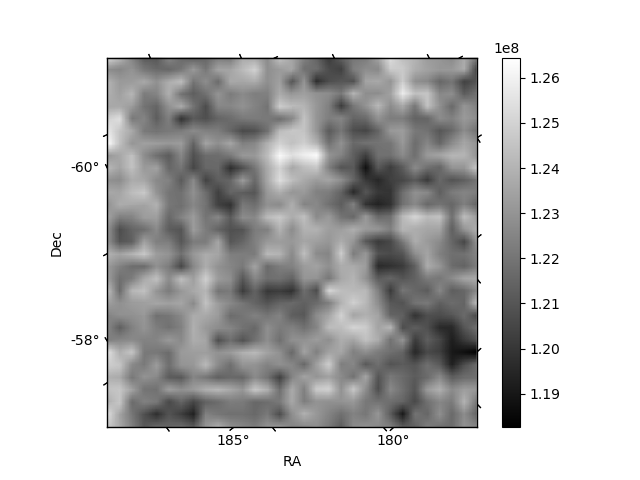
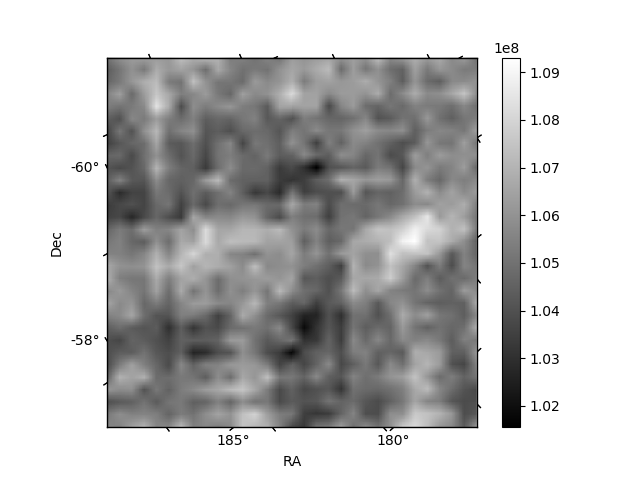
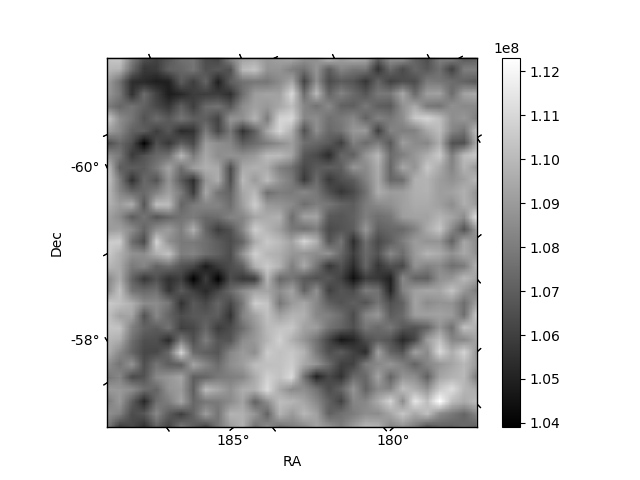
Histogram calculated using DETX and DETY for each event in the final _common_clean file
| Quadrant A | 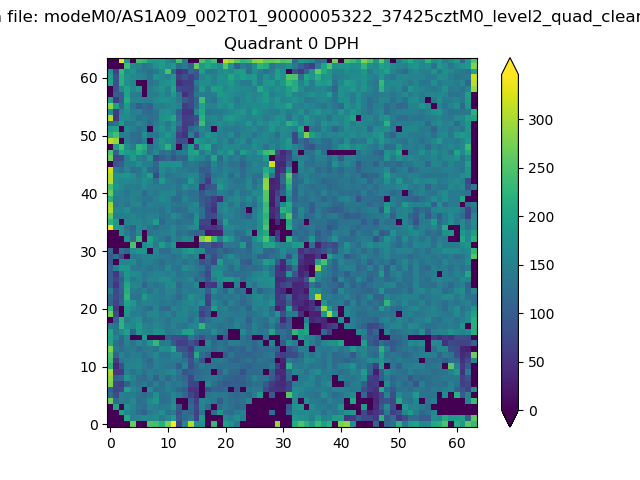 |
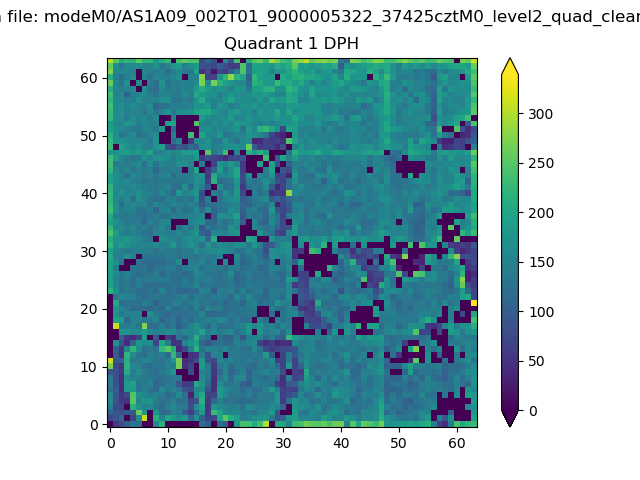 |
Quadrant B |
|---|---|---|---|
| Quadrant D | 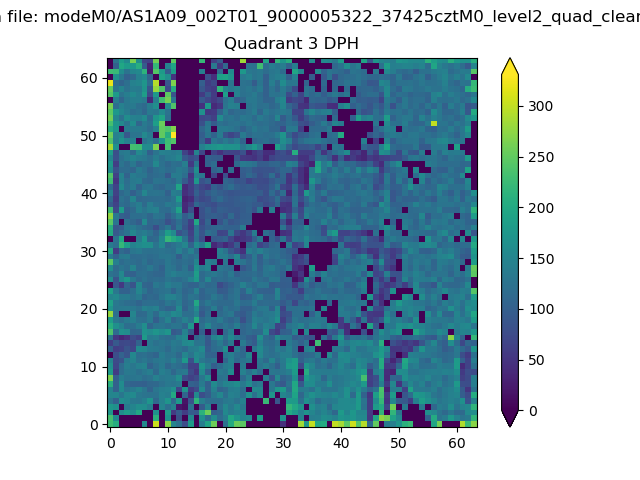 |
 |
Quadrant C |
| Plot type | Count rate plots | Images |
|---|---|---|
| Comparison with Poisson distribution Blue bars denote a histogram of data divided into 1 sec bins. Red curve is a Poisson curve with rate = median count rate of data. |
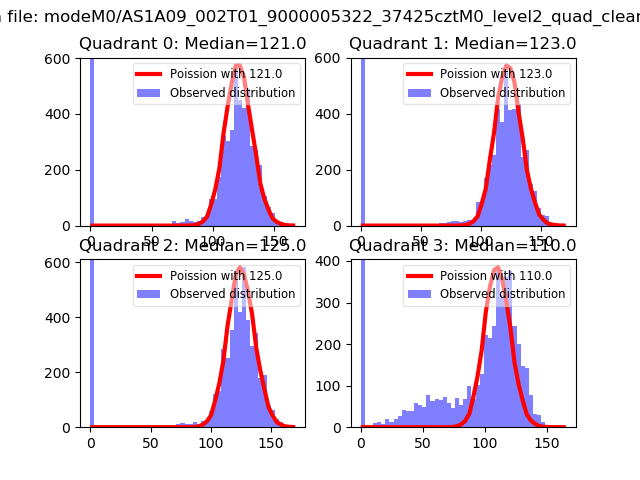 |
 |
| Quadrant-wise count rates Data is divided into 100 sec bins |
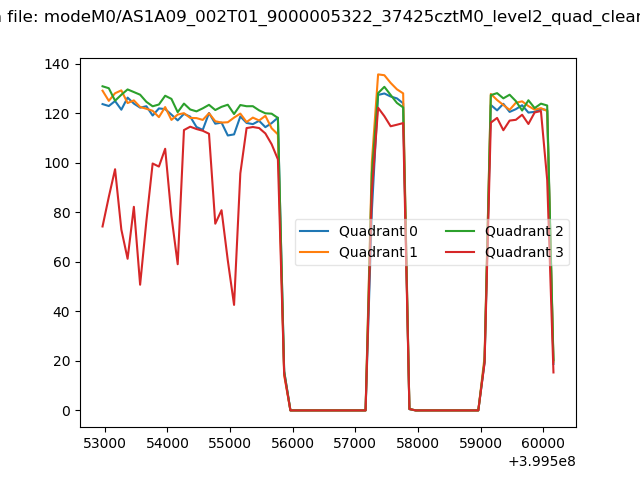 |
|
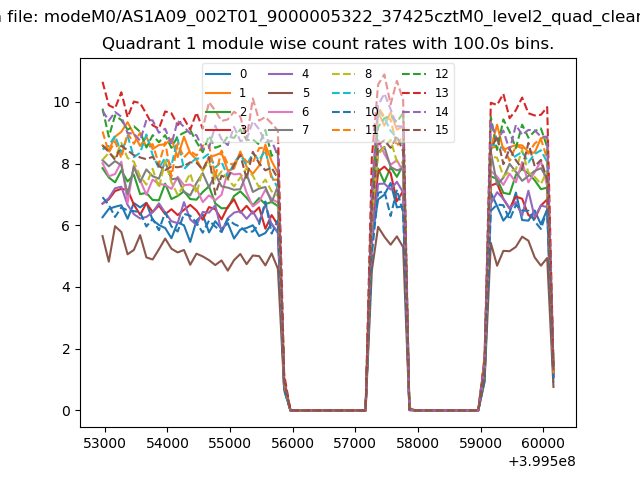
| Module-wise count rates for Quadrant A Data is divided into 100 sec bins |
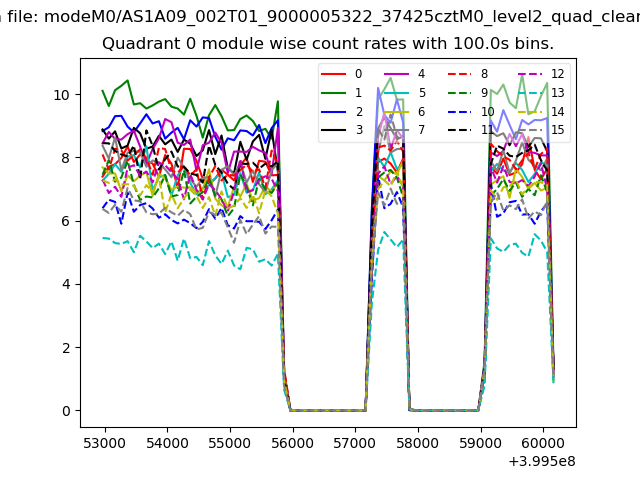 |
 |
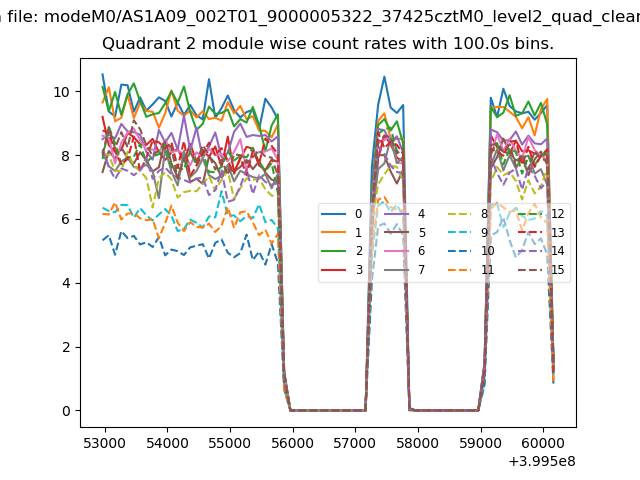
| Module-wise count rates for Quadrant B Data is divided into 100 sec bins |
 |
 |
| Module-wise count rates for Quadrant C Data is divided into 100 sec bins |
 |
 |
| Module-wise count rates for Quadrant D Data is divided into 100 sec bins |
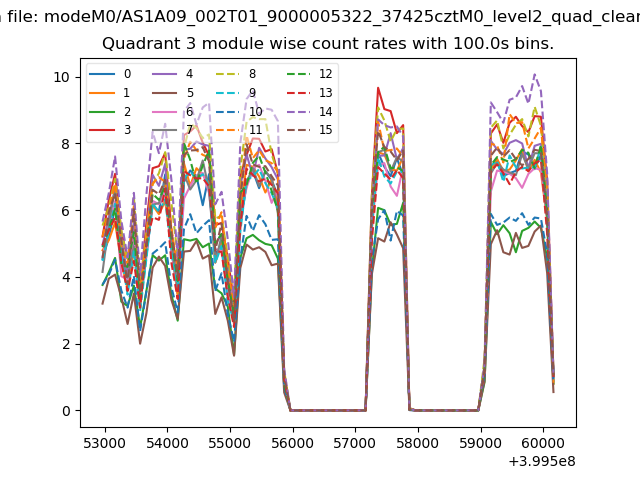 |
 |
| Parameter | Plot |
|---|---|
| CZT HV Monitor | 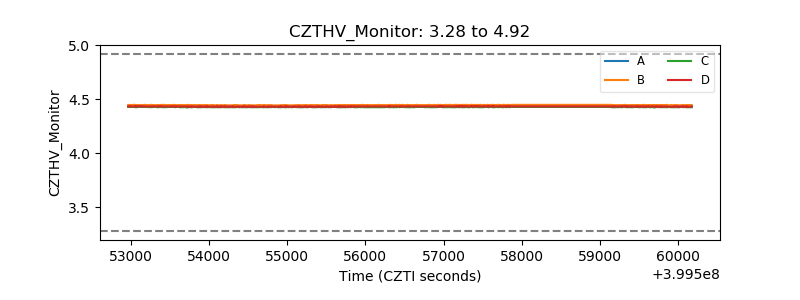 |
| D_VDD | 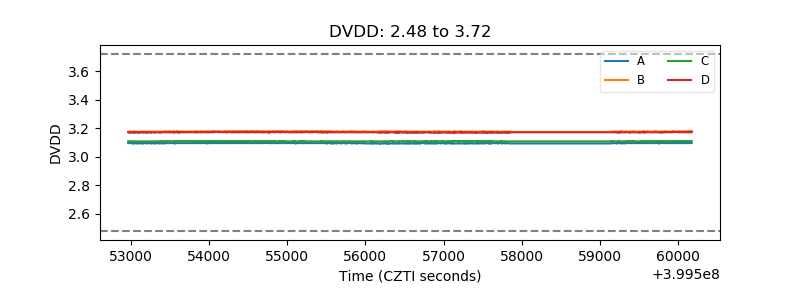 |
| Temperature 1 | 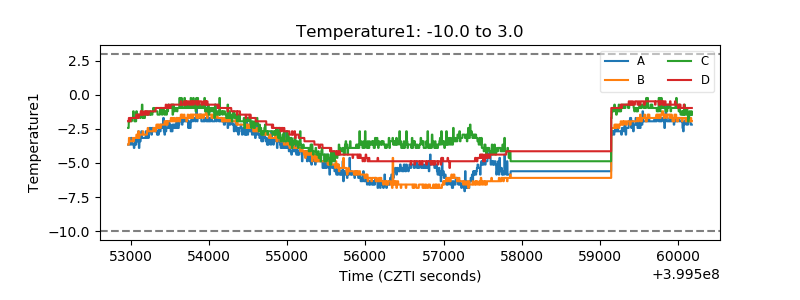 |
| Veto HV Monitor | 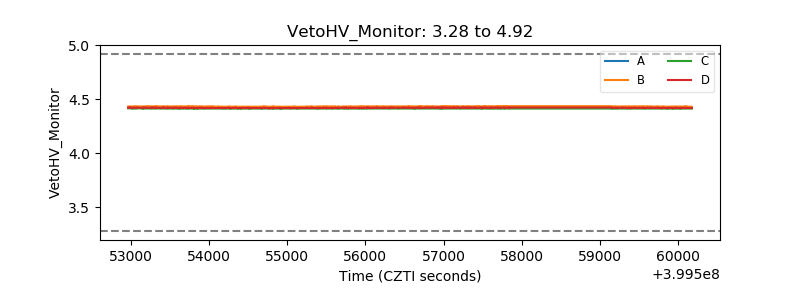 |
| Veto LLD | 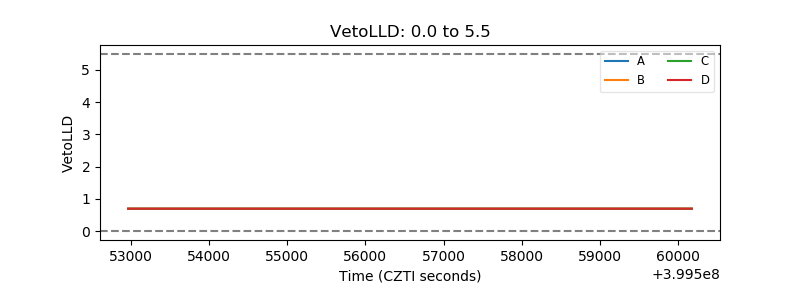 |
| Alpha Counter | 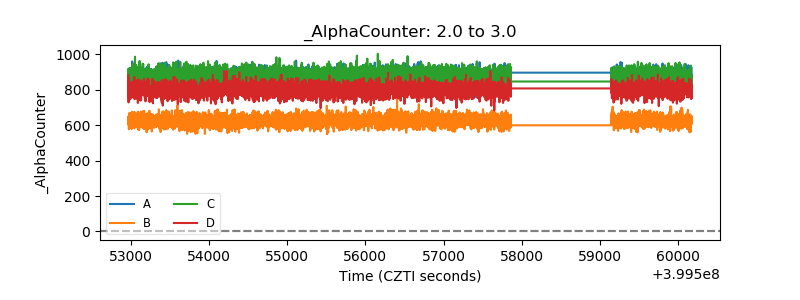 |
| _CPM_Rate | 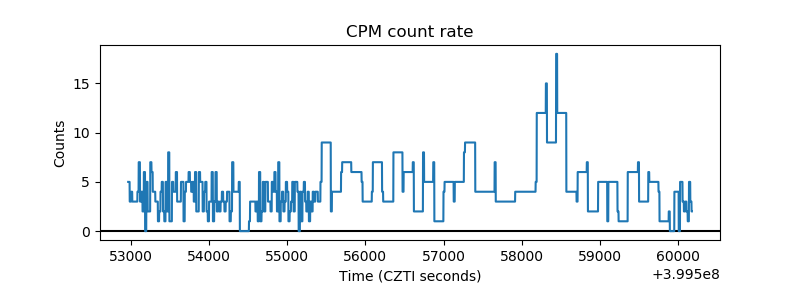 |
| CZT Counter | 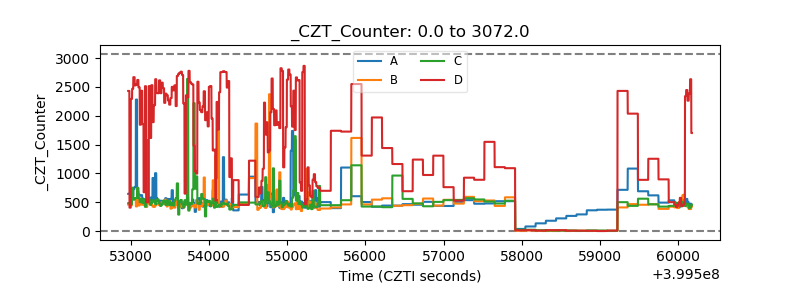 |
| +2.5 Volts monitor | 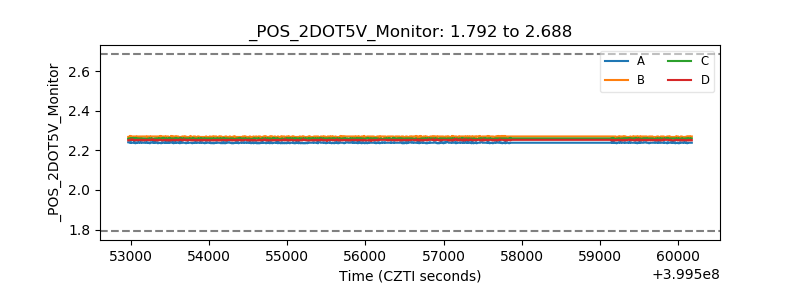 |
| +5 Volts monitor | 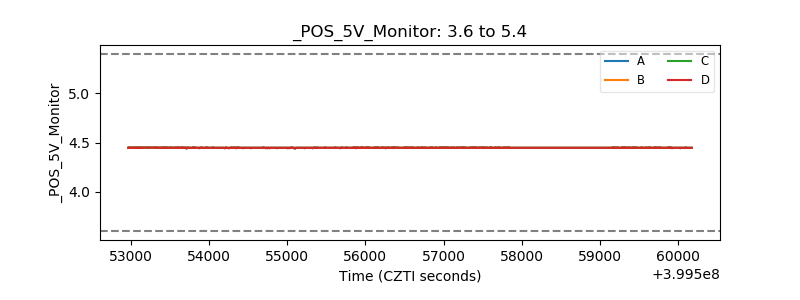 |
| _ROLL_ROT | 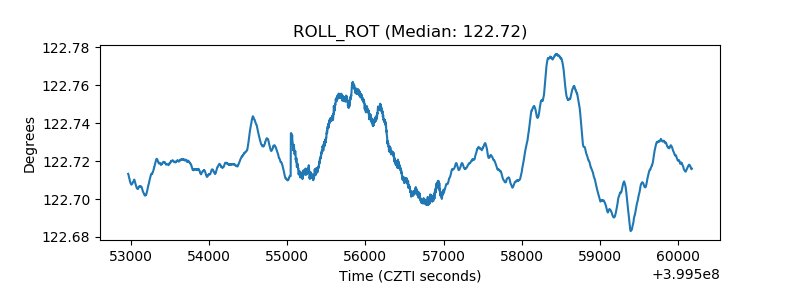 |
| _Roll_DEC | 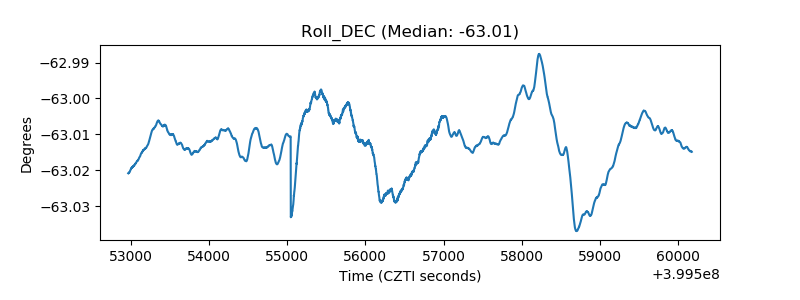 |
| _Roll_RA | 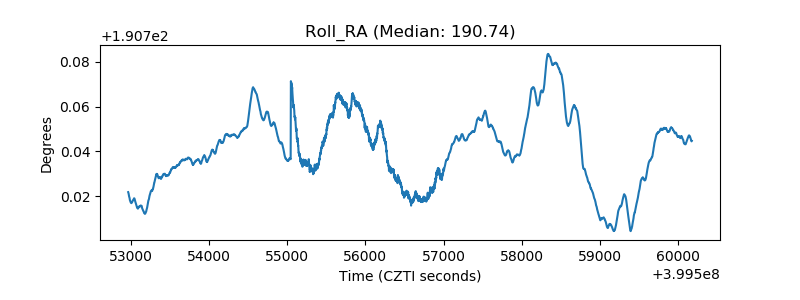 |
| Veto Counter | 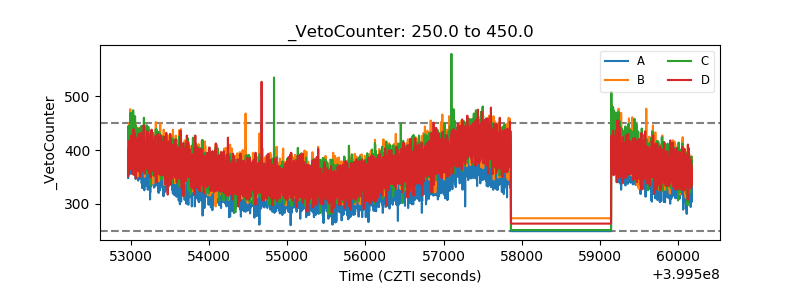 |