| Param | Original file | Final file |
|---|---|---|
| Filename | modeM0/AS1A09_002T01_9000005322_37427cztM0_level2.evt | modeM0/AS1A09_002T01_9000005322_37427cztM0_level2_quad_clean.evt |
| Size (bytes) | 926,997,120 | 145,785,600 |
| Size | 884.1 MB | 139.0 MB |
| Events in quadrant A | 5,811,932 | 932,430 |
| Events in quadrant B | 5,555,949 | 943,538 |
| Events in quadrant C | 5,996,948 | 946,471 |
| Events in quadrant D | 9,997,991 | 862,989 |
| Mode M0 | |||
|---|---|---|---|
| Quadrant | BADHDUFLAG | Total packets | Discarded packets |
| A | 0 | 23734 | 3 |
| B | 0 | 23586 | 2 |
| C | 0 | 24538 | 2 |
| D | 0 | 36795 | 2 |
| Mode M9 | |||
|---|---|---|---|
| Quadrant | BADHDUFLAG | Total packets | Discarded packets |
| A | 0 | 27 | 0 |
| B | 0 | 27 | 0 |
| C | 0 | 27 | 0 |
| D | 0 | 27 | 0 |
| Mode SS | |||
|---|---|---|---|
| Quadrant | BADHDUFLAG | Total packets | Discarded packets |
| A | 0 | 214 | 0 |
| B | 0 | 214 | 0 |
| C | 0 | 214 | 0 |
| D | 0 | 214 | 0 |
| Quadrant | Total seconds | Saturated seconds | Saturation percentage |
|---|---|---|---|
| A | 10535 | 112 | 1.063123% |
| B | 10535 | 156 | 1.480778% |
| C | 10535 | 239 | 2.268628% |
| D | 10535 | 1260 | 11.960133% |
Noise dominated data is calculated using 1-second bins in cleaned event files. If a bin has >2000 counts, and if more than 50% of those come from <1% of pixels, then it is considered to be noise-dominated and hence unusable.
| Quadrant | # 1 sec bins | Bins with >0 counts | Bins with >2000 counts | High rate bins dominated by noise | Noise dominated (total time) | Noise dominated (detector-on time) | Marked lightcurve |
|---|---|---|---|---|---|---|---|
| A | 13250 | 10537 | 78 | 78 | 0.59% | 0.74% | 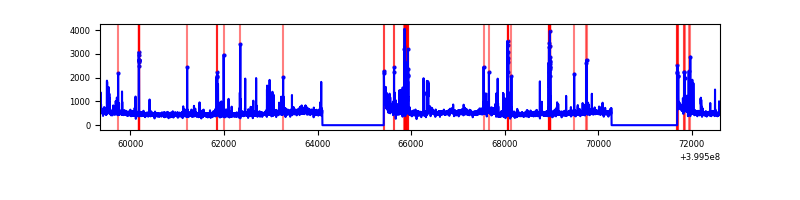 |
| B | 13250 | 10537 | 100 | 100 | 0.75% | 0.95% | 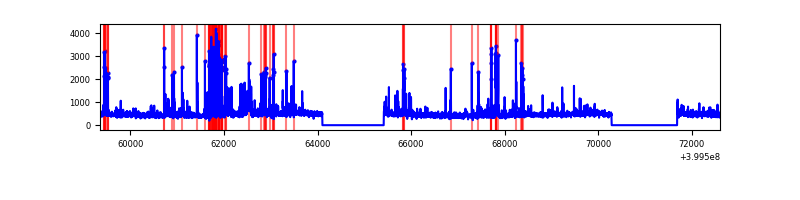 |
| C | 13250 | 10537 | 215 | 215 | 1.62% | 2.04% | 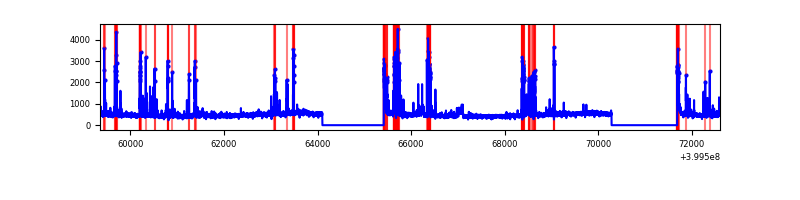 |
| D | 13250 | 10537 | 1371 | 1371 | 10.35% | 13.01% | 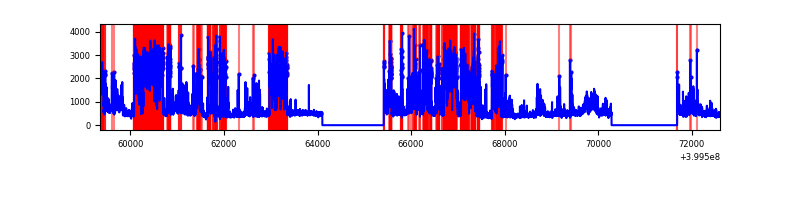 |
Top three noisy pixels from each quadrant. If the there are fewer than three noisy pixels in the level2.evt file, extra rows are filled as -1
| Pixel properties | Quadrant properties | ||||||
|---|---|---|---|---|---|---|---|
| Quadrant | DetID | PixID | Counts | Sigma | Mean | Median | Sigma |
| A | 10 | 83 | 473713 | 1993.0 | 1168 | 1145 | 237.1 |
| A | 15 | 222 | 394911 | 1660.66 | 1168 | 1145 | 237.1 |
| A | 9 | 143 | 327338 | 1375.68 | 1168 | 1145 | 237.1 |
| B | 5 | 172 | 419754 | 1905.36 | 1157 | 1128 | 219.7 |
| B | 4 | 171 | 292383 | 1325.64 | 1157 | 1128 | 219.7 |
| B | 5 | 255 | 50165 | 223.19 | 1157 | 1128 | 219.7 |
| C | 14 | 254 | 893943 | 3397.84 | 1131 | 1138 | 262.8 |
| C | 15 | 214 | 437809 | 1661.88 | 1131 | 1138 | 262.8 |
| C | 0 | 10 | 136812 | 516.35 | 1131 | 1138 | 262.8 |
| D | 12 | 227 | 4373691 | 16218.8 | 1105 | 1075 | 269.6 |
| D | 12 | 235 | 500292 | 1851.68 | 1105 | 1075 | 269.6 |
| D | 2 | 249 | 239437 | 884.13 | 1105 | 1075 | 269.6 |
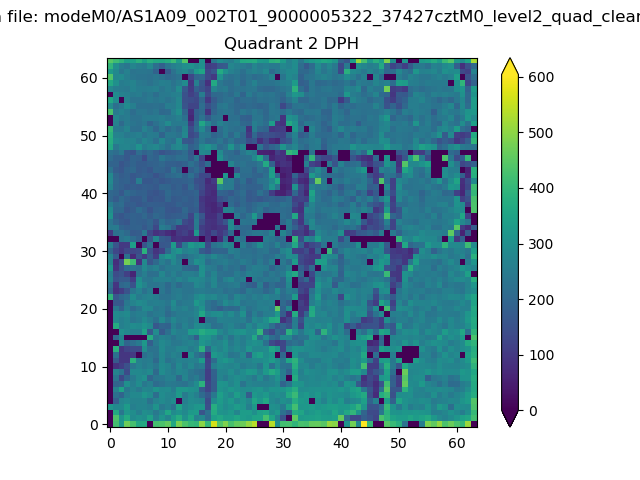
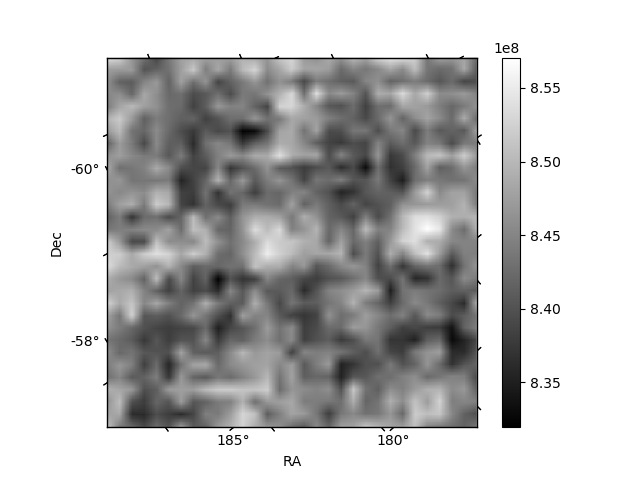
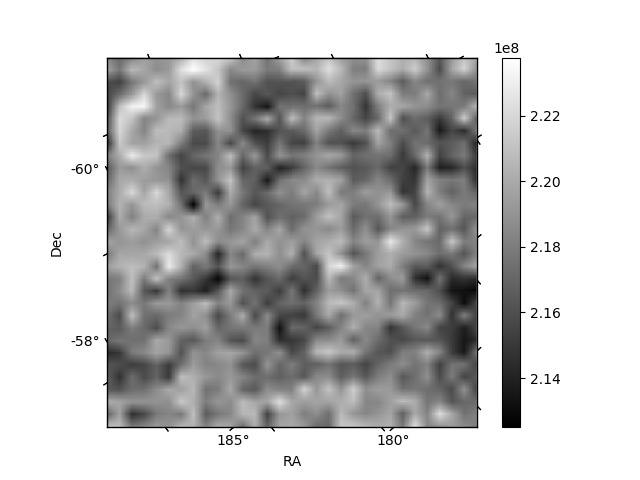
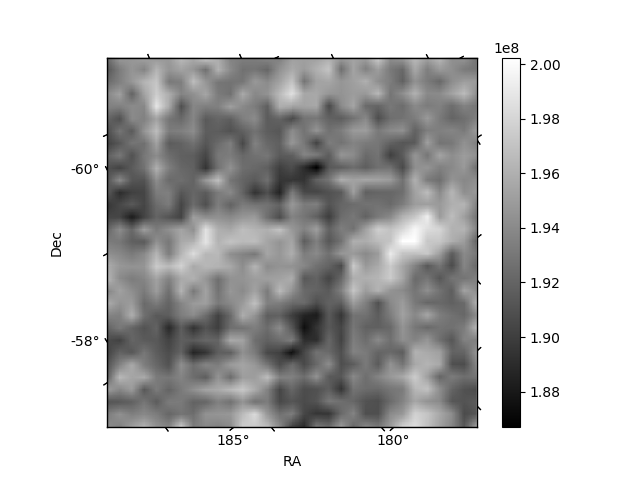
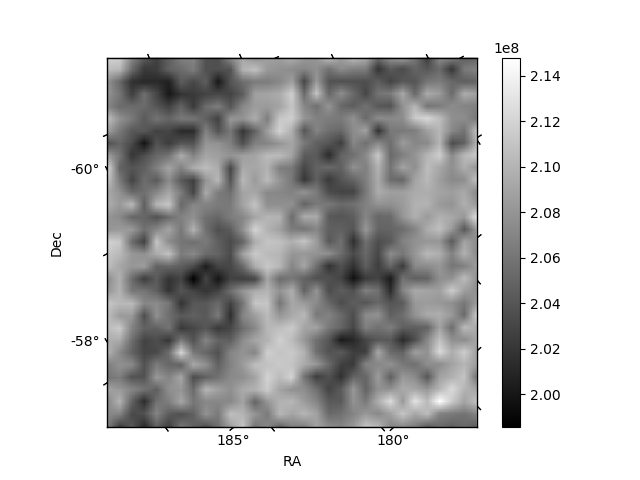
Histogram calculated using DETX and DETY for each event in the final _common_clean file
| Quadrant A | 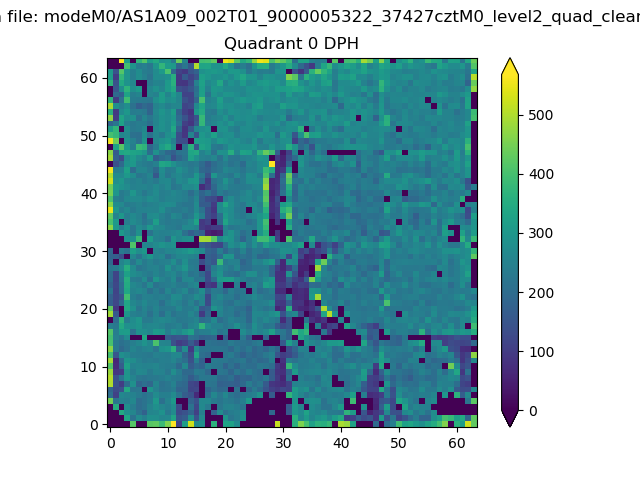 |
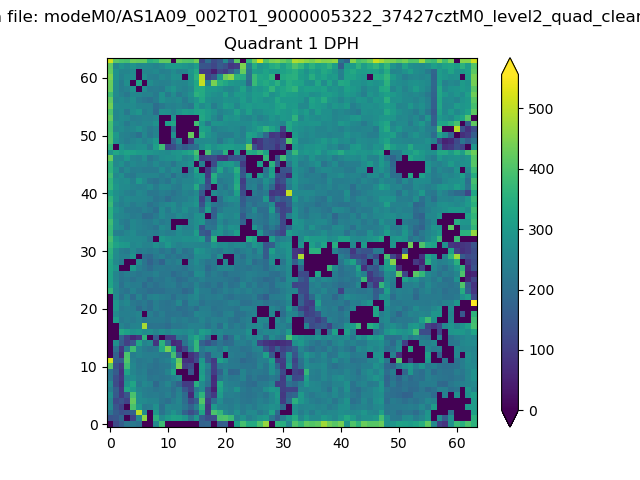 |
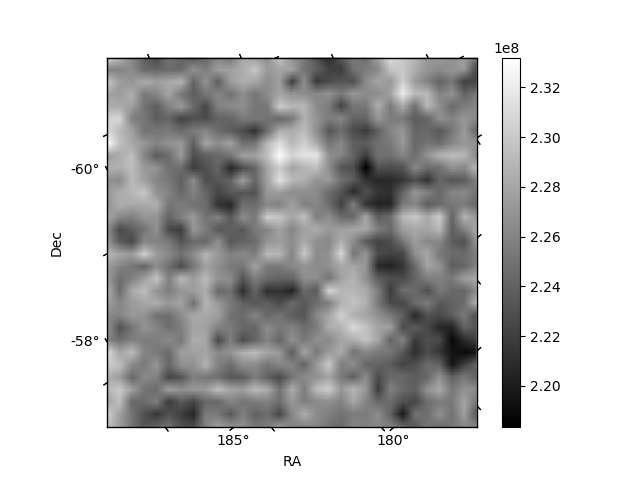
Quadrant B |
|---|---|---|---|
| Quadrant D | 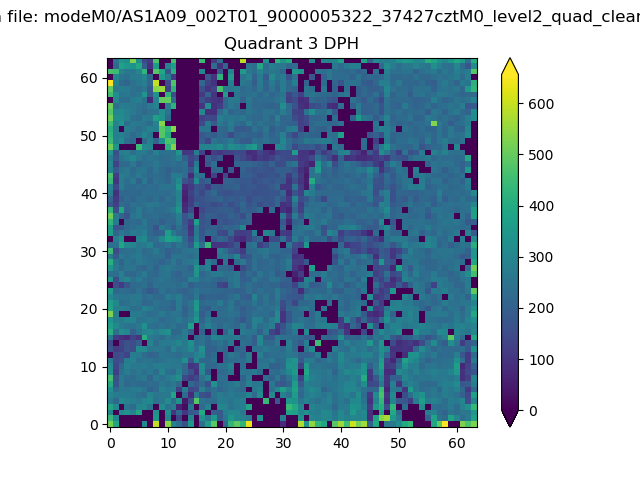 |
 |
Quadrant C |
| Plot type | Count rate plots | Images |
|---|---|---|
| Comparison with Poisson distribution Blue bars denote a histogram of data divided into 1 sec bins. Red curve is a Poisson curve with rate = median count rate of data. |
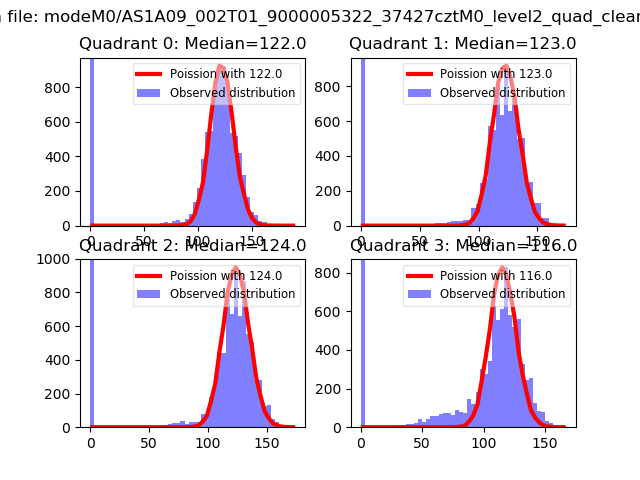 |
 |
| Quadrant-wise count rates Data is divided into 100 sec bins |
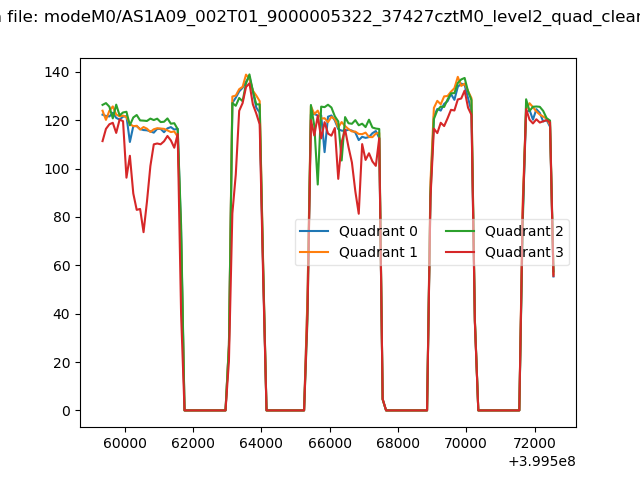 |
|
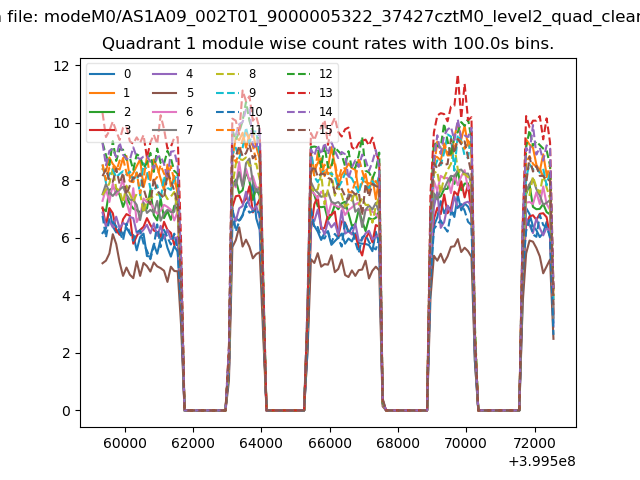
| Module-wise count rates for Quadrant A Data is divided into 100 sec bins |
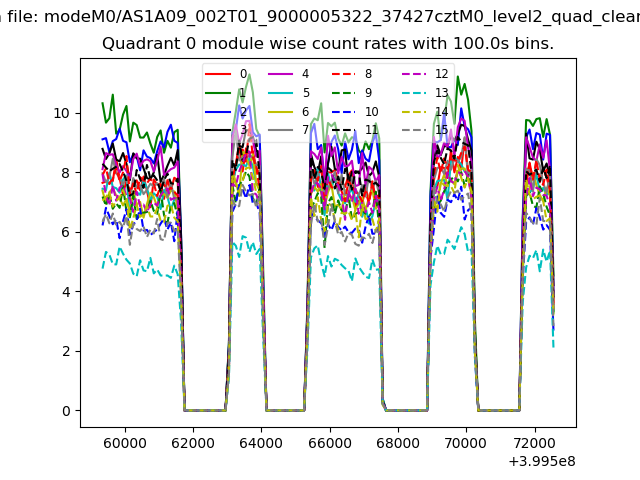 |
 |
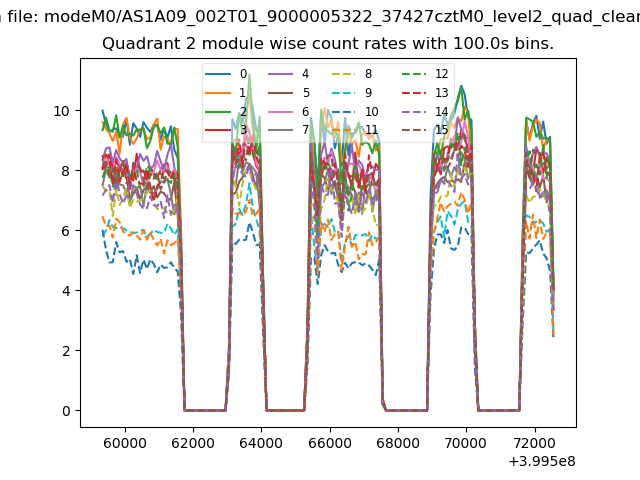
| Module-wise count rates for Quadrant B Data is divided into 100 sec bins |
 |
 |
| Module-wise count rates for Quadrant C Data is divided into 100 sec bins |
 |
 |
| Module-wise count rates for Quadrant D Data is divided into 100 sec bins |
 |
 |
| Parameter | Plot |
|---|---|
| CZT HV Monitor | 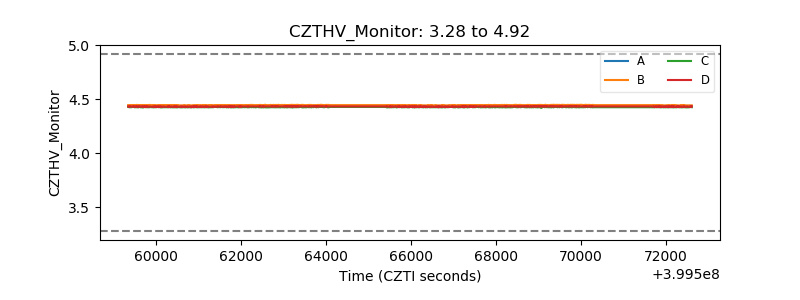 |
| D_VDD | 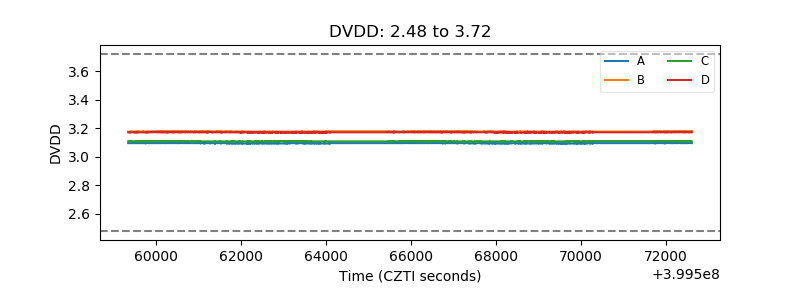 |
| Temperature 1 | 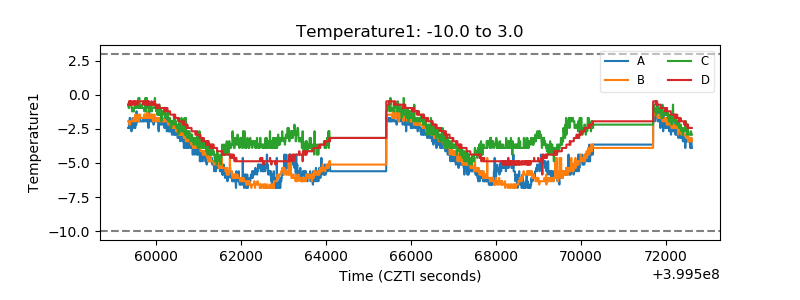 |
| Veto HV Monitor | 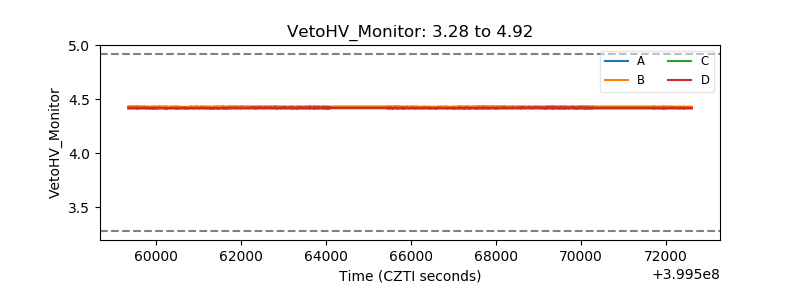 |
| Veto LLD | 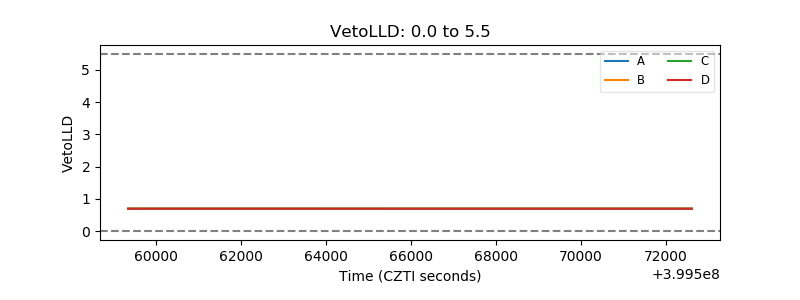 |
| Alpha Counter | 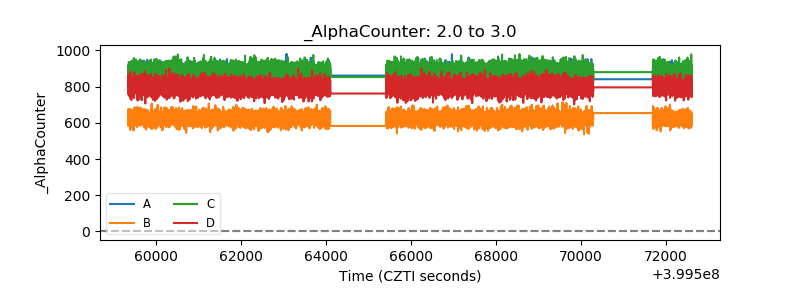 |
| _CPM_Rate | 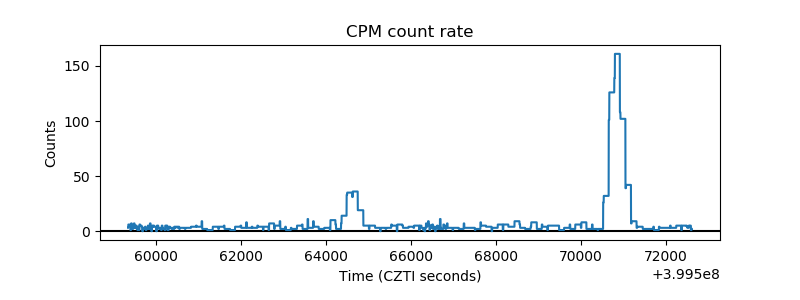 |
| CZT Counter | 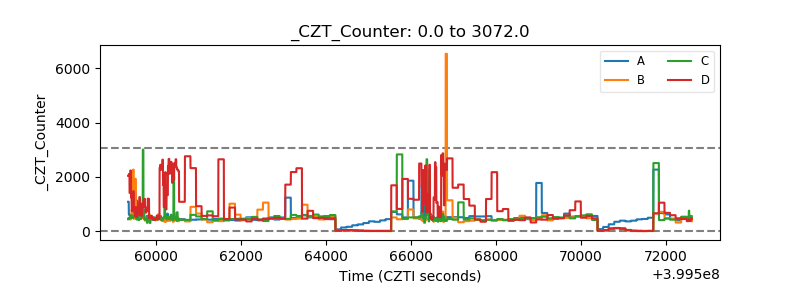 |
| +2.5 Volts monitor | 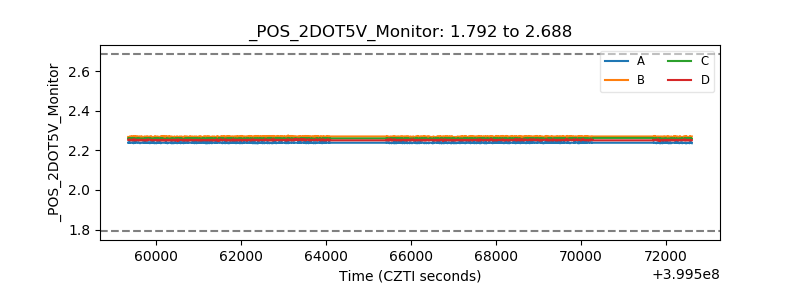 |
| +5 Volts monitor | 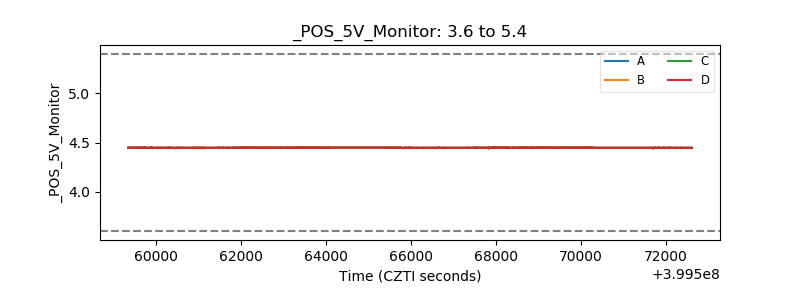 |
| _ROLL_ROT | 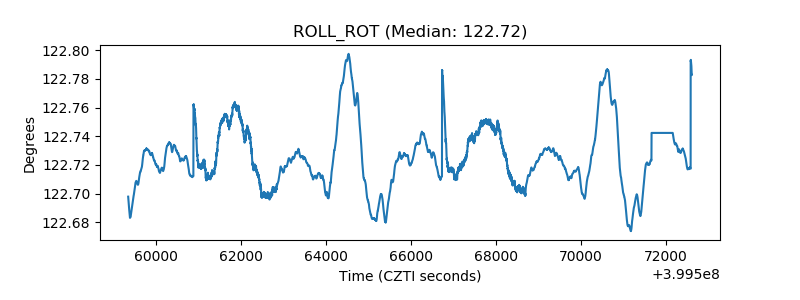 |
| _Roll_DEC | 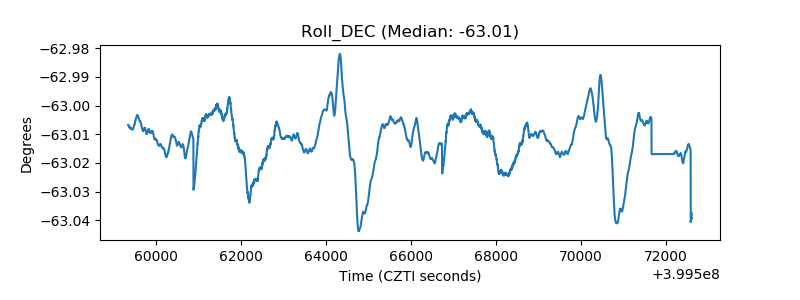 |
| _Roll_RA | 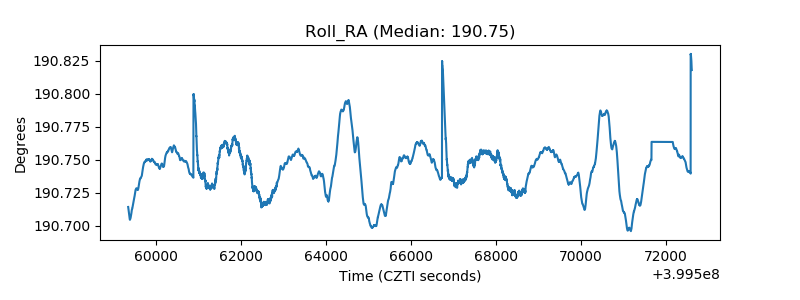 |
| Veto Counter | 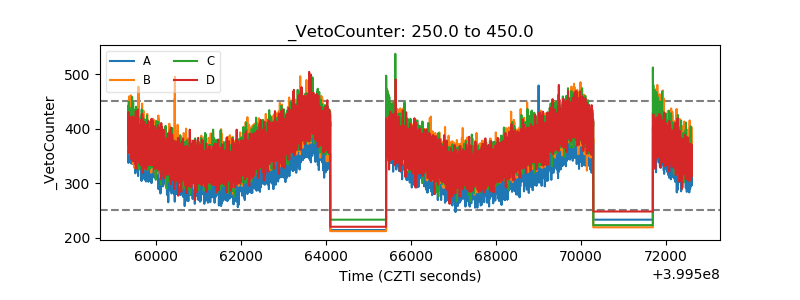 |