| Param | Original file | Final file |
|---|---|---|
| Filename | modeM0/AS1A09_002T01_9000005322_37428cztM0_level2.evt | modeM0/AS1A09_002T01_9000005322_37428cztM0_level2_quad_clean.evt |
| Size (bytes) | 439,208,640 | 82,558,080 |
| Size | 418.9 MB | 78.7 MB |
| Events in quadrant A | 2,996,770 | 528,459 |
| Events in quadrant B | 3,468,716 | 523,486 |
| Events in quadrant C | 2,967,792 | 534,171 |
| Events in quadrant D | 3,477,602 | 511,792 |
| Mode M0 | |||
|---|---|---|---|
| Quadrant | BADHDUFLAG | Total packets | Discarded packets |
| A | 0 | 12559 | 3 |
| B | 0 | 14166 | 2 |
| C | 0 | 12483 | 2 |
| D | 0 | 14365 | 2 |
| Mode M9 | |||
|---|---|---|---|
| Quadrant | BADHDUFLAG | Total packets | Discarded packets |
| A | 0 | 23 | 0 |
| B | 0 | 23 | 0 |
| C | 0 | 23 | 0 |
| D | 0 | 24 | 0 |
| Mode SS | |||
|---|---|---|---|
| Quadrant | BADHDUFLAG | Total packets | Discarded packets |
| A | 0 | 118 | 0 |
| B | 0 | 118 | 0 |
| C | 0 | 118 | 0 |
| D | 0 | 118 | 0 |
| Quadrant | Total seconds | Saturated seconds | Saturation percentage |
|---|---|---|---|
| A | 5747 | 30 | 0.522011% |
| B | 5747 | 223 | 3.880285% |
| C | 5747 | 50 | 0.870019% |
| D | 5747 | 100 | 1.740038% |
Noise dominated data is calculated using 1-second bins in cleaned event files. If a bin has >2000 counts, and if more than 50% of those come from <1% of pixels, then it is considered to be noise-dominated and hence unusable.
| Quadrant | # 1 sec bins | Bins with >0 counts | Bins with >2000 counts | High rate bins dominated by noise | Noise dominated (total time) | Noise dominated (detector-on time) | Marked lightcurve |
|---|---|---|---|---|---|---|---|
| A | 7270 | 5748 | 15 | 15 | 0.21% | 0.26% | 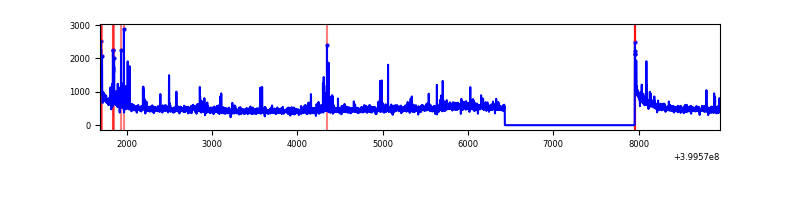 |
| B | 7270 | 5748 | 162 | 162 | 2.23% | 2.82% | 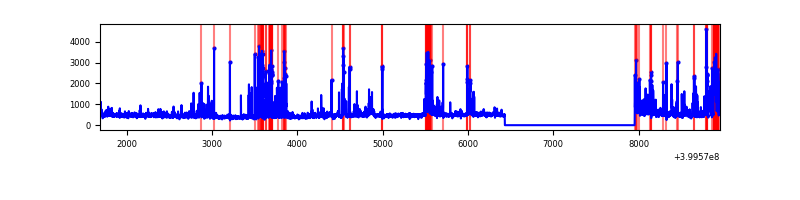 |
| C | 7270 | 5748 | 50 | 50 | 0.69% | 0.87% | 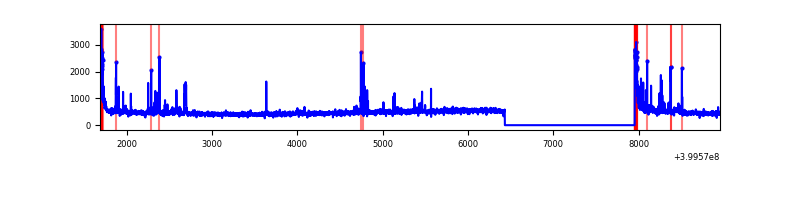 |
| D | 7270 | 5748 | 87 | 87 | 1.20% | 1.51% |  |
Top three noisy pixels from each quadrant. If the there are fewer than three noisy pixels in the level2.evt file, extra rows are filled as -1
| Pixel properties | Quadrant properties | ||||||
|---|---|---|---|---|---|---|---|
| Quadrant | DetID | PixID | Counts | Sigma | Mean | Median | Sigma |
| A | 10 | 83 | 312722 | 2392.14 | 636 | 624 | 130.5 |
| A | 9 | 143 | 110581 | 842.79 | 636 | 624 | 130.5 |
| A | 15 | 222 | 27019 | 202.31 | 636 | 624 | 130.5 |
| B | 5 | 172 | 354711 | 2963.63 | 622 | 606 | 119.5 |
| B | 0 | 189 | 306496 | 2560.1 | 622 | 606 | 119.5 |
| B | 4 | 171 | 209748 | 1750.39 | 622 | 606 | 119.5 |
| C | 15 | 214 | 241577 | 1682.67 | 615 | 619 | 143.2 |
| C | 0 | 10 | 153962 | 1070.83 | 615 | 619 | 143.2 |
| C | 14 | 254 | 145031 | 1008.47 | 615 | 619 | 143.2 |
| D | 2 | 153 | 270660 | 1779.72 | 615 | 598 | 151.7 |
| D | 12 | 235 | 169683 | 1114.28 | 615 | 598 | 151.7 |
| D | 10 | 253 | 165792 | 1088.64 | 615 | 598 | 151.7 |
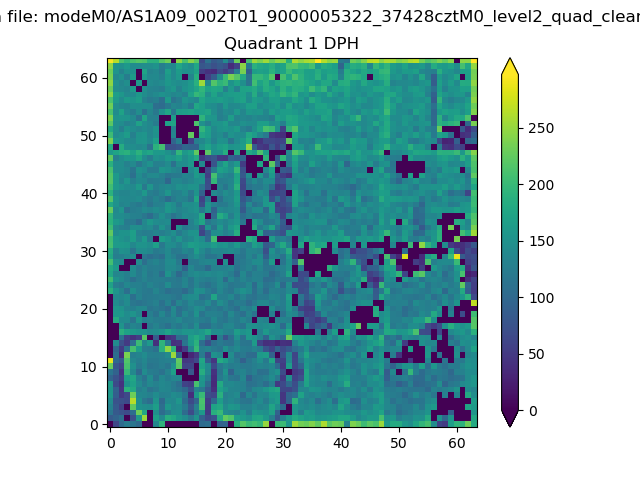
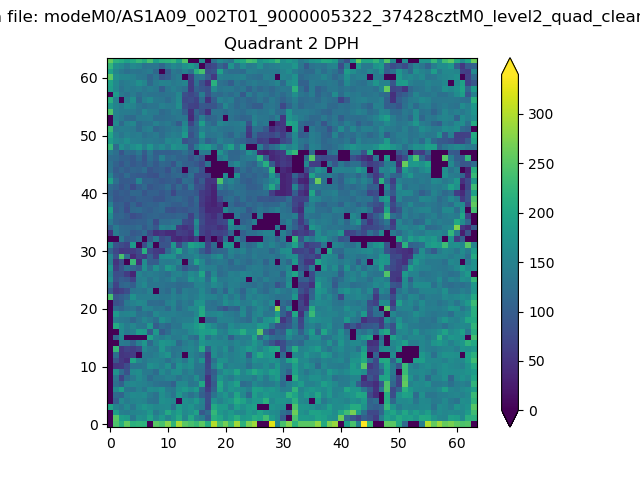
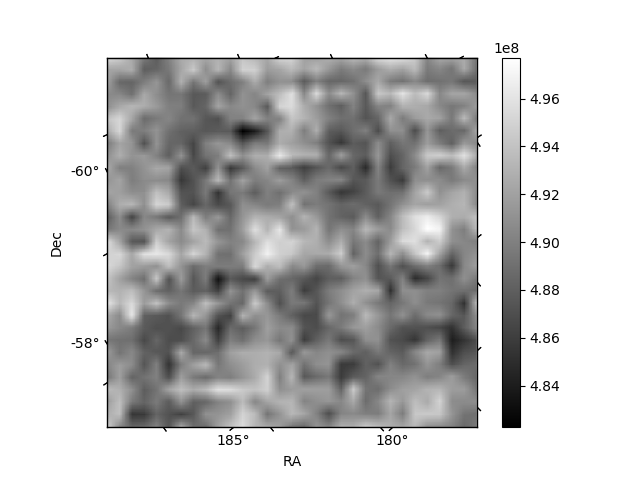
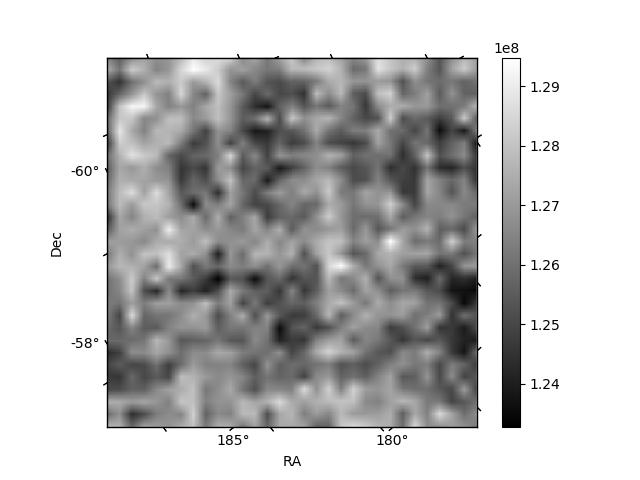
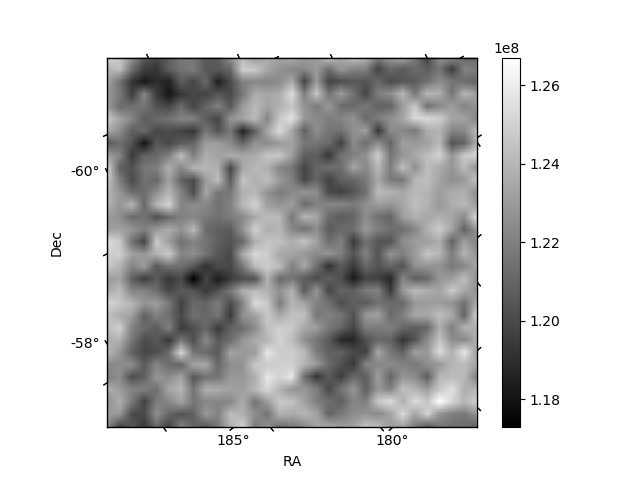
Histogram calculated using DETX and DETY for each event in the final _common_clean file
| Quadrant A | 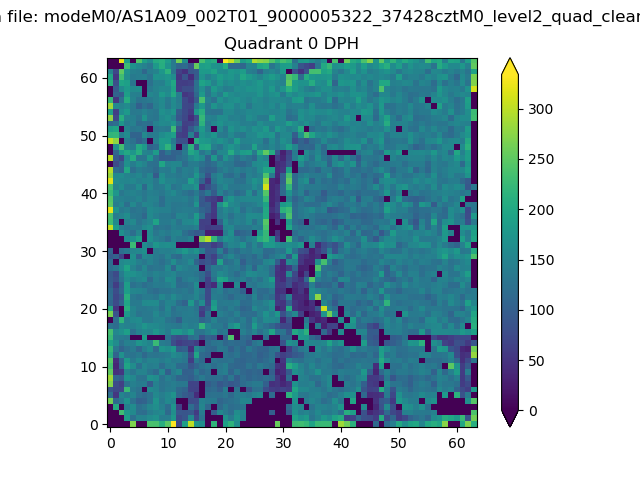 |
 |
Quadrant B |
|---|---|---|---|
| Quadrant D | 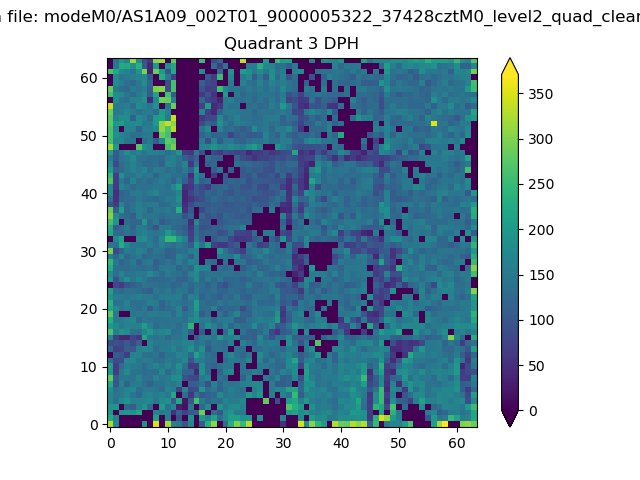 |
 |
Quadrant C |
| Plot type | Count rate plots | Images |
|---|---|---|
| Comparison with Poisson distribution Blue bars denote a histogram of data divided into 1 sec bins. Red curve is a Poisson curve with rate = median count rate of data. |
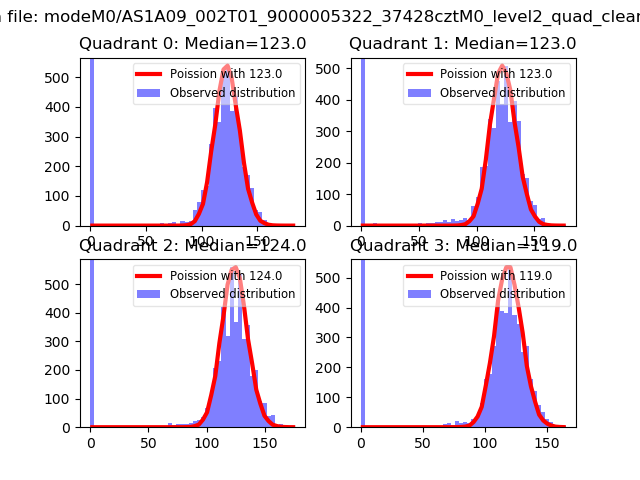 |
 |
| Quadrant-wise count rates Data is divided into 100 sec bins |
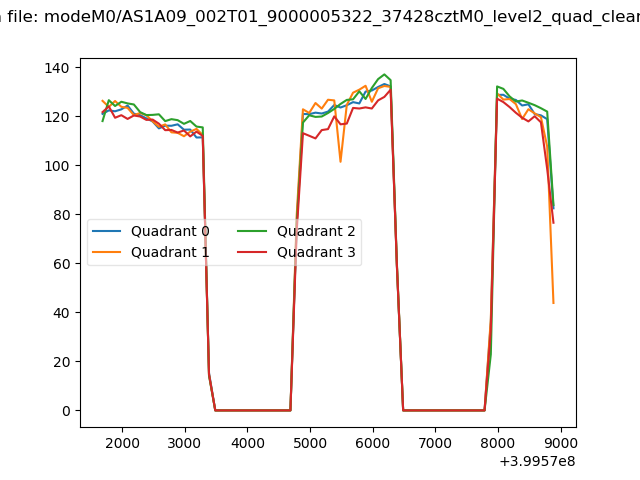 |
|
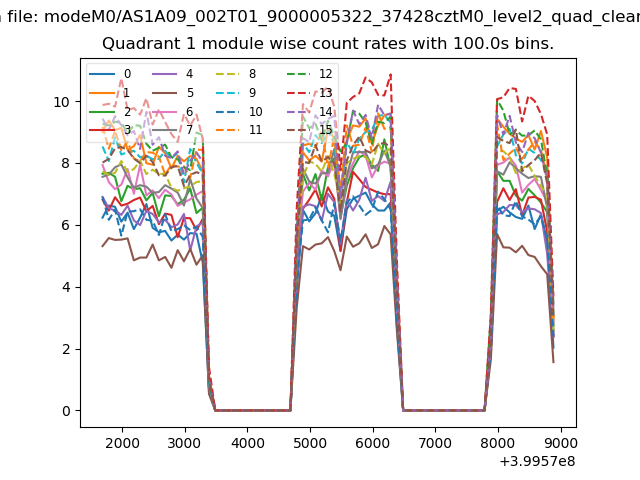
| Module-wise count rates for Quadrant A Data is divided into 100 sec bins |
 |
 |
| Module-wise count rates for Quadrant B Data is divided into 100 sec bins |
 |
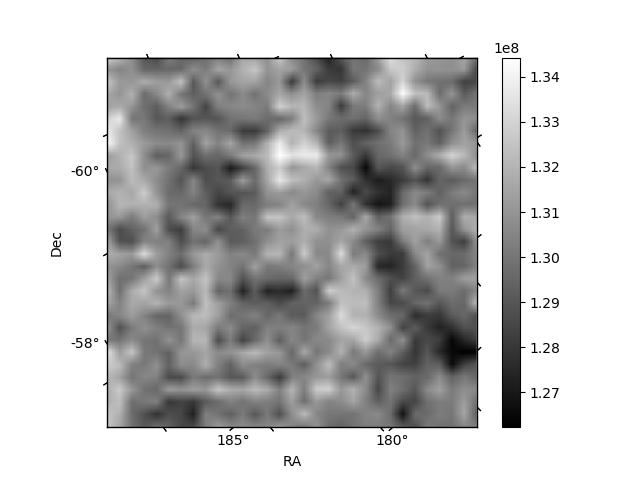 |
| Module-wise count rates for Quadrant C Data is divided into 100 sec bins |
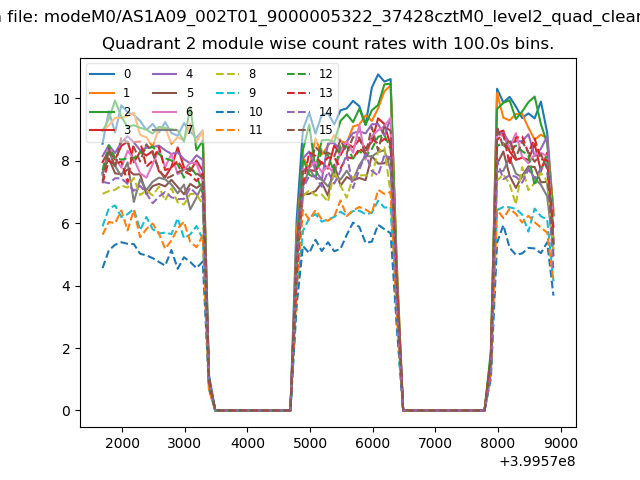 |
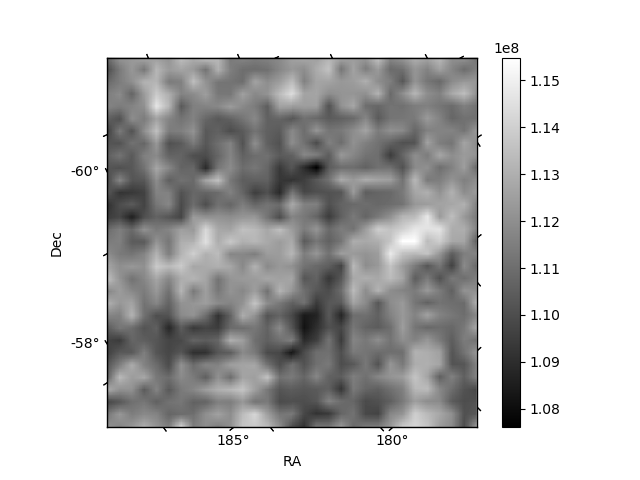 |
| Module-wise count rates for Quadrant D Data is divided into 100 sec bins |
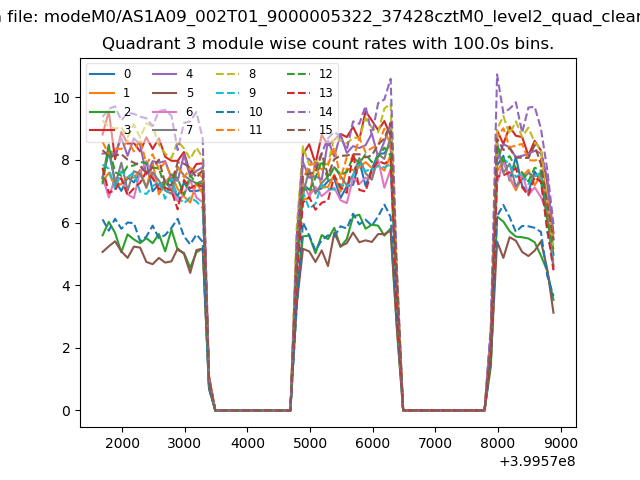 |
 |
| Parameter | Plot |
|---|---|
| CZT HV Monitor |  |
| D_VDD | 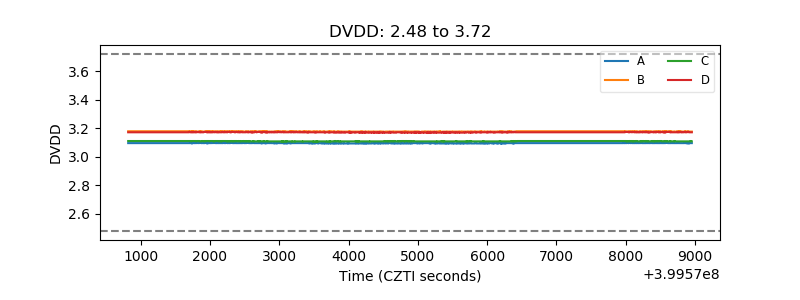 |
| Temperature 1 | 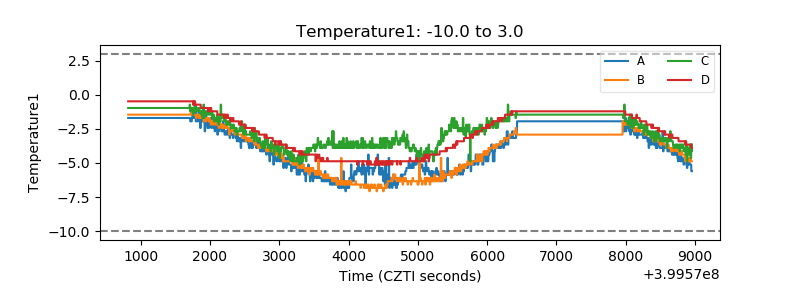 |
| Veto HV Monitor | 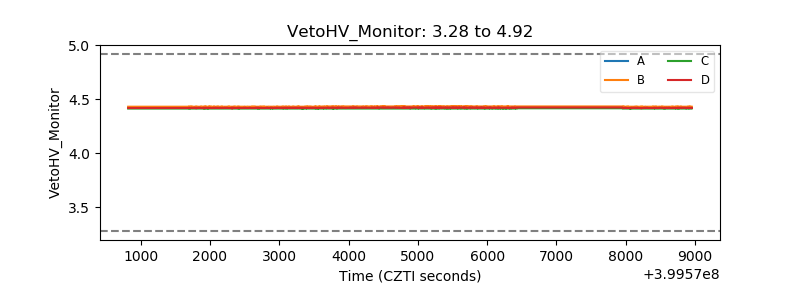 |
| Veto LLD | 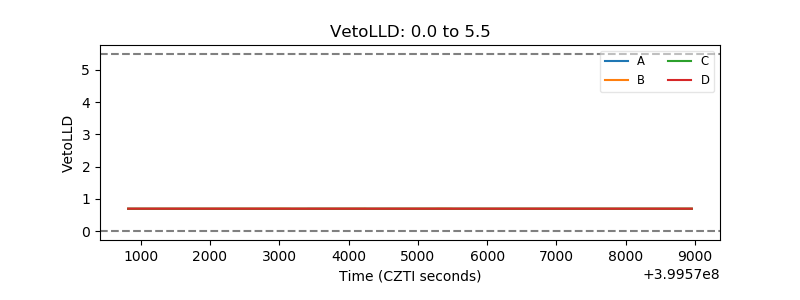 |
| Alpha Counter | 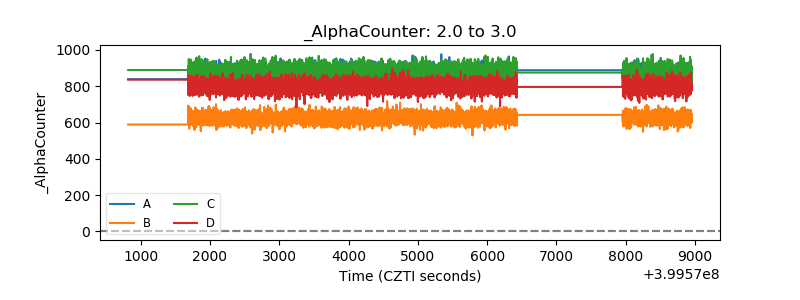 |
| _CPM_Rate | 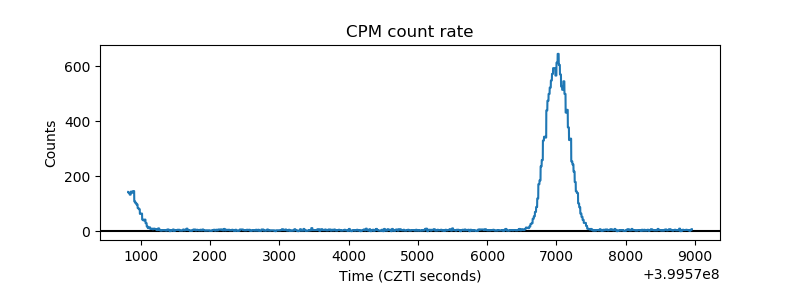 |
| CZT Counter | 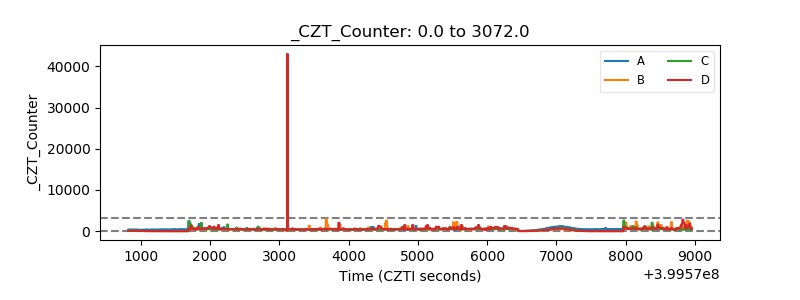 |
| +2.5 Volts monitor | 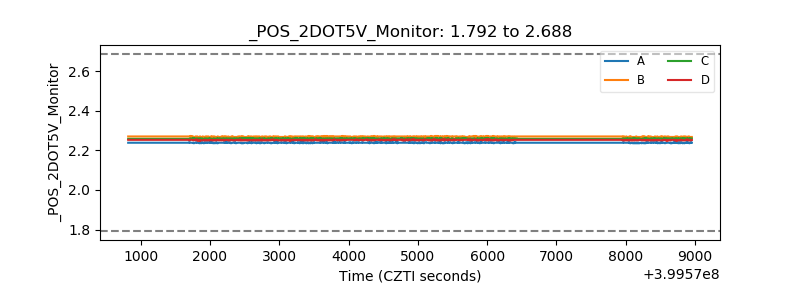 |
| +5 Volts monitor | 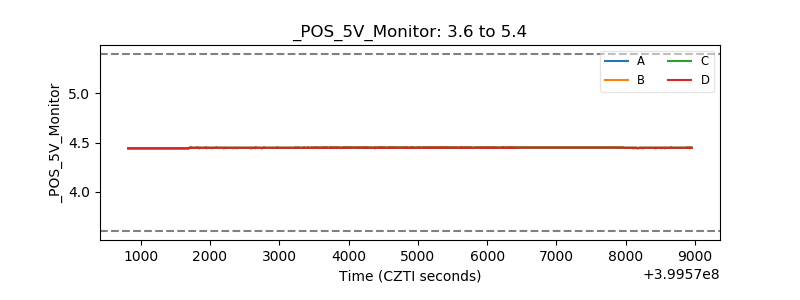 |
| _ROLL_ROT | 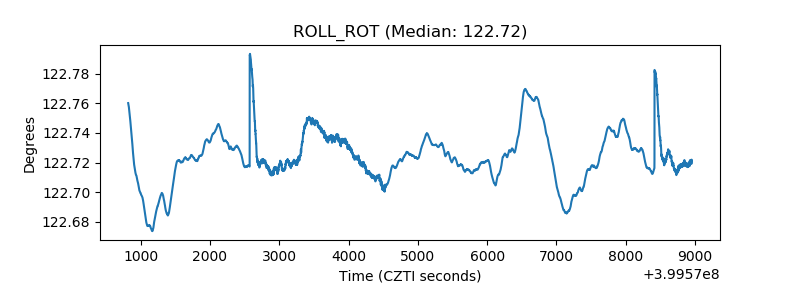 |
| _Roll_DEC | 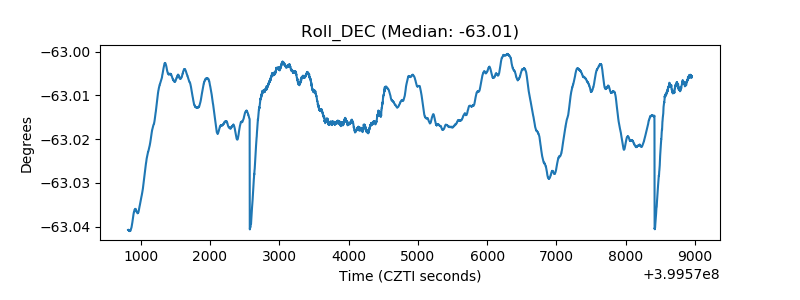 |
| _Roll_RA | 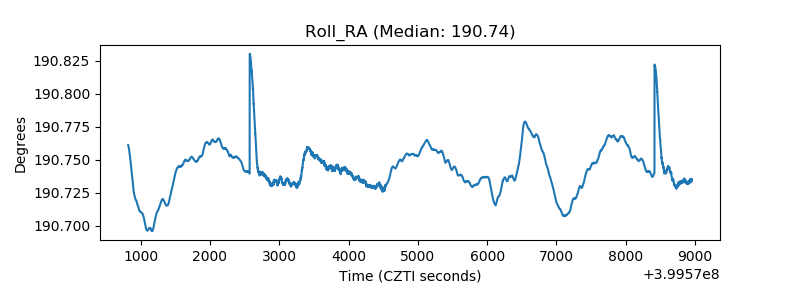 |
| Veto Counter | 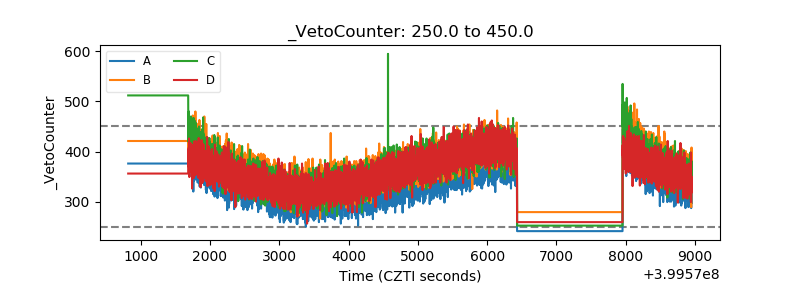 |