| Param | Original file | Final file |
|---|---|---|
| Filename | modeM0/AS1A09_002T01_9000005322_37429cztM0_level2.evt | modeM0/AS1A09_002T01_9000005322_37429cztM0_level2_quad_clean.evt |
| Size (bytes) | 416,946,240 | 78,736,320 |
| Size | 397.6 MB | 75.1 MB |
| Events in quadrant A | 2,776,675 | 506,409 |
| Events in quadrant B | 3,370,175 | 505,983 |
| Events in quadrant C | 3,037,120 | 505,598 |
| Events in quadrant D | 3,072,103 | 484,197 |
| Mode M0 | |||
|---|---|---|---|
| Quadrant | BADHDUFLAG | Total packets | Discarded packets |
| A | 0 | 11730 | 3 |
| B | 0 | 13580 | 2 |
| C | 0 | 12487 | 2 |
| D | 0 | 12915 | 2 |
| Mode M9 | |||
|---|---|---|---|
| Quadrant | BADHDUFLAG | Total packets | Discarded packets |
| A | 0 | 18 | 0 |
| B | 0 | 18 | 0 |
| C | 0 | 18 | 0 |
| D | 0 | 19 | 0 |
| Mode SS | |||
|---|---|---|---|
| Quadrant | BADHDUFLAG | Total packets | Discarded packets |
| A | 0 | 110 | 0 |
| B | 0 | 110 | 0 |
| C | 0 | 110 | 0 |
| D | 0 | 110 | 0 |
| Quadrant | Total seconds | Saturated seconds | Saturation percentage |
|---|---|---|---|
| A | 5463 | 25 | 0.457624% |
| B | 5463 | 212 | 3.880652% |
| C | 5463 | 124 | 2.269815% |
| D | 5463 | 72 | 1.317957% |
Noise dominated data is calculated using 1-second bins in cleaned event files. If a bin has >2000 counts, and if more than 50% of those come from <1% of pixels, then it is considered to be noise-dominated and hence unusable.
| Quadrant | # 1 sec bins | Bins with >0 counts | Bins with >2000 counts | High rate bins dominated by noise | Noise dominated (total time) | Noise dominated (detector-on time) | Marked lightcurve |
|---|---|---|---|---|---|---|---|
| A | 7136 | 5464 | 13 | 13 | 0.18% | 0.24% | 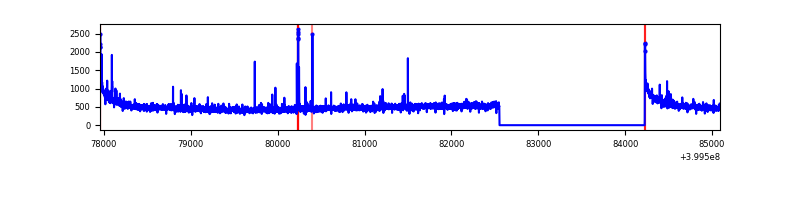 |
| B | 7136 | 5464 | 175 | 175 | 2.45% | 3.20% | 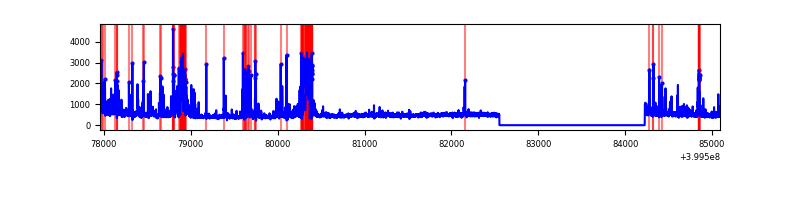 |
| C | 7136 | 5464 | 110 | 110 | 1.54% | 2.01% | 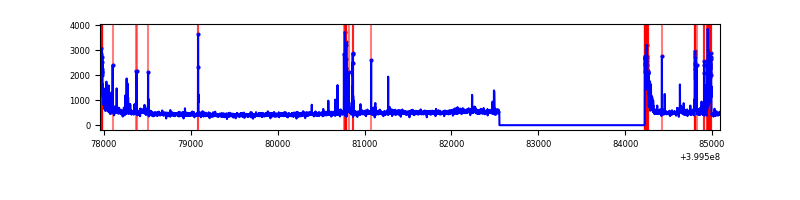 |
| D | 7136 | 5464 | 69 | 69 | 0.97% | 1.26% | 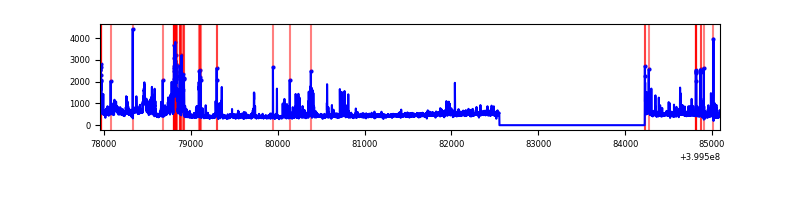 |
Top three noisy pixels from each quadrant. If the there are fewer than three noisy pixels in the level2.evt file, extra rows are filled as -1
| Pixel properties | Quadrant properties | ||||||
|---|---|---|---|---|---|---|---|
| Quadrant | DetID | PixID | Counts | Sigma | Mean | Median | Sigma |
| A | 10 | 83 | 301980 | 2430.89 | 609 | 598 | 124.0 |
| A | 9 | 143 | 37149 | 294.81 | 609 | 598 | 124.0 |
| A | 10 | 255 | 21230 | 166.41 | 609 | 598 | 124.0 |
| B | 0 | 189 | 331885 | 2899.02 | 597 | 581 | 114.3 |
| B | 4 | 171 | 291280 | 2543.71 | 597 | 581 | 114.3 |
| B | 5 | 172 | 262118 | 2288.54 | 597 | 581 | 114.3 |
| C | 14 | 254 | 292130 | 2119.32 | 586 | 590 | 137.6 |
| C | 15 | 214 | 230024 | 1667.84 | 586 | 590 | 137.6 |
| C | 0 | 10 | 189177 | 1370.91 | 586 | 590 | 137.6 |
| D | 10 | 253 | 174986 | 1229.92 | 587 | 570 | 141.8 |
| D | 13 | 249 | 168865 | 1186.75 | 587 | 570 | 141.8 |
| D | 2 | 153 | 131818 | 925.51 | 587 | 570 | 141.8 |
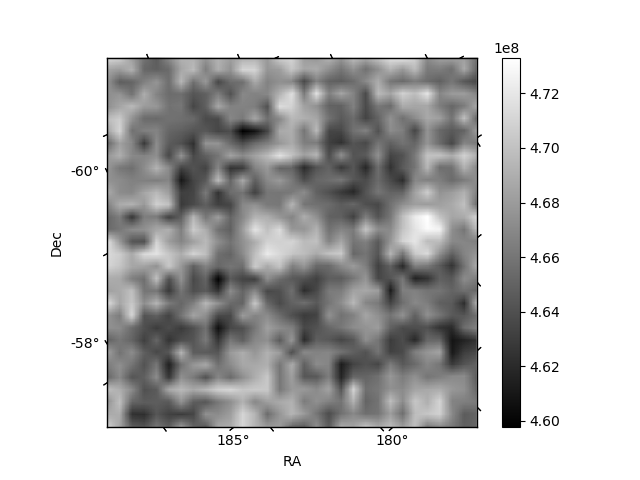
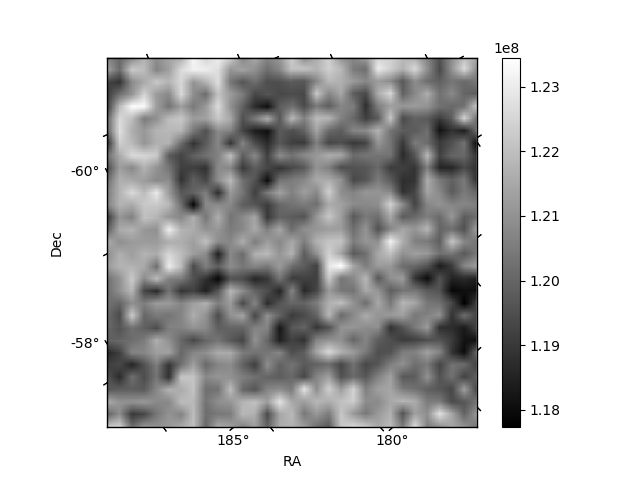
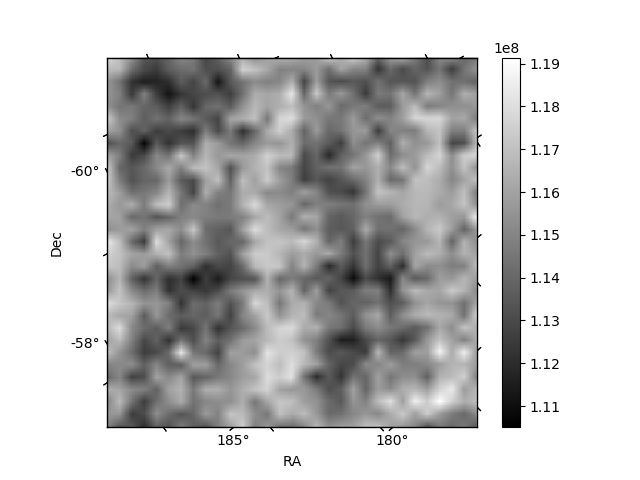
Histogram calculated using DETX and DETY for each event in the final _common_clean file
| Quadrant A | 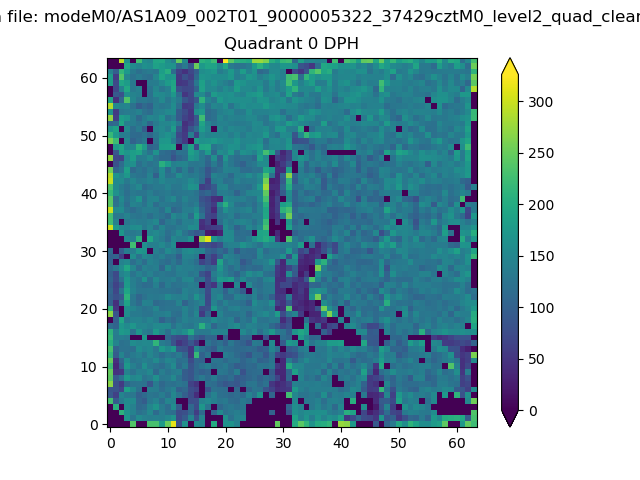 |
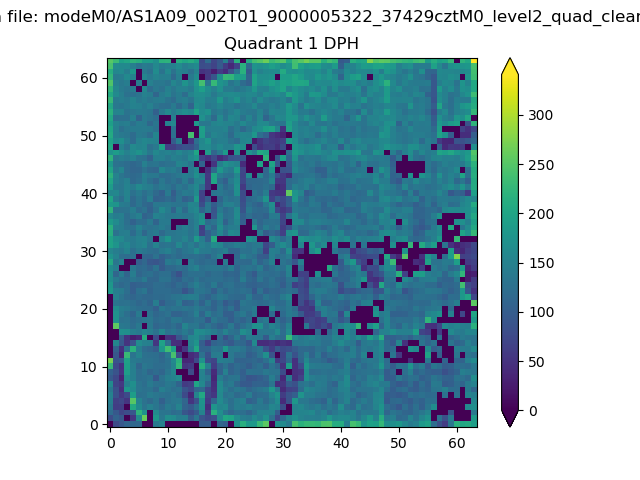 |
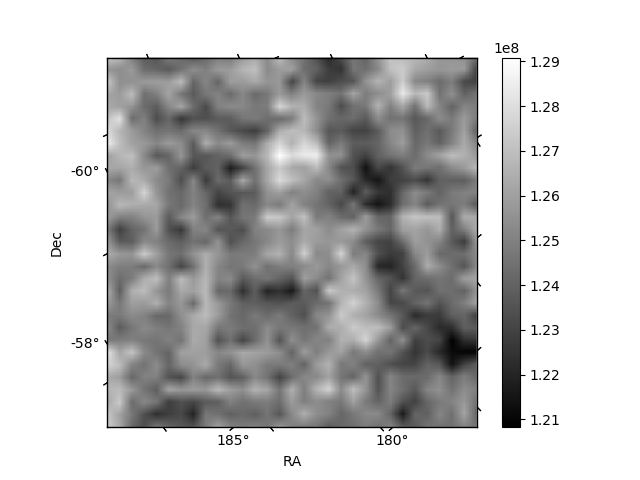
Quadrant B |
|---|---|---|---|
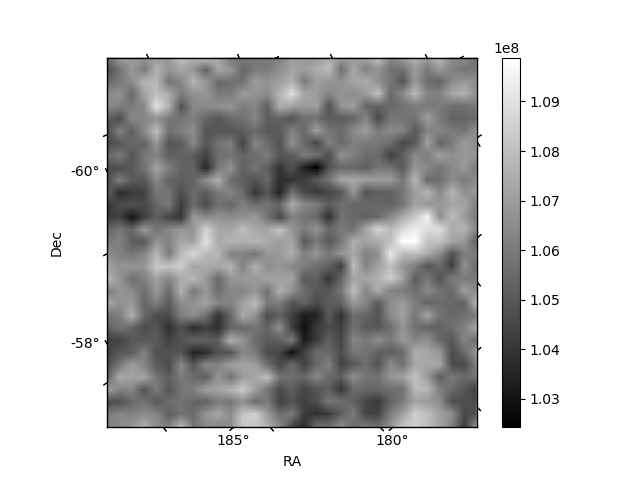
| Quadrant D | 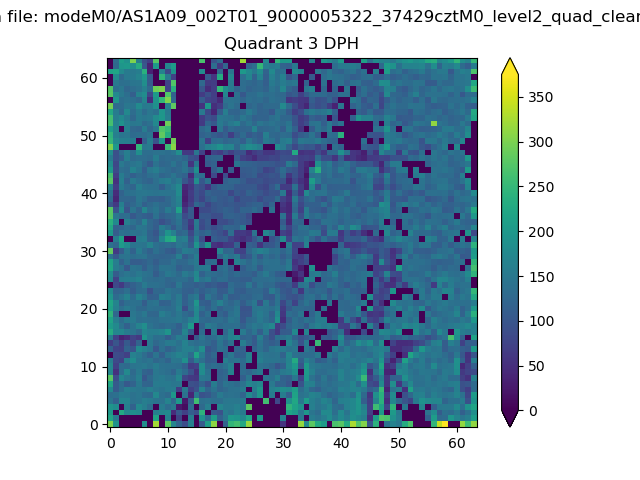 |
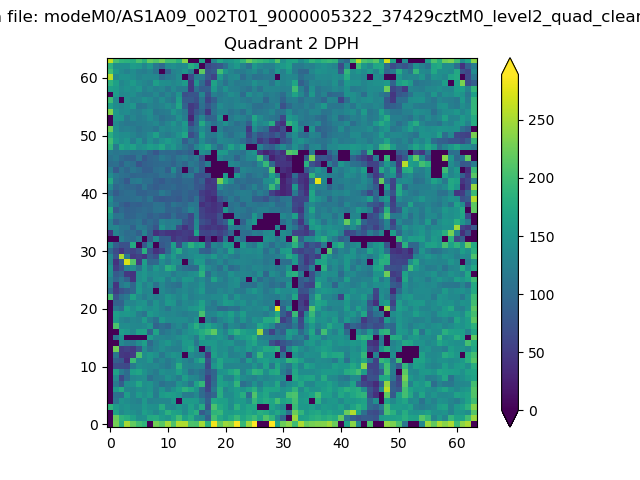 |
Quadrant C |
| Plot type | Count rate plots | Images |
|---|---|---|
| Comparison with Poisson distribution Blue bars denote a histogram of data divided into 1 sec bins. Red curve is a Poisson curve with rate = median count rate of data. |
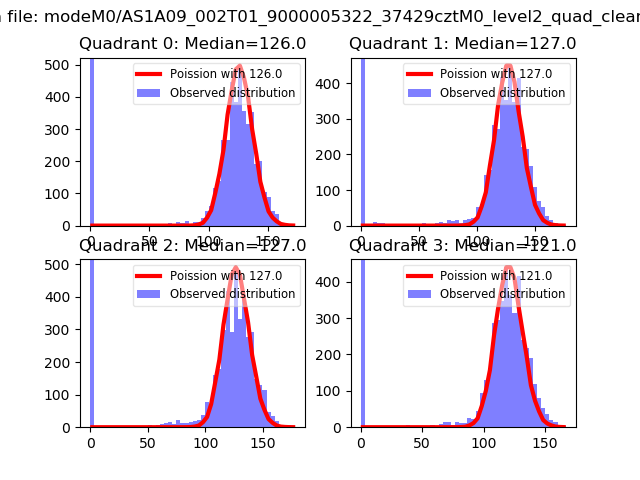 |
 |
| Quadrant-wise count rates Data is divided into 100 sec bins |
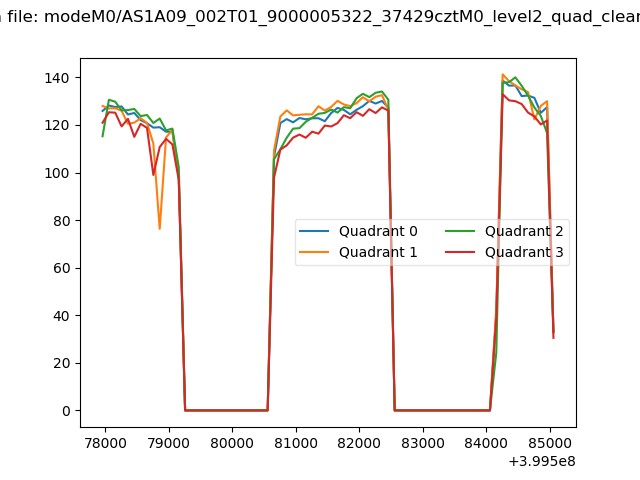 |
|
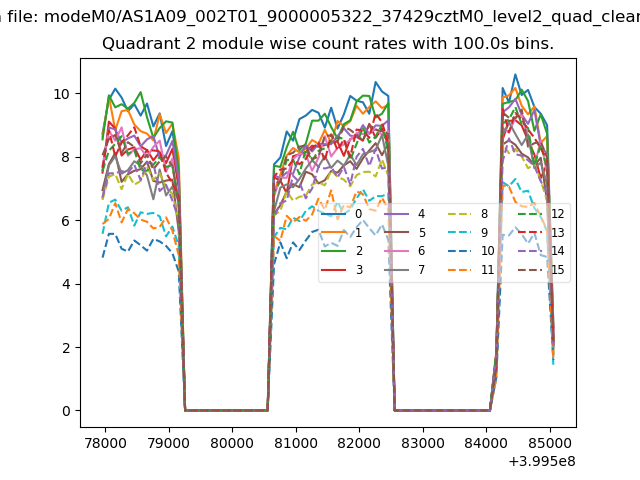
| Module-wise count rates for Quadrant A Data is divided into 100 sec bins |
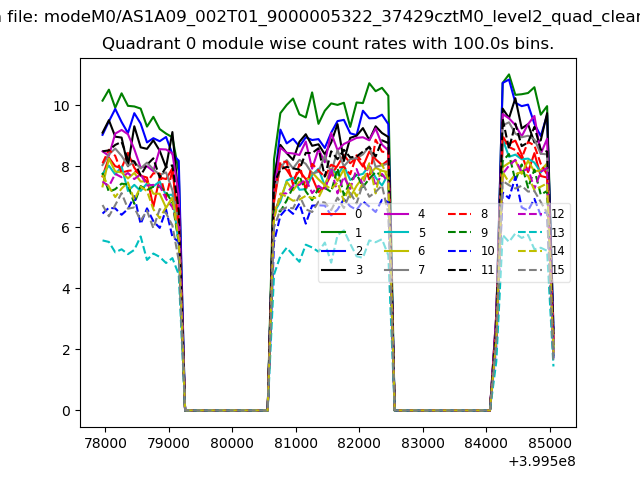 |
 |
| Module-wise count rates for Quadrant B Data is divided into 100 sec bins |
 |
 |
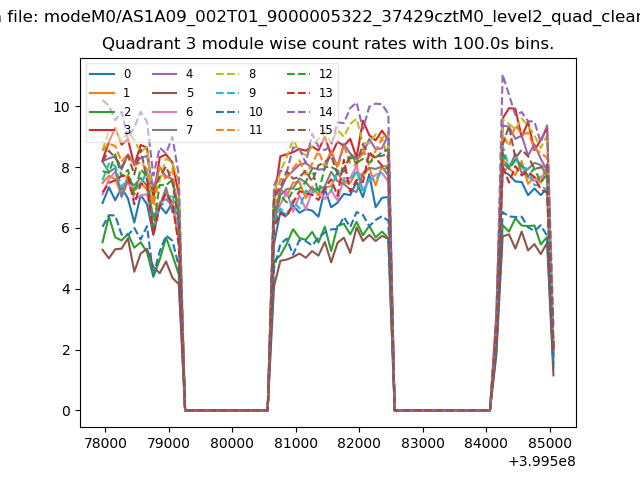
| Module-wise count rates for Quadrant C Data is divided into 100 sec bins |
 |
 |
| Module-wise count rates for Quadrant D Data is divided into 100 sec bins |
 |
 |
| Parameter | Plot |
|---|---|
| CZT HV Monitor | 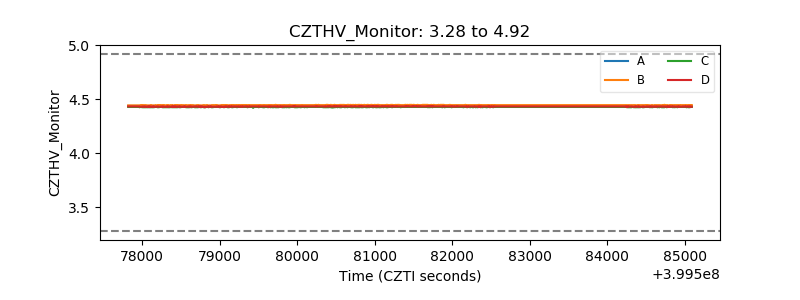 |
| D_VDD | 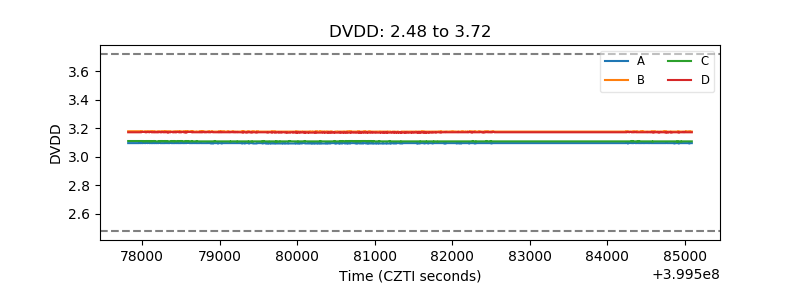 |
| Temperature 1 | 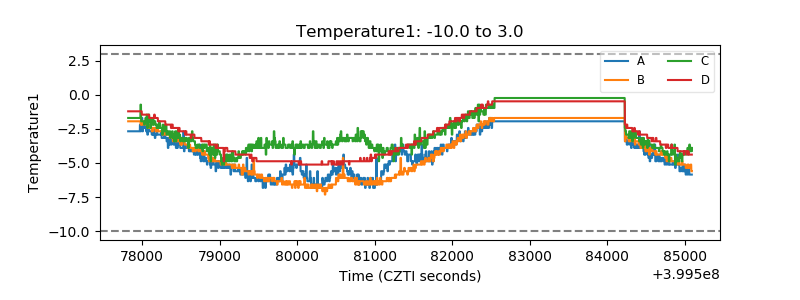 |
| Veto HV Monitor |  |
| Veto LLD | 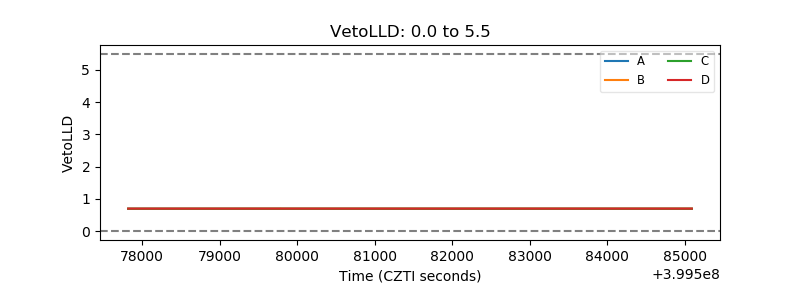 |
| Alpha Counter | 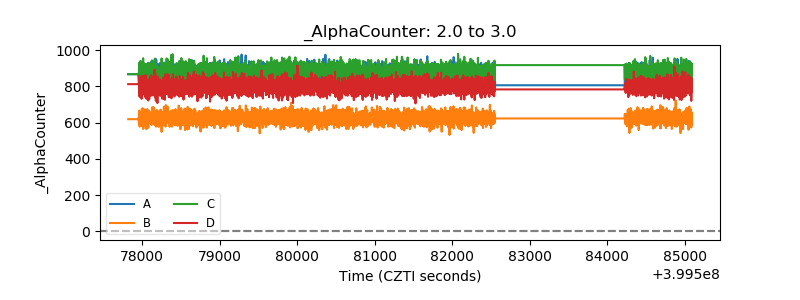 |
| _CPM_Rate | 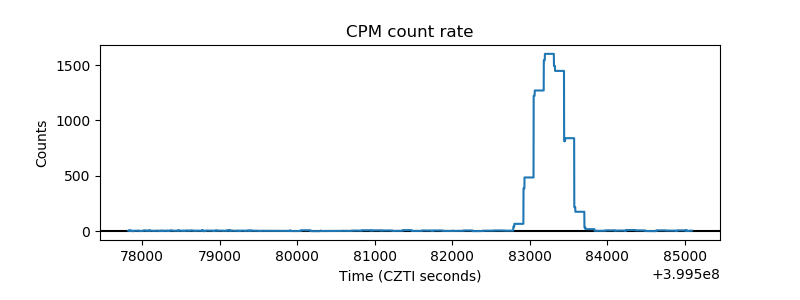 |
| CZT Counter | 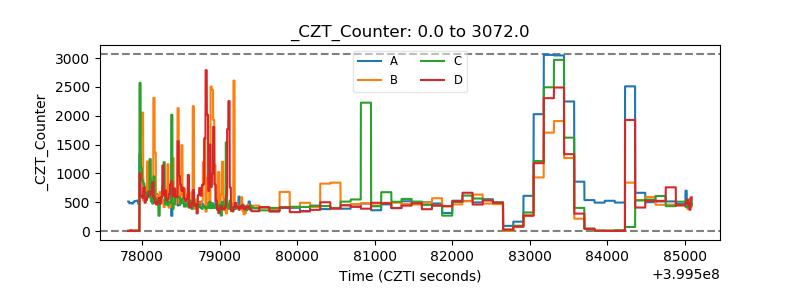 |
| +2.5 Volts monitor | 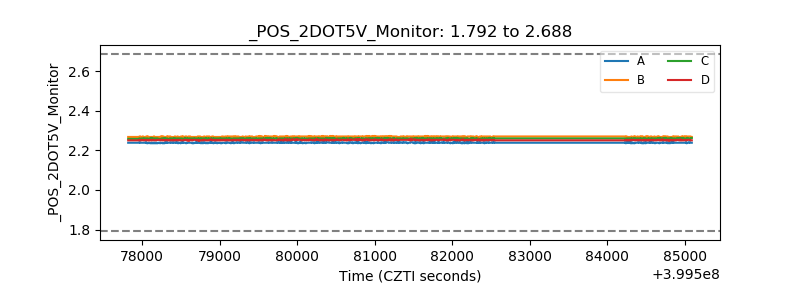 |
| +5 Volts monitor | 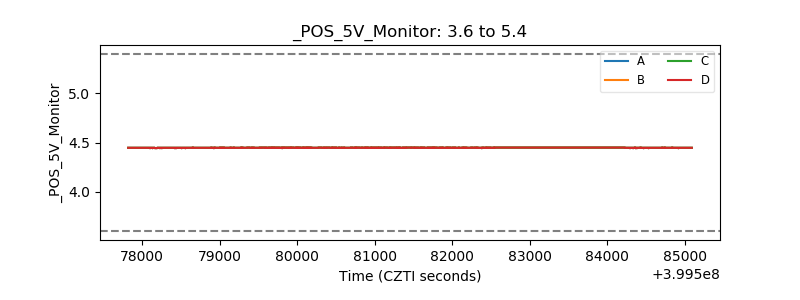 |
| _ROLL_ROT | 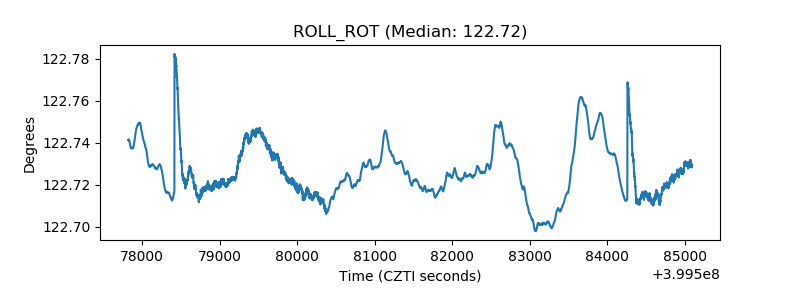 |
| _Roll_DEC | 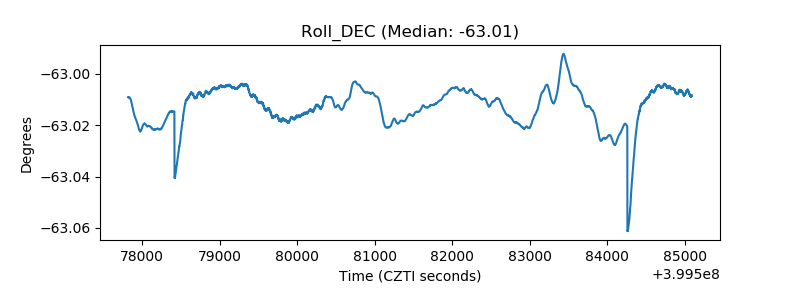 |
| _Roll_RA | 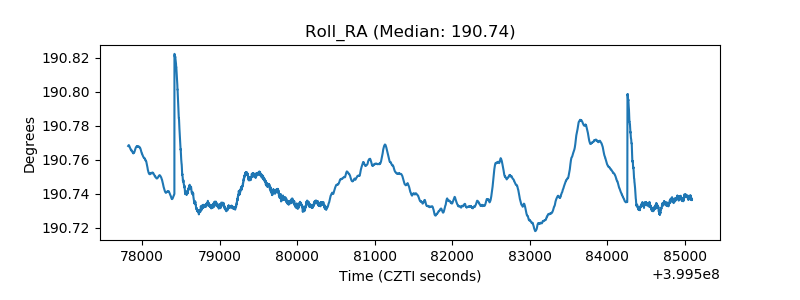 |
| Veto Counter | 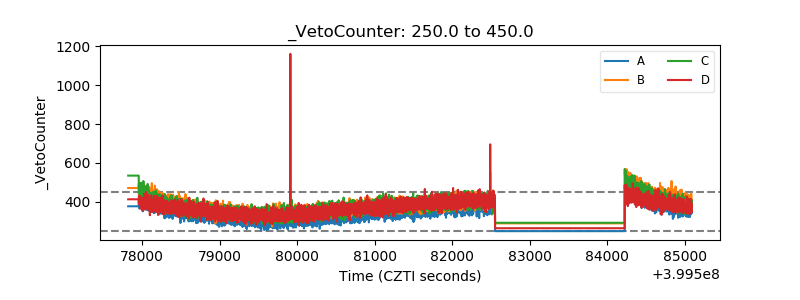 |