| Param | Original file | Final file |
|---|---|---|
| Filename | modeM0/AS1A09_002T01_9000005322_37431cztM0_level2.evt | modeM0/AS1A09_002T01_9000005322_37431cztM0_level2_quad_clean.evt |
| Size (bytes) | 401,866,560 | 71,850,240 |
| Size | 383.2 MB | 68.5 MB |
| Events in quadrant A | 2,697,396 | 455,886 |
| Events in quadrant B | 2,998,747 | 463,020 |
| Events in quadrant C | 3,136,651 | 452,530 |
| Events in quadrant D | 2,978,351 | 434,003 |
| Mode M0 | |||
|---|---|---|---|
| Quadrant | BADHDUFLAG | Total packets | Discarded packets |
| A | 0 | 11305 | 3 |
| B | 0 | 12317 | 2 |
| C | 0 | 12489 | 2 |
| D | 0 | 12349 | 2 |
| Mode M9 | |||
|---|---|---|---|
| Quadrant | BADHDUFLAG | Total packets | Discarded packets |
| A | 0 | 23 | 0 |
| B | 0 | 23 | 0 |
| C | 0 | 23 | 0 |
| D | 0 | 24 | 0 |
| Mode SS | |||
|---|---|---|---|
| Quadrant | BADHDUFLAG | Total packets | Discarded packets |
| A | 0 | 106 | 0 |
| B | 0 | 106 | 0 |
| C | 0 | 106 | 0 |
| D | 0 | 106 | 0 |
| Quadrant | Total seconds | Saturated seconds | Saturation percentage |
|---|---|---|---|
| A | 5293 | 13 | 0.245607% |
| B | 5293 | 120 | 2.267145% |
| C | 5293 | 140 | 2.645003% |
| D | 5293 | 74 | 1.398073% |
Noise dominated data is calculated using 1-second bins in cleaned event files. If a bin has >2000 counts, and if more than 50% of those come from <1% of pixels, then it is considered to be noise-dominated and hence unusable.
| Quadrant | # 1 sec bins | Bins with >0 counts | Bins with >2000 counts | High rate bins dominated by noise | Noise dominated (total time) | Noise dominated (detector-on time) | Marked lightcurve |
|---|---|---|---|---|---|---|---|
| A | 7086 | 5294 | 8 | 8 | 0.11% | 0.15% | 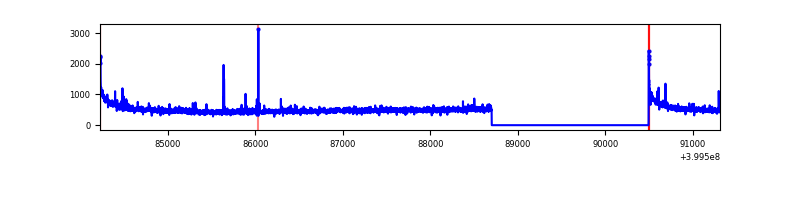 |
| B | 7086 | 5294 | 84 | 84 | 1.19% | 1.59% | 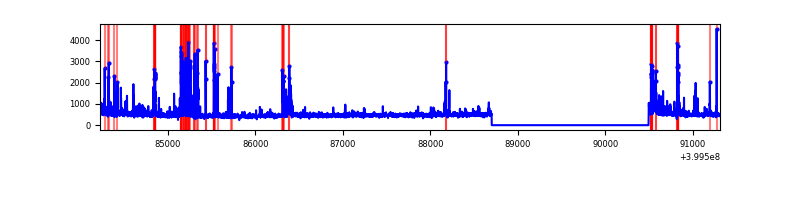 |
| C | 7086 | 5294 | 122 | 122 | 1.72% | 2.30% | 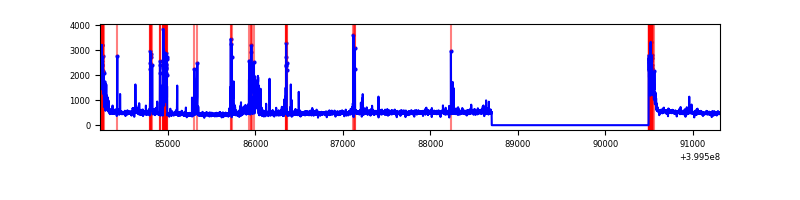 |
| D | 7086 | 5294 | 66 | 66 | 0.93% | 1.25% | 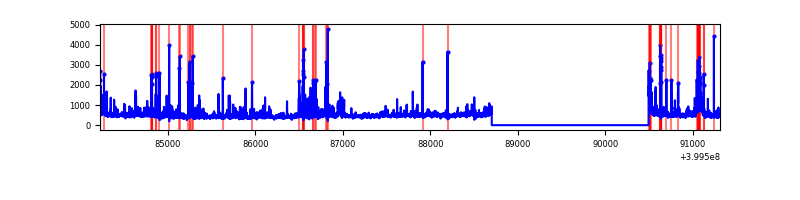 |
Top three noisy pixels from each quadrant. If the there are fewer than three noisy pixels in the level2.evt file, extra rows are filled as -1
| Pixel properties | Quadrant properties | ||||||
|---|---|---|---|---|---|---|---|
| Quadrant | DetID | PixID | Counts | Sigma | Mean | Median | Sigma |
| A | 10 | 83 | 285041 | 2328.24 | 603 | 592 | 122.2 |
| A | 12 | 189 | 29934 | 240.17 | 603 | 592 | 122.2 |
| A | 9 | 143 | 13460 | 105.33 | 603 | 592 | 122.2 |
| B | 5 | 172 | 272799 | 2389.9 | 600 | 586 | 113.9 |
| B | 0 | 189 | 158413 | 1385.65 | 600 | 586 | 113.9 |
| B | 4 | 171 | 70951 | 617.77 | 600 | 586 | 113.9 |
| C | 14 | 254 | 371339 | 2744.94 | 582 | 587 | 135.1 |
| C | 0 | 10 | 226984 | 1676.18 | 582 | 587 | 135.1 |
| C | 15 | 214 | 223735 | 1652.13 | 582 | 587 | 135.1 |
| D | 2 | 153 | 168047 | 1197.29 | 582 | 566 | 139.9 |
| D | 5 | 157 | 147195 | 1048.22 | 582 | 566 | 139.9 |
| D | 12 | 235 | 106214 | 755.26 | 582 | 566 | 139.9 |
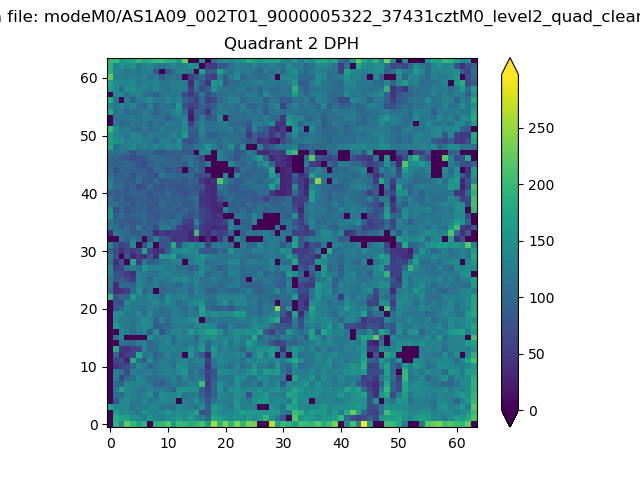
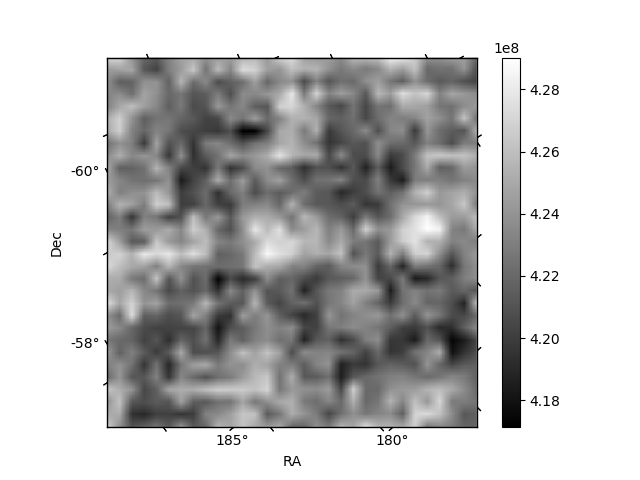
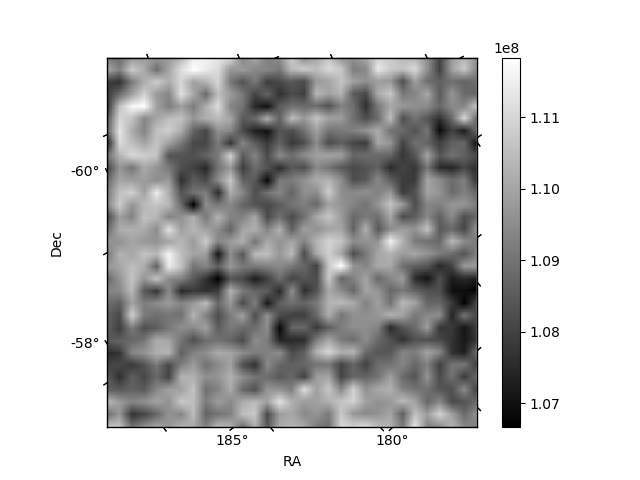
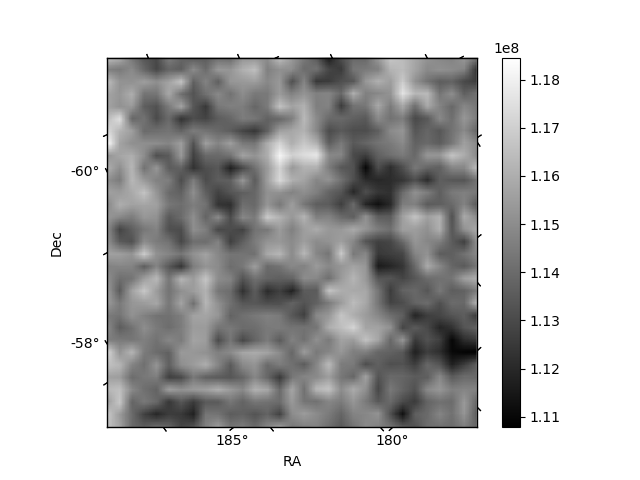
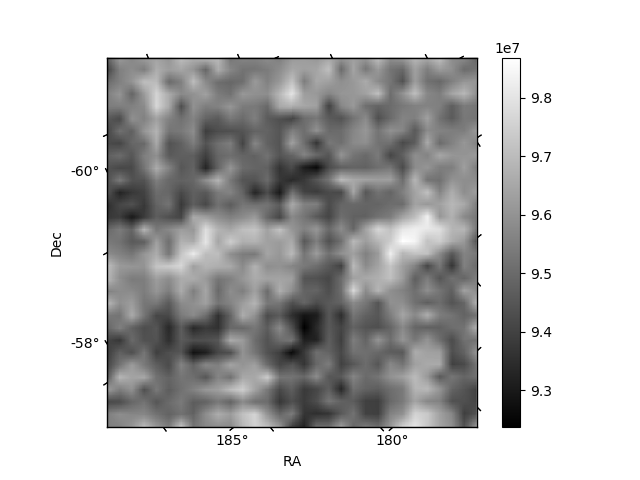
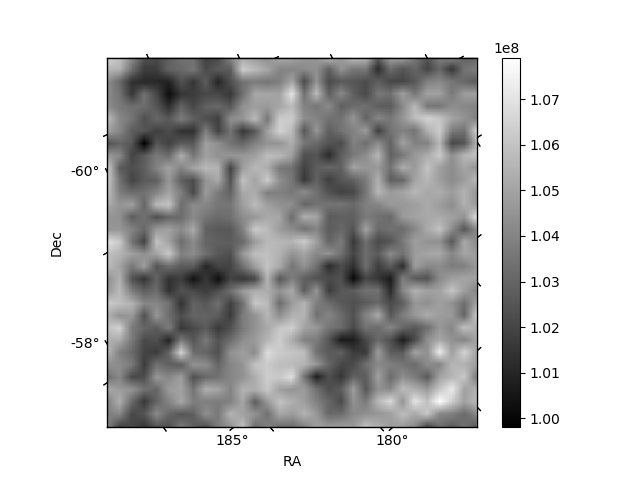
Histogram calculated using DETX and DETY for each event in the final _common_clean file
| Quadrant A | 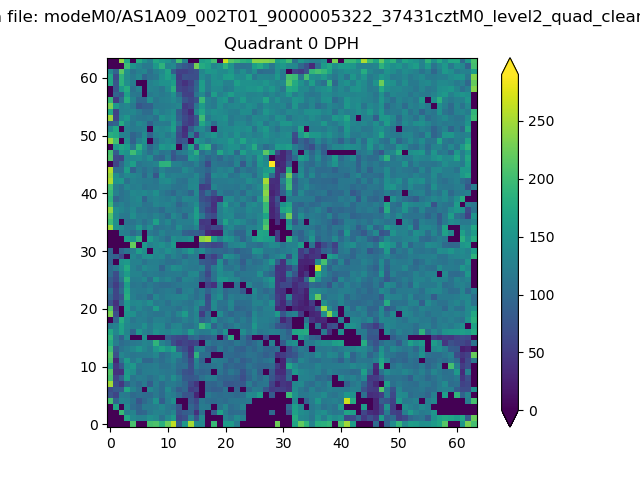 |
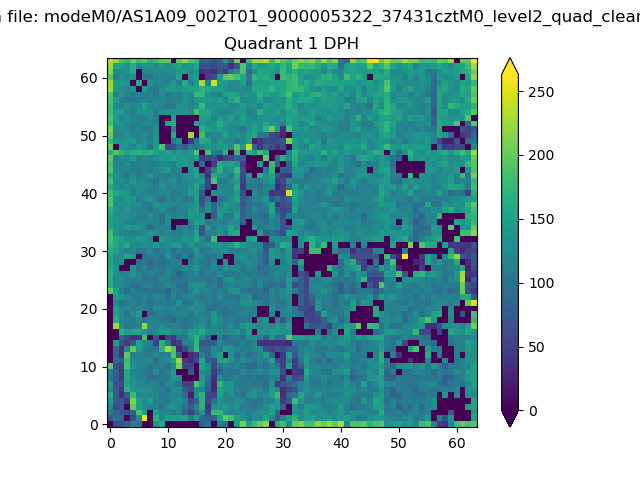 |
Quadrant B |
|---|---|---|---|
| Quadrant D | 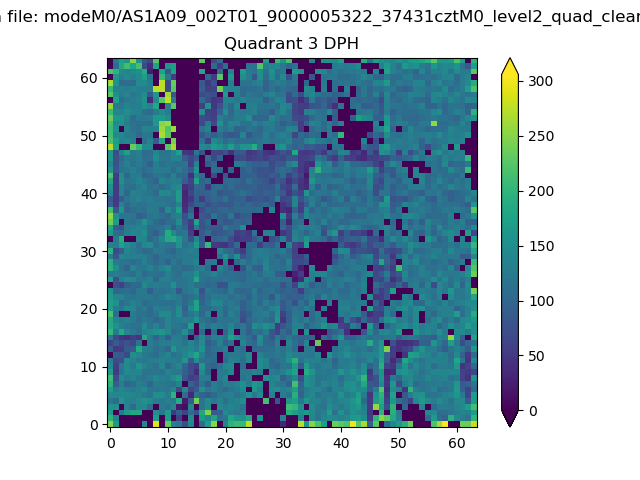 |
 |
Quadrant C |
| Plot type | Count rate plots | Images |
|---|---|---|
| Comparison with Poisson distribution Blue bars denote a histogram of data divided into 1 sec bins. Red curve is a Poisson curve with rate = median count rate of data. |
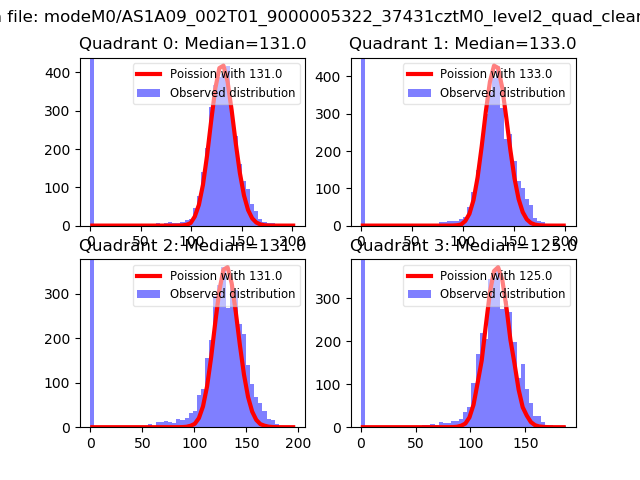 |
 |
| Quadrant-wise count rates Data is divided into 100 sec bins |
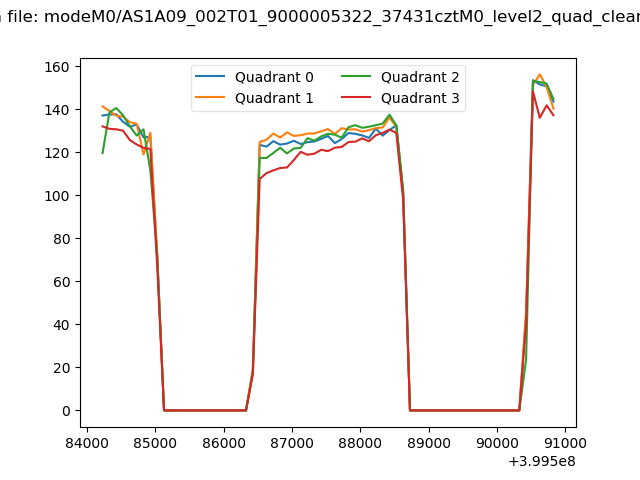 |
|
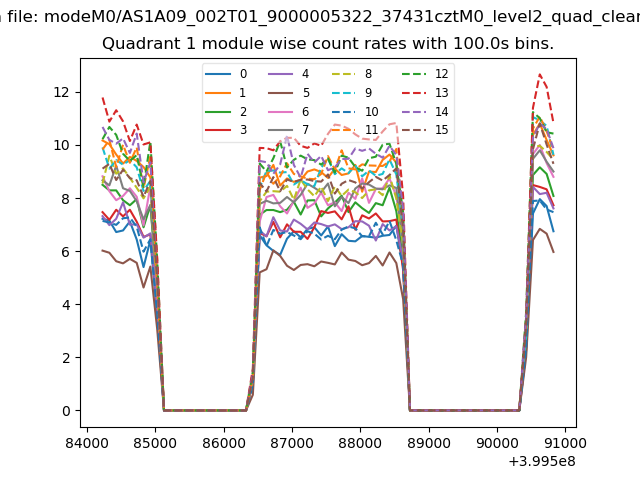
| Module-wise count rates for Quadrant A Data is divided into 100 sec bins |
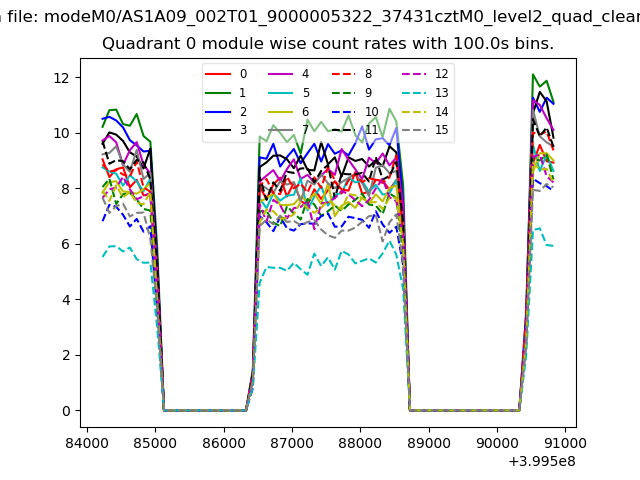 |
 |
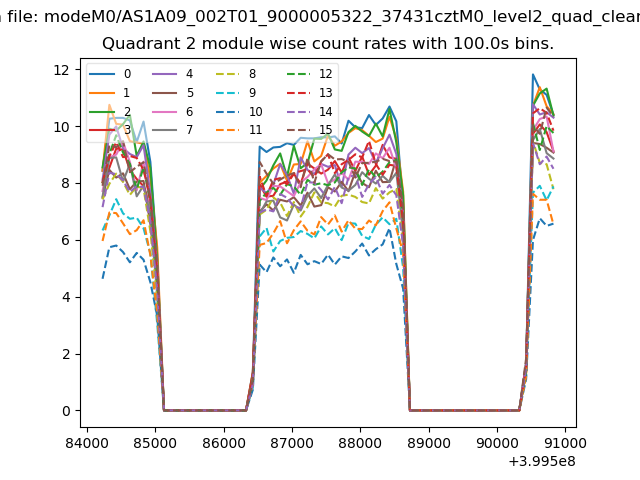
| Module-wise count rates for Quadrant B Data is divided into 100 sec bins |
 |
 |
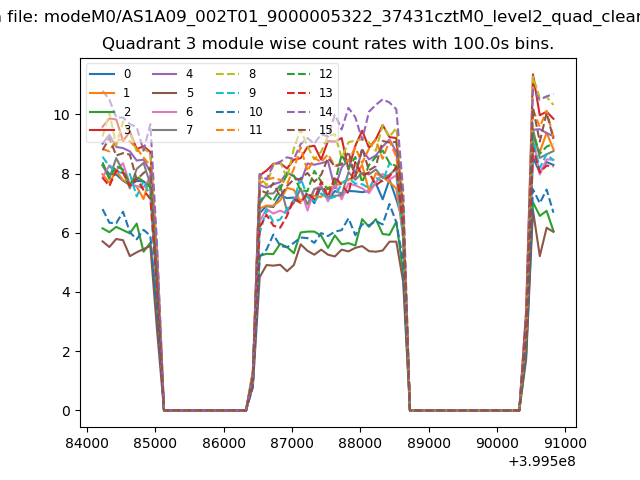
| Module-wise count rates for Quadrant C Data is divided into 100 sec bins |
 |
 |
| Module-wise count rates for Quadrant D Data is divided into 100 sec bins |
 |
 |
| Parameter | Plot |
|---|---|
| CZT HV Monitor |  |
| D_VDD | 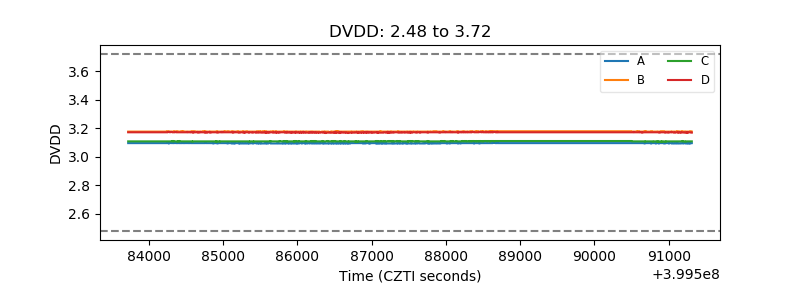 |
| Temperature 1 | 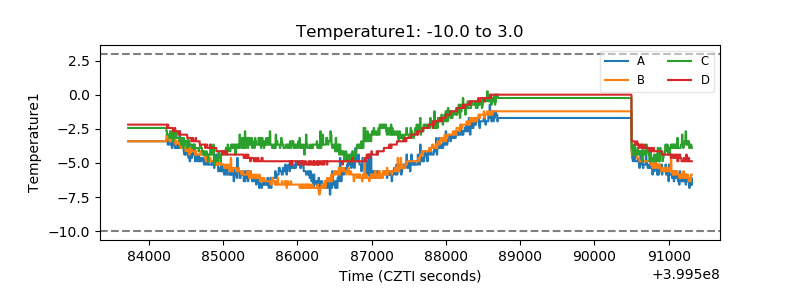 |
| Veto HV Monitor | 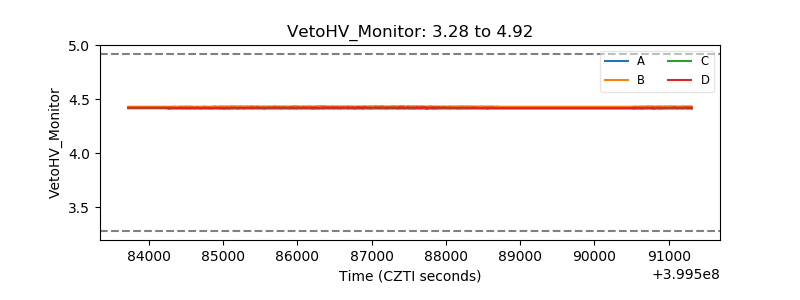 |
| Veto LLD | 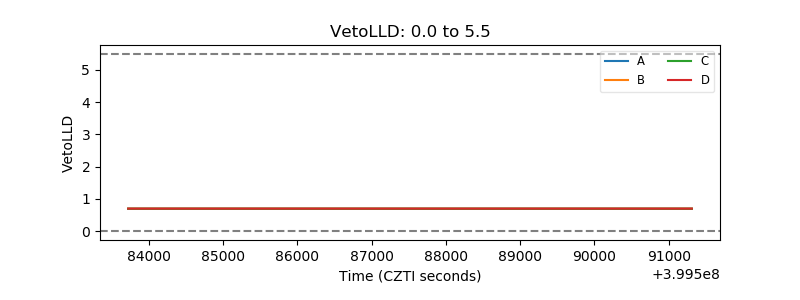 |
| Alpha Counter | 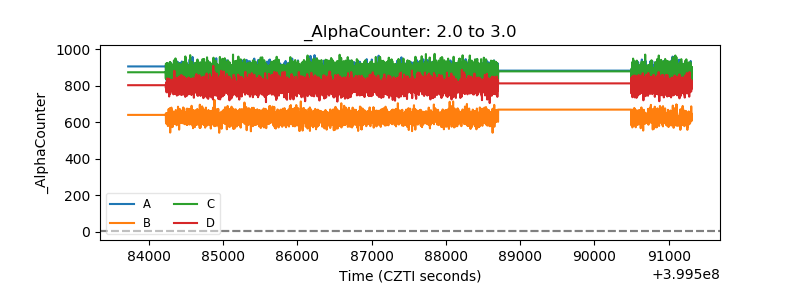 |
| _CPM_Rate | 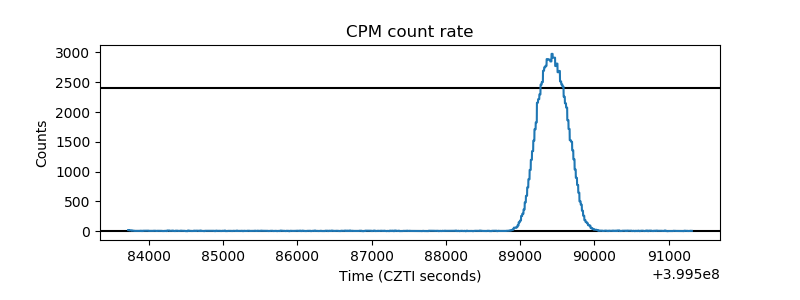 |
| CZT Counter | 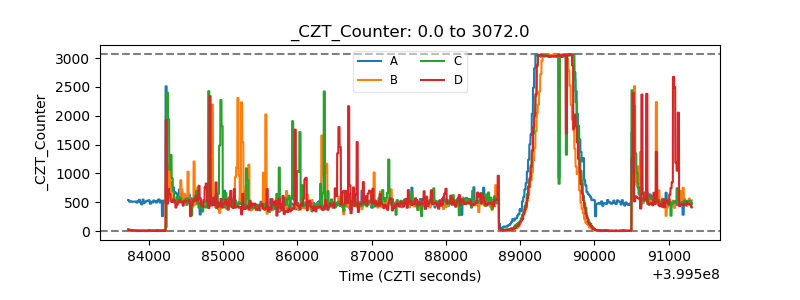 |
| +2.5 Volts monitor | 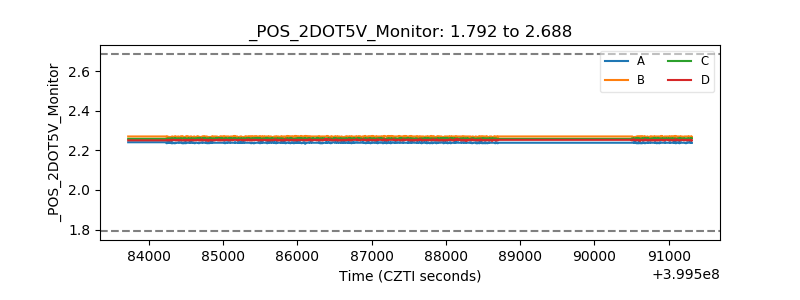 |
| +5 Volts monitor | 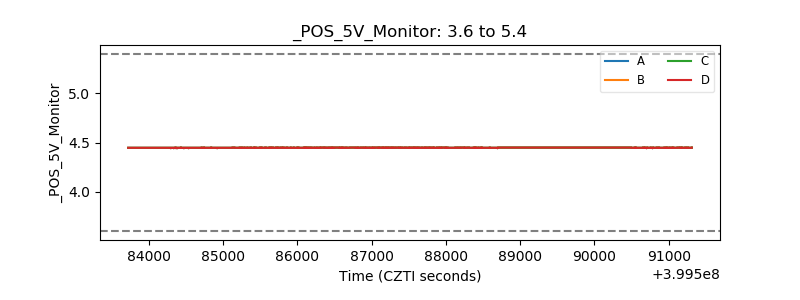 |
| _ROLL_ROT | 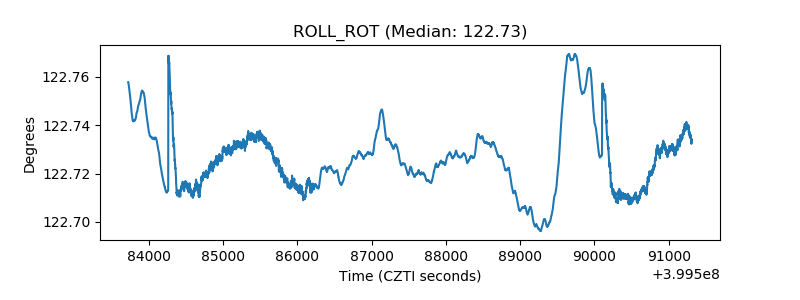 |
| _Roll_DEC | 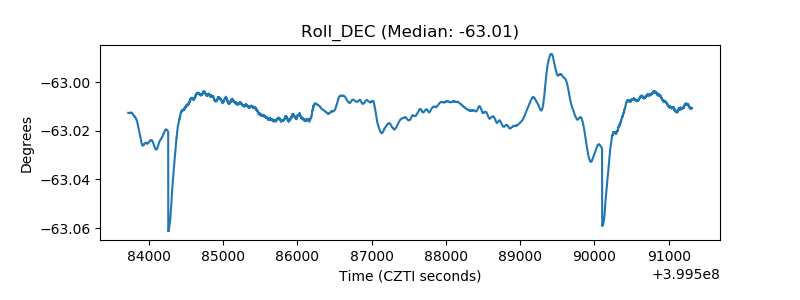 |
| _Roll_RA |  |
| Veto Counter | 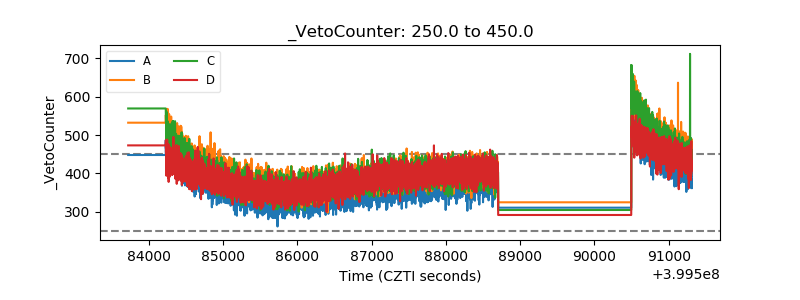 |