| Param | Original file | Final file |
|---|---|---|
| Filename | modeM0/AS1A09_002T01_9000005322_37433cztM0_level2.evt | modeM0/AS1A09_002T01_9000005322_37433cztM0_level2_quad_clean.evt |
| Size (bytes) | 425,946,240 | 62,380,800 |
| Size | 406.2 MB | 59.5 MB |
| Events in quadrant A | 2,762,811 | 386,023 |
| Events in quadrant B | 3,219,784 | 391,128 |
| Events in quadrant C | 2,849,645 | 393,539 |
| Events in quadrant D | 3,723,184 | 362,604 |
| Mode M0 | |||
|---|---|---|---|
| Quadrant | BADHDUFLAG | Total packets | Discarded packets |
| A | 0 | 11124 | 3 |
| B | 0 | 12643 | 2 |
| C | 0 | 11208 | 2 |
| D | 0 | 14484 | 2 |
| Mode M9 | |||
|---|---|---|---|
| Quadrant | BADHDUFLAG | Total packets | Discarded packets |
| A | 0 | 31 | 0 |
| B | 0 | 31 | 0 |
| C | 0 | 31 | 0 |
| D | 0 | 32 | 0 |
| Mode SS | |||
|---|---|---|---|
| Quadrant | BADHDUFLAG | Total packets | Discarded packets |
| A | 0 | 102 | 0 |
| B | 0 | 102 | 0 |
| C | 0 | 102 | 0 |
| D | 0 | 102 | 0 |
| Quadrant | Total seconds | Saturated seconds | Saturation percentage |
|---|---|---|---|
| A | 5075 | 13 | 0.256158% |
| B | 5075 | 190 | 3.743842% |
| C | 5075 | 42 | 0.827586% |
| D | 5075 | 186 | 3.665025% |
Noise dominated data is calculated using 1-second bins in cleaned event files. If a bin has >2000 counts, and if more than 50% of those come from <1% of pixels, then it is considered to be noise-dominated and hence unusable.
| Quadrant | # 1 sec bins | Bins with >0 counts | Bins with >2000 counts | High rate bins dominated by noise | Noise dominated (total time) | Noise dominated (detector-on time) | Marked lightcurve |
|---|---|---|---|---|---|---|---|
| A | 7108 | 5076 | 3 | 3 | 0.04% | 0.06% | 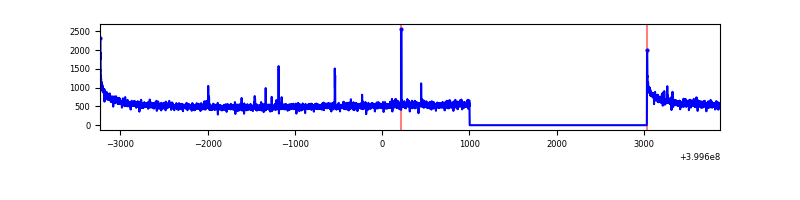 |
| B | 7108 | 5076 | 119 | 119 | 1.67% | 2.34% | 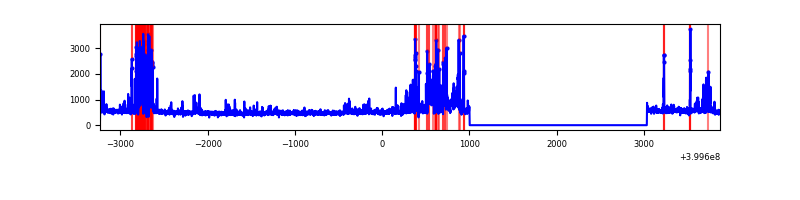 |
| C | 7108 | 5076 | 37 | 37 | 0.52% | 0.73% | 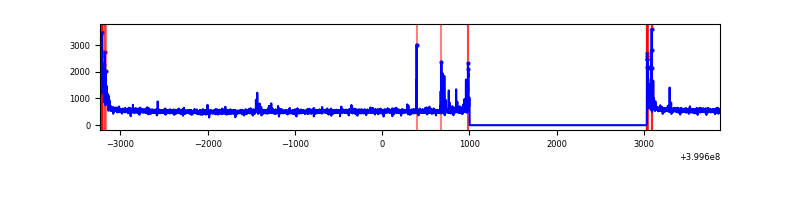 |
| D | 7108 | 5076 | 166 | 166 | 2.34% | 3.27% | 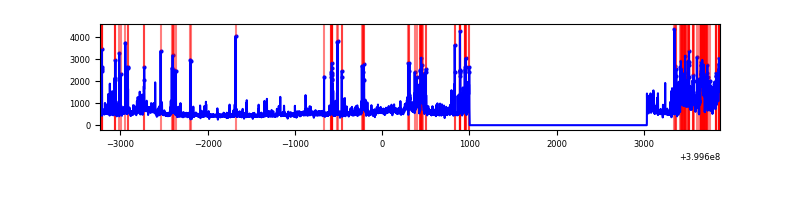 |
Top three noisy pixels from each quadrant. If the there are fewer than three noisy pixels in the level2.evt file, extra rows are filled as -1
| Pixel properties | Quadrant properties | ||||||
|---|---|---|---|---|---|---|---|
| Quadrant | DetID | PixID | Counts | Sigma | Mean | Median | Sigma |
| A | 10 | 83 | 268087 | 2150.7 | 627 | 617 | 124.4 |
| A | 12 | 189 | 23380 | 183.03 | 627 | 617 | 124.4 |
| A | 13 | 6 | 12980 | 99.41 | 627 | 617 | 124.4 |
| B | 5 | 172 | 320766 | 2802.8 | 617 | 603 | 114.2 |
| B | 4 | 171 | 152897 | 1333.22 | 617 | 603 | 114.2 |
| B | 4 | 67 | 70229 | 609.53 | 617 | 603 | 114.2 |
| C | 15 | 214 | 217200 | 1546.24 | 616 | 622 | 140.1 |
| C | 0 | 10 | 160968 | 1144.78 | 616 | 622 | 140.1 |
| C | 14 | 254 | 65445 | 462.8 | 616 | 622 | 140.1 |
| D | 12 | 227 | 694003 | 4785.39 | 607 | 592 | 144.9 |
| D | 13 | 249 | 205509 | 1414.18 | 607 | 592 | 144.9 |
| D | 2 | 153 | 151561 | 1041.87 | 607 | 592 | 144.9 |
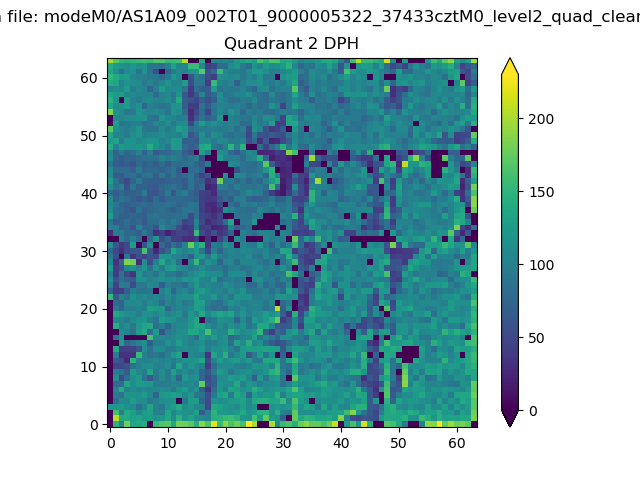
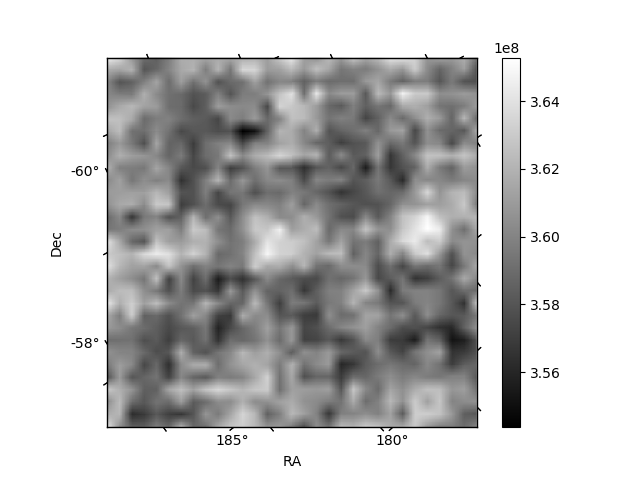
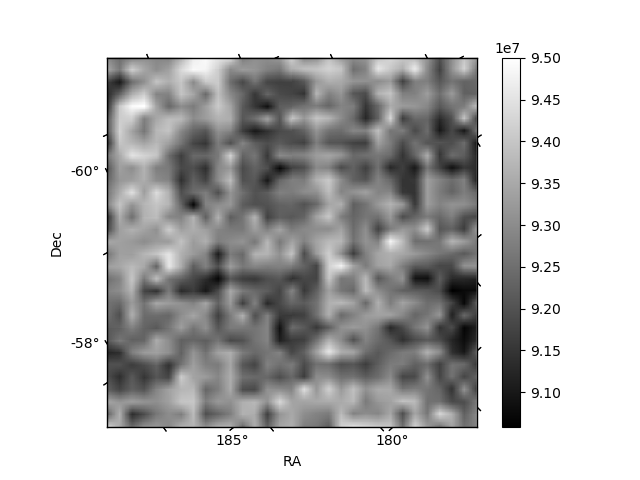
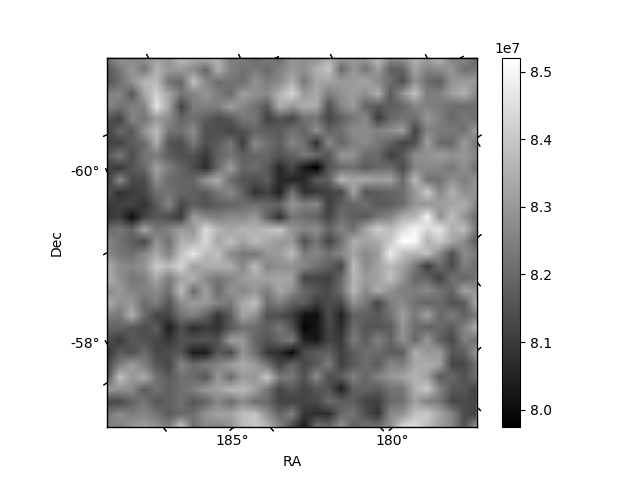
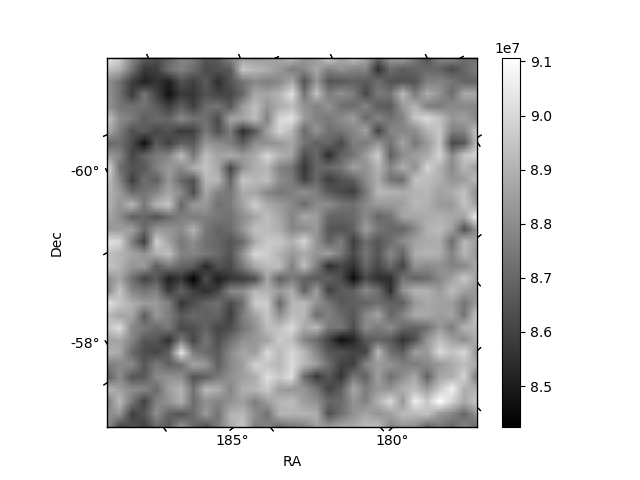
Histogram calculated using DETX and DETY for each event in the final _common_clean file
| Quadrant A | 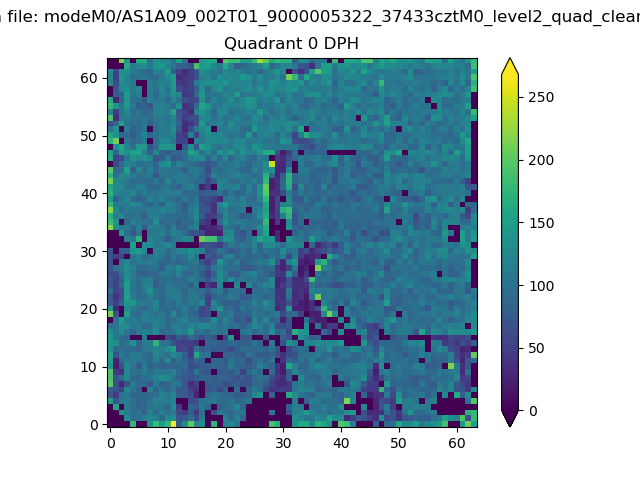 |
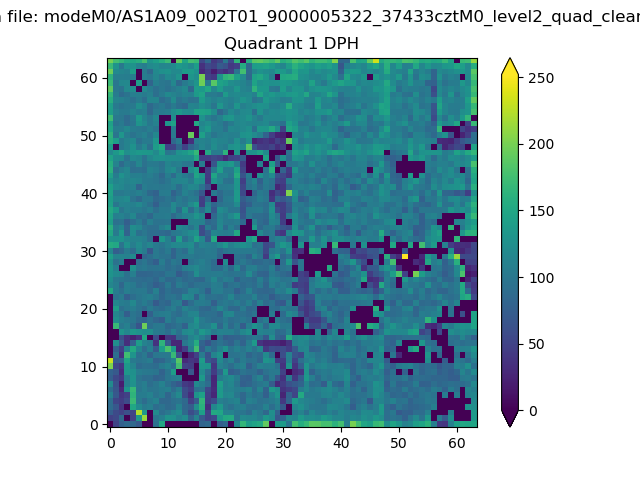 |
Quadrant B |
|---|---|---|---|
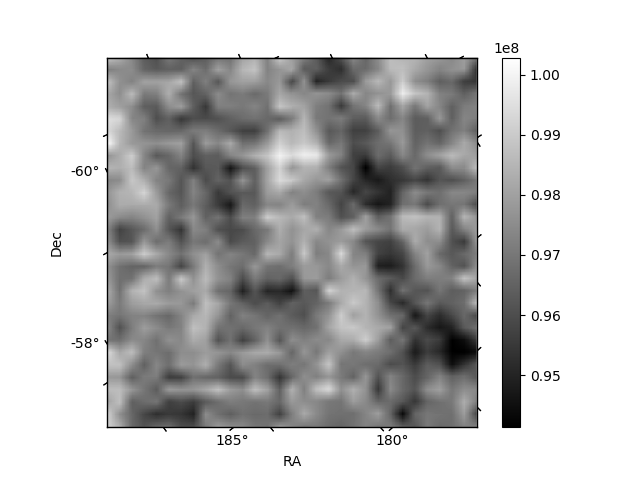
| Quadrant D | 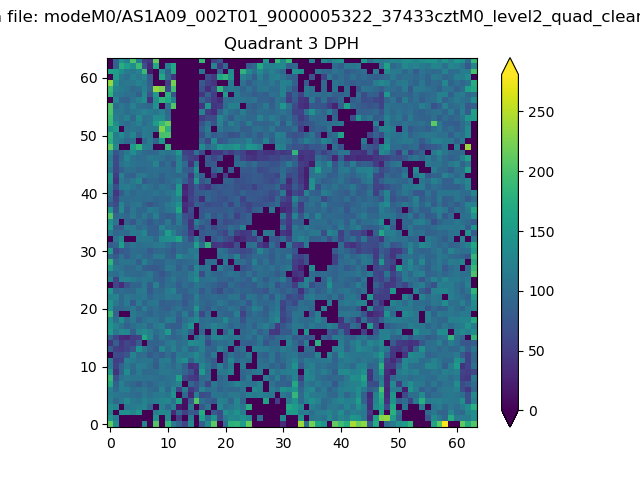 |
 |
Quadrant C |
| Plot type | Count rate plots | Images |
|---|---|---|
| Comparison with Poisson distribution Blue bars denote a histogram of data divided into 1 sec bins. Red curve is a Poisson curve with rate = median count rate of data. |
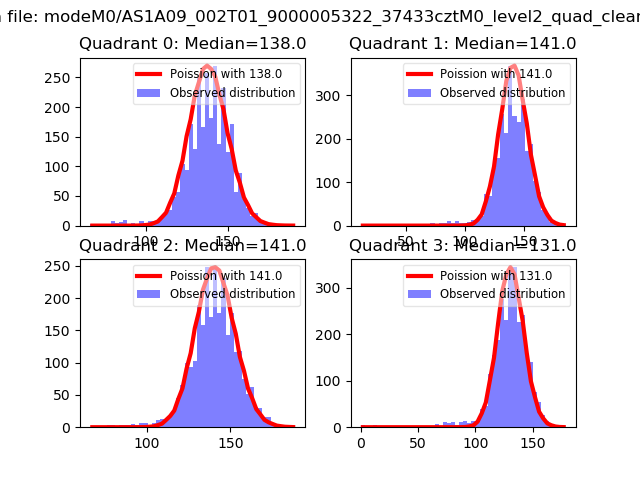 |
 |
| Quadrant-wise count rates Data is divided into 100 sec bins |
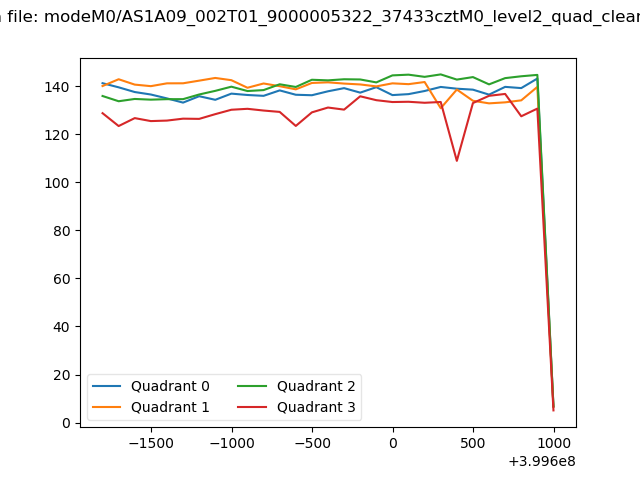 |
|
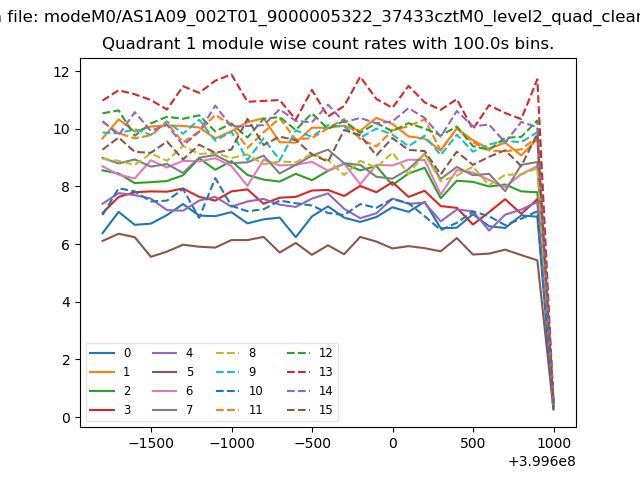
| Module-wise count rates for Quadrant A Data is divided into 100 sec bins |
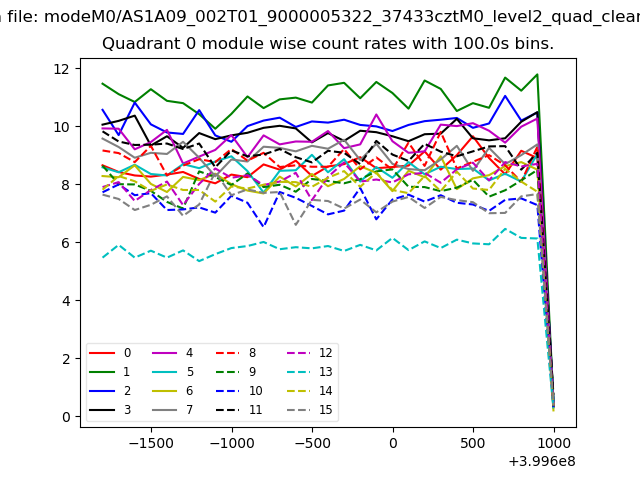 |
 |
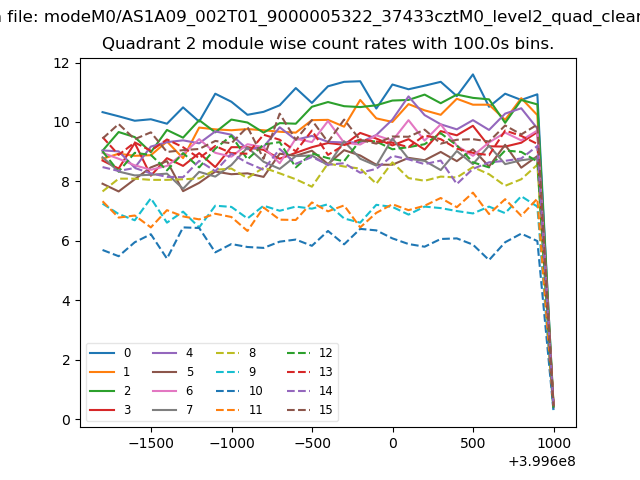
| Module-wise count rates for Quadrant B Data is divided into 100 sec bins |
 |
 |
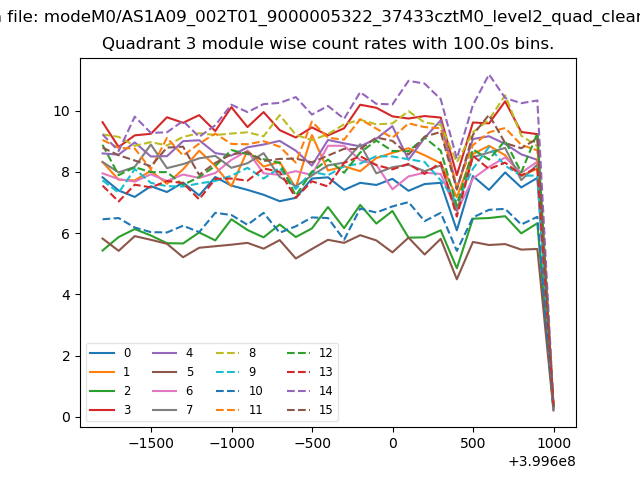
| Module-wise count rates for Quadrant C Data is divided into 100 sec bins |
 |
 |
| Module-wise count rates for Quadrant D Data is divided into 100 sec bins |
 |
 |
| Parameter | Plot |
|---|---|
| CZT HV Monitor | 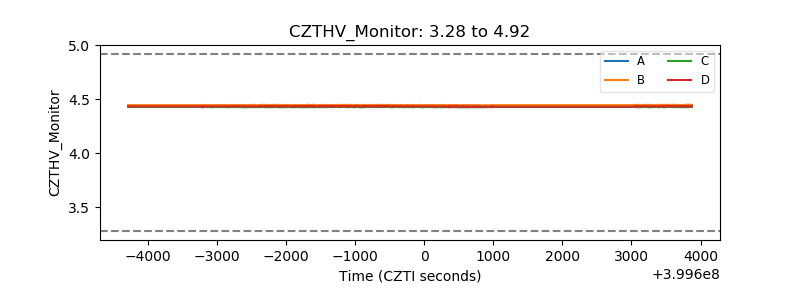 |
| D_VDD | 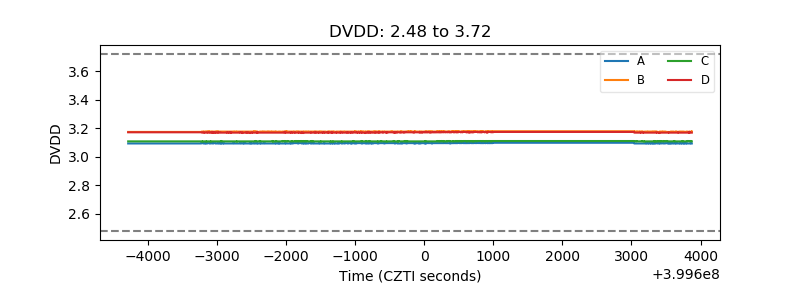 |
| Temperature 1 | 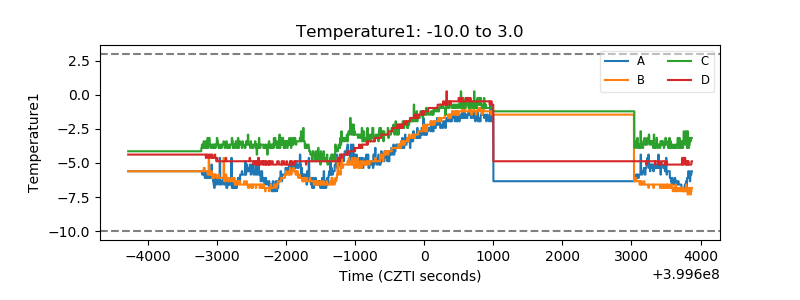 |
| Veto HV Monitor |  |
| Veto LLD | 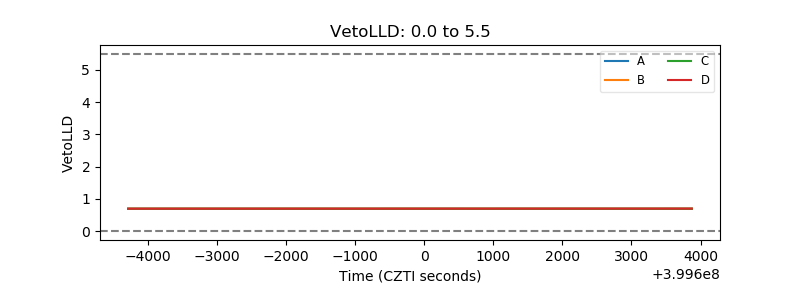 |
| Alpha Counter | 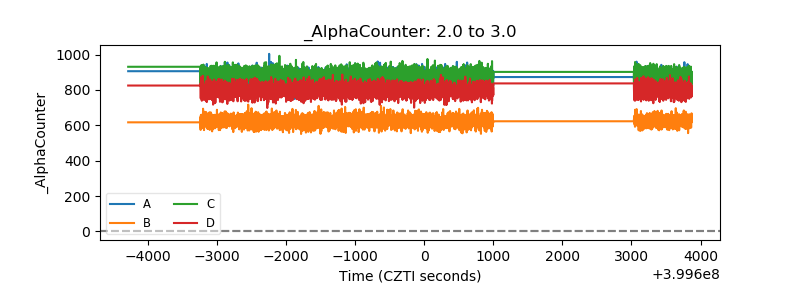 |
| _CPM_Rate | 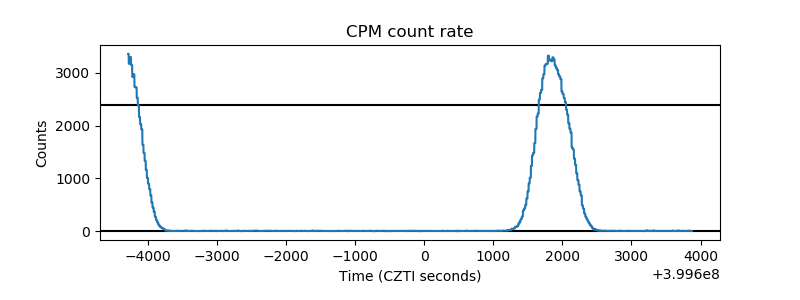 |
| CZT Counter | 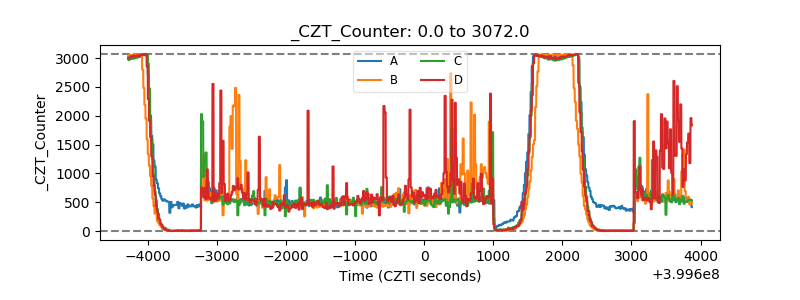 |
| +2.5 Volts monitor | 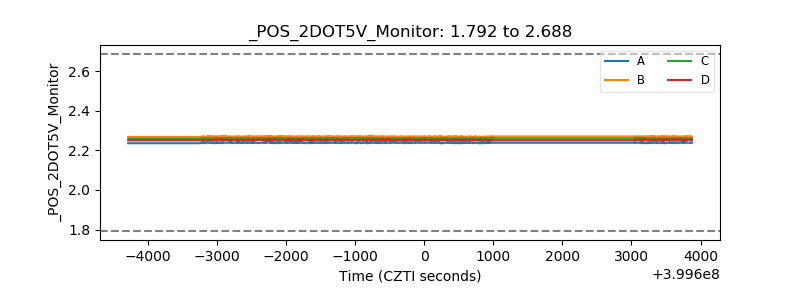 |
| +5 Volts monitor | 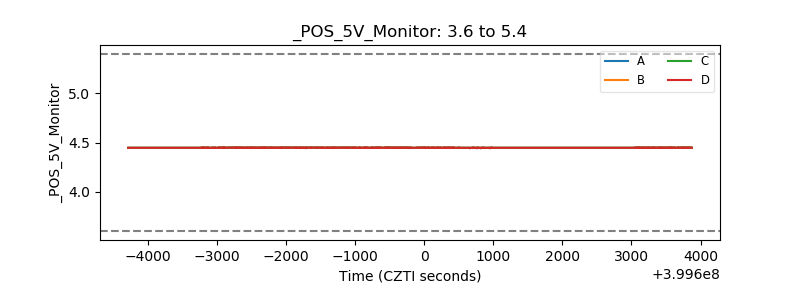 |
| _ROLL_ROT | 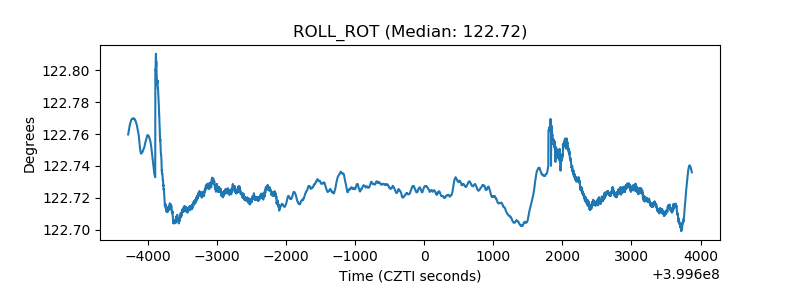 |
| _Roll_DEC | 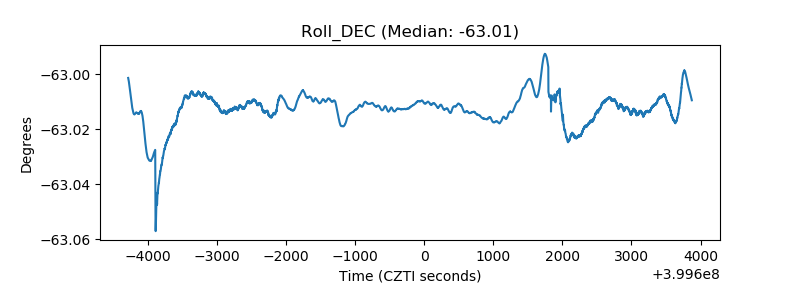 |
| _Roll_RA | 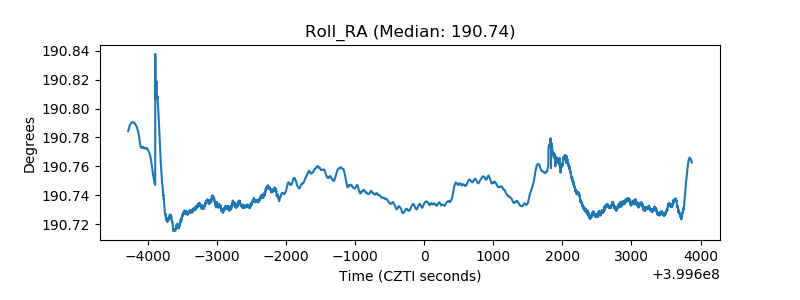 |
| Veto Counter | 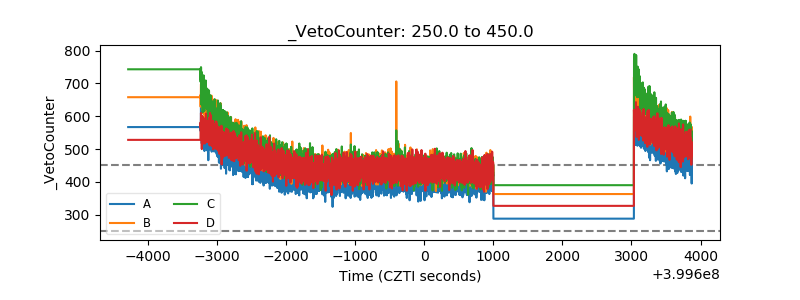 |