| Param | Original file | Final file |
|---|---|---|
| Filename | modeM0/AS1A09_002T01_9000005322_37434cztM0_level2.evt | modeM0/AS1A09_002T01_9000005322_37434cztM0_level2_quad_clean.evt |
| Size (bytes) | 502,600,320 | 71,668,800 |
| Size | 479.3 MB | 68.3 MB |
| Events in quadrant A | 2,696,187 | 467,845 |
| Events in quadrant B | 3,172,304 | 474,652 |
| Events in quadrant C | 3,311,002 | 473,142 |
| Events in quadrant D | 5,710,453 | 410,873 |
| Mode M0 | |||
|---|---|---|---|
| Quadrant | BADHDUFLAG | Total packets | Discarded packets |
| A | 0 | 10785 | 3 |
| B | 0 | 12348 | 2 |
| C | 0 | 12724 | 2 |
| D | 0 | 20274 | 2 |
| Mode M9 | |||
|---|---|---|---|
| Quadrant | BADHDUFLAG | Total packets | Discarded packets |
| A | 0 | 36 | 0 |
| B | 0 | 36 | 0 |
| C | 0 | 36 | 0 |
| D | 0 | 37 | 0 |
| Mode SS | |||
|---|---|---|---|
| Quadrant | BADHDUFLAG | Total packets | Discarded packets |
| A | 0 | 100 | 0 |
| B | 0 | 100 | 0 |
| C | 0 | 100 | 0 |
| D | 0 | 100 | 0 |
| Quadrant | Total seconds | Saturated seconds | Saturation percentage |
|---|---|---|---|
| A | 4894 | 11 | 0.224765% |
| B | 4894 | 121 | 2.472415% |
| C | 4894 | 123 | 2.513282% |
| D | 4894 | 803 | 16.407846% |
Noise dominated data is calculated using 1-second bins in cleaned event files. If a bin has >2000 counts, and if more than 50% of those come from <1% of pixels, then it is considered to be noise-dominated and hence unusable.
| Quadrant | # 1 sec bins | Bins with >0 counts | Bins with >2000 counts | High rate bins dominated by noise | Noise dominated (total time) | Noise dominated (detector-on time) | Marked lightcurve |
|---|---|---|---|---|---|---|---|
| A | 7017 | 4895 | 3 | 3 | 0.04% | 0.06% | 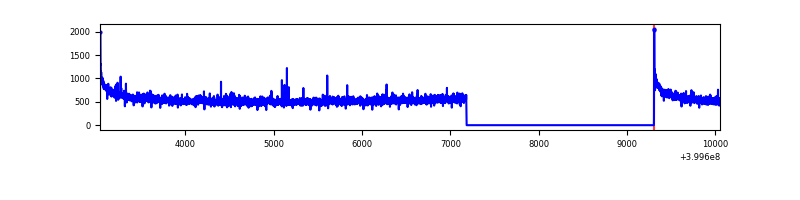 |
| B | 7017 | 4895 | 93 | 93 | 1.33% | 1.90% |  |
| C | 7017 | 4895 | 108 | 108 | 1.54% | 2.21% | 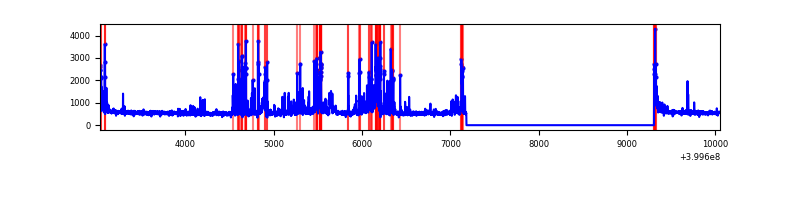 |
| D | 7017 | 4895 | 825 | 825 | 11.76% | 16.85% | 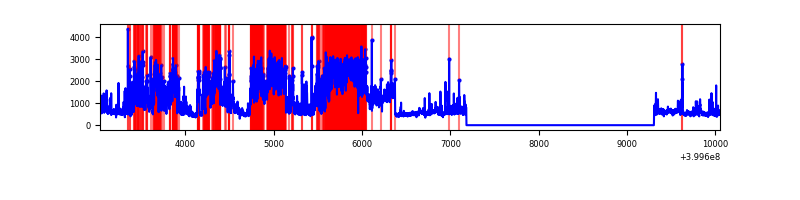 |
Top three noisy pixels from each quadrant. If the there are fewer than three noisy pixels in the level2.evt file, extra rows are filled as -1
| Pixel properties | Quadrant properties | ||||||
|---|---|---|---|---|---|---|---|
| Quadrant | DetID | PixID | Counts | Sigma | Mean | Median | Sigma |
| A | 10 | 83 | 267193 | 2181.04 | 611 | 601 | 122.2 |
| A | 12 | 189 | 31585 | 253.49 | 611 | 601 | 122.2 |
| A | 13 | 6 | 12851 | 100.22 | 611 | 601 | 122.2 |
| B | 0 | 189 | 220630 | 1946.68 | 606 | 592 | 113.0 |
| B | 5 | 255 | 138655 | 1221.45 | 606 | 592 | 113.0 |
| B | 5 | 200 | 128149 | 1128.5 | 606 | 592 | 113.0 |
| C | 14 | 254 | 641870 | 4748.39 | 599 | 605 | 135.0 |
| C | 15 | 214 | 212205 | 1566.84 | 599 | 605 | 135.0 |
| C | 0 | 10 | 104836 | 771.8 | 599 | 605 | 135.0 |
| D | 12 | 227 | 3022740 | 21521.32 | 577 | 563 | 140.4 |
| D | 2 | 153 | 116402 | 824.9 | 577 | 563 | 140.4 |
| D | 2 | 249 | 59365 | 418.74 | 577 | 563 | 140.4 |
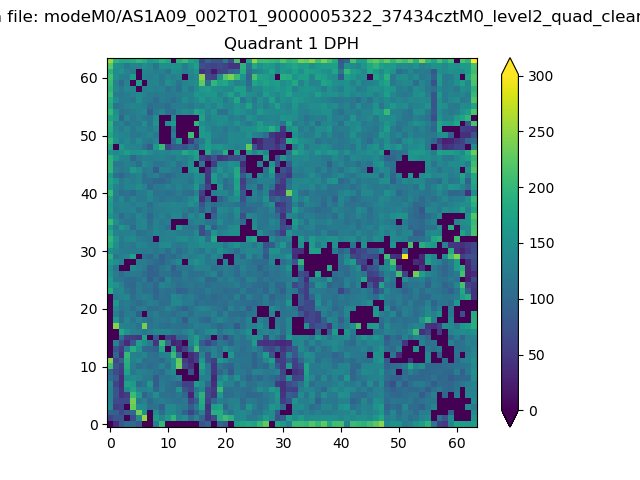
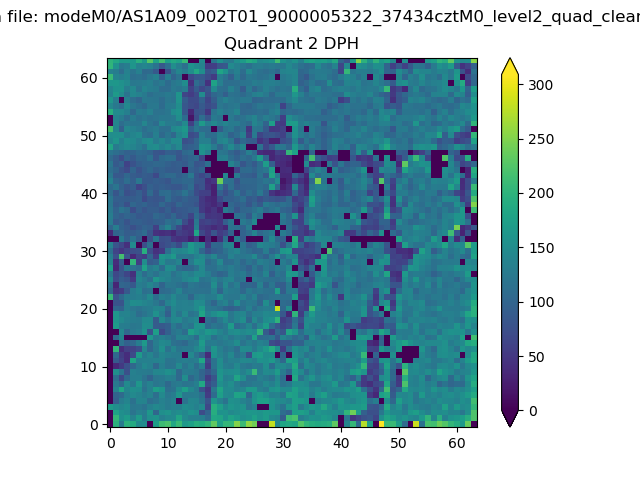
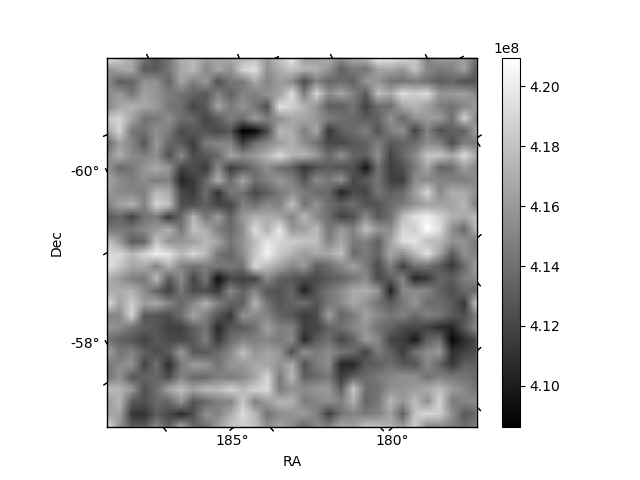
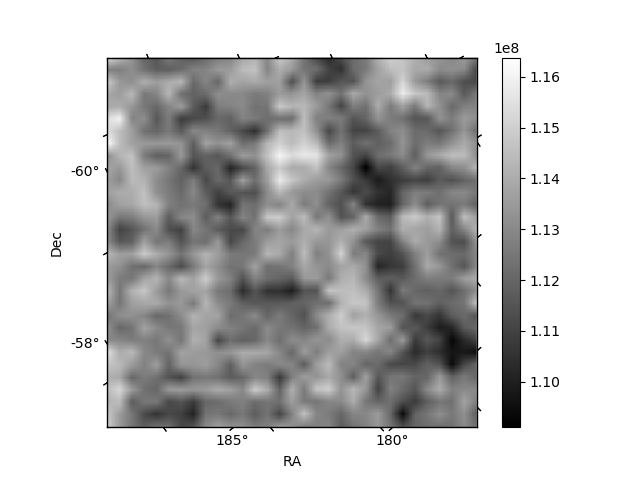
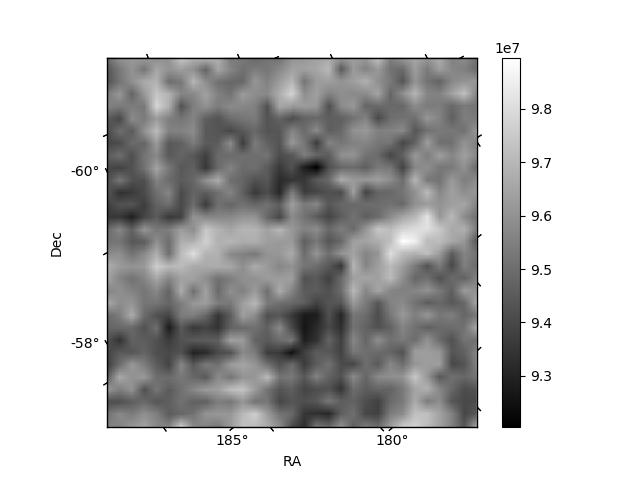
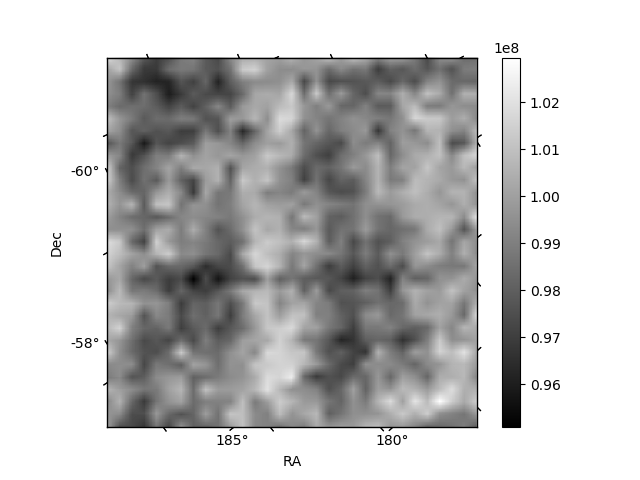
Histogram calculated using DETX and DETY for each event in the final _common_clean file
| Quadrant A | 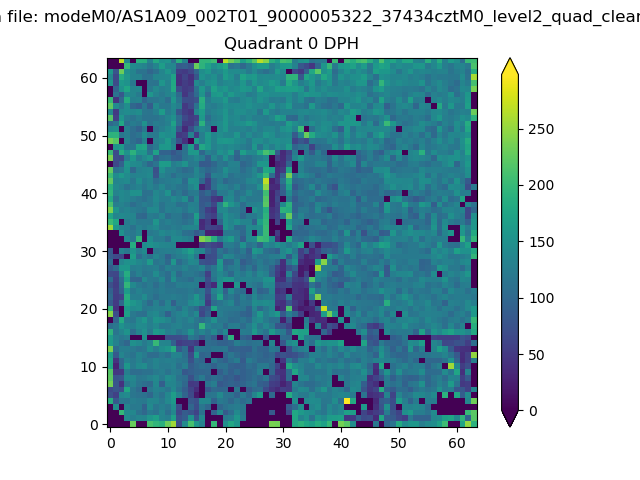 |
 |
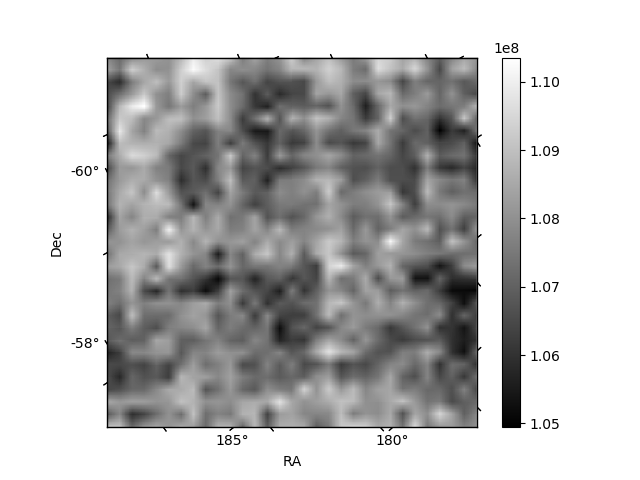
Quadrant B |
|---|---|---|---|
| Quadrant D | 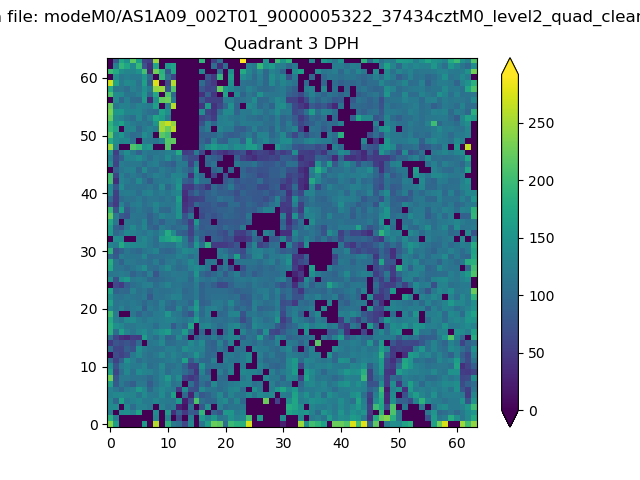 |
 |
Quadrant C |
| Plot type | Count rate plots | Images |
|---|---|---|
| Comparison with Poisson distribution Blue bars denote a histogram of data divided into 1 sec bins. Red curve is a Poisson curve with rate = median count rate of data. |
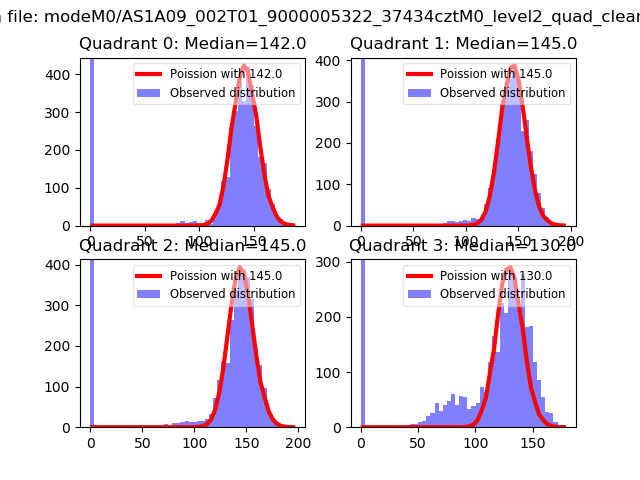 |
 |
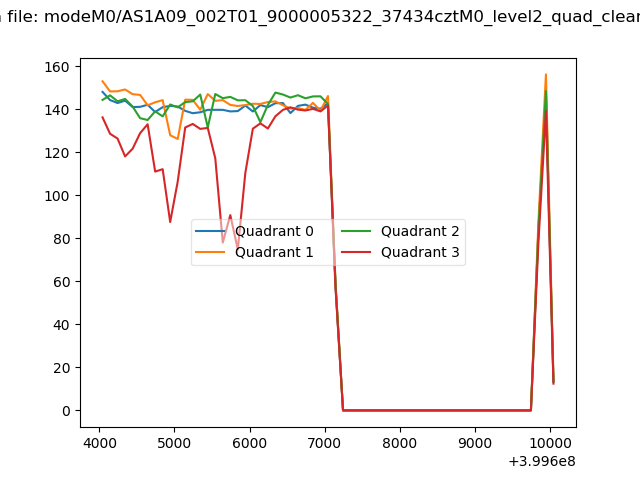
| Quadrant-wise count rates Data is divided into 100 sec bins |
 |
|
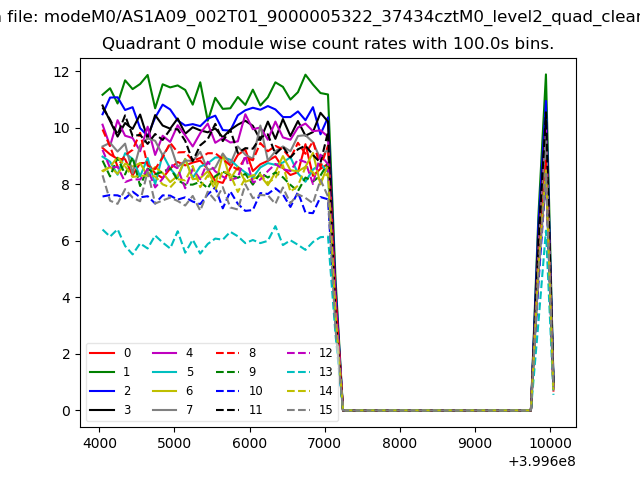
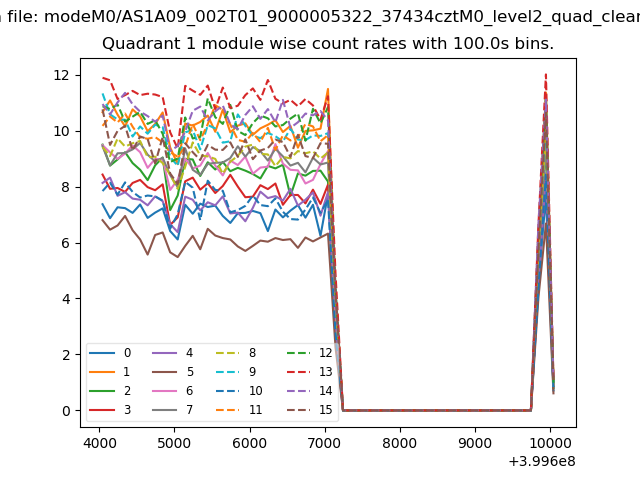
| Module-wise count rates for Quadrant A Data is divided into 100 sec bins |
 |
 |
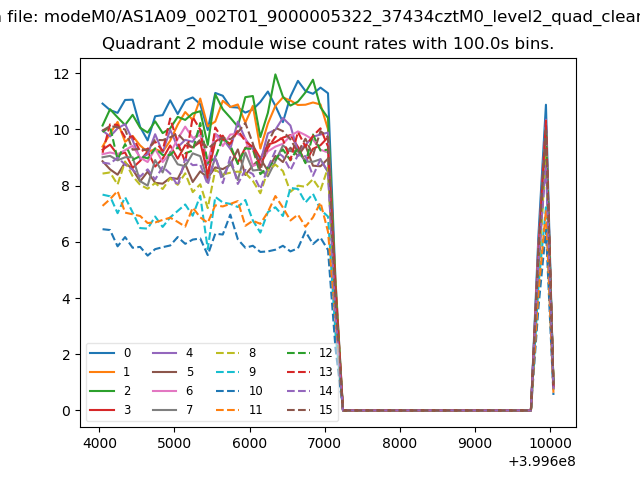
| Module-wise count rates for Quadrant B Data is divided into 100 sec bins |
 |
 |
| Module-wise count rates for Quadrant C Data is divided into 100 sec bins |
 |
 |
| Module-wise count rates for Quadrant D Data is divided into 100 sec bins |
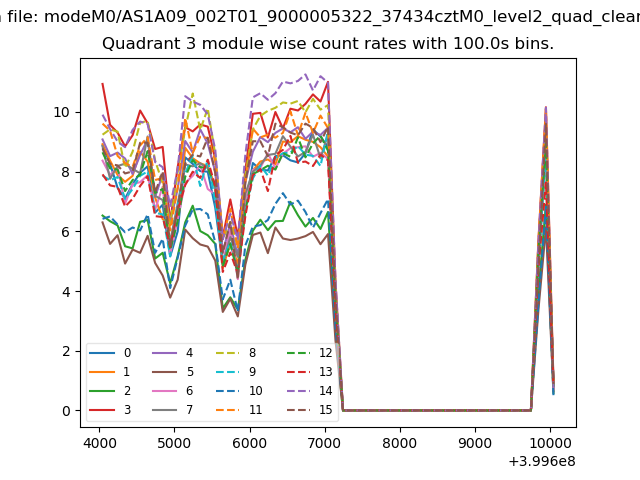 |
 |
| Parameter | Plot |
|---|---|
| CZT HV Monitor | 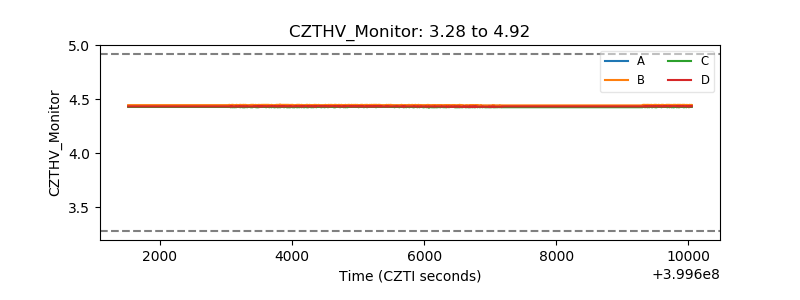 |
| D_VDD | 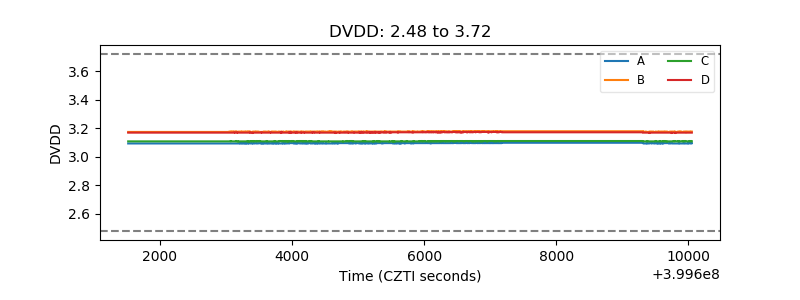 |
| Temperature 1 | 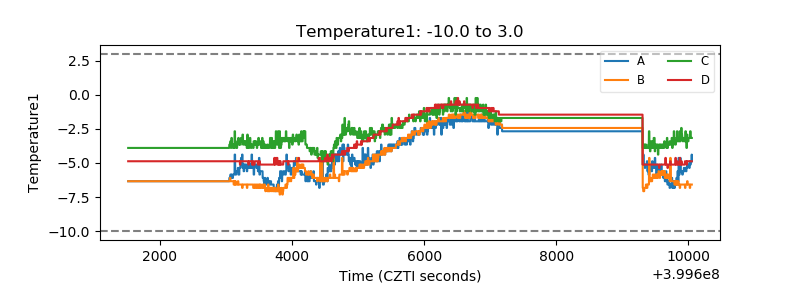 |
| Veto HV Monitor | 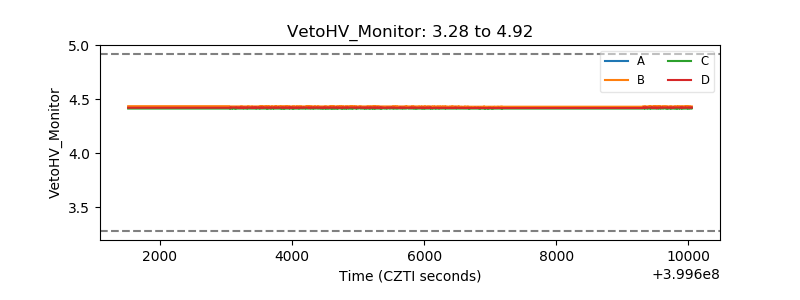 |
| Veto LLD | 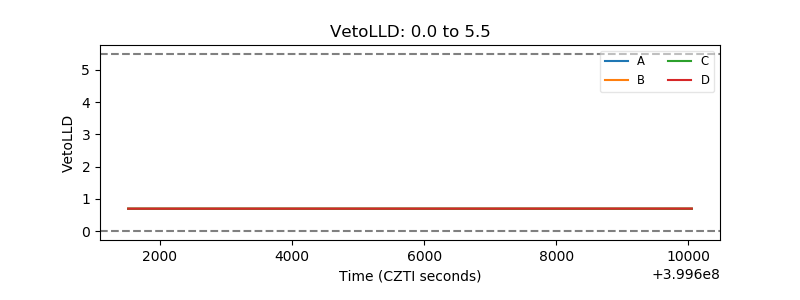 |
| Alpha Counter | 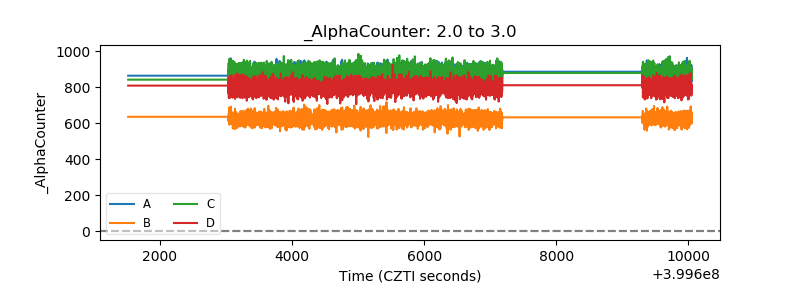 |
| _CPM_Rate | 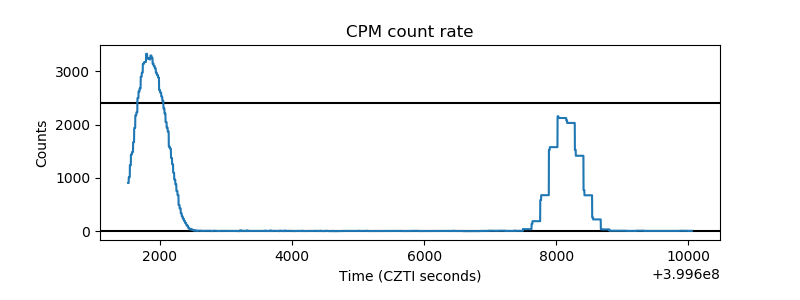 |
| CZT Counter | 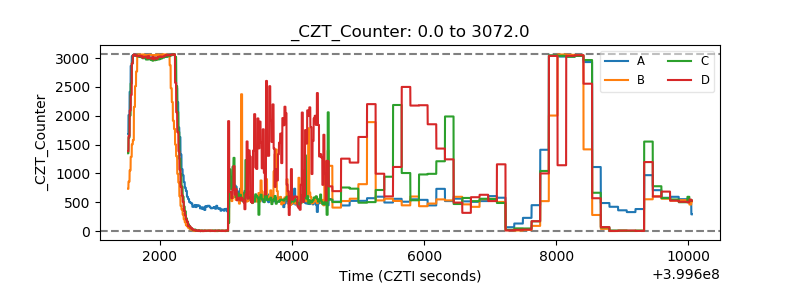 |
| +2.5 Volts monitor | 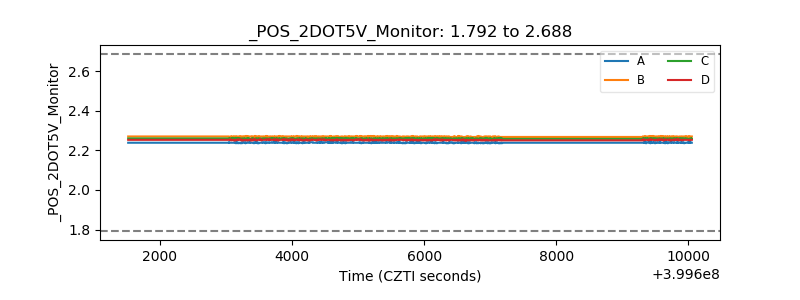 |
| +5 Volts monitor | 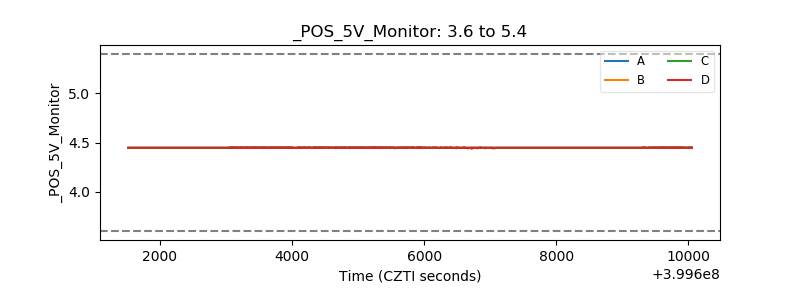 |
| _ROLL_ROT | 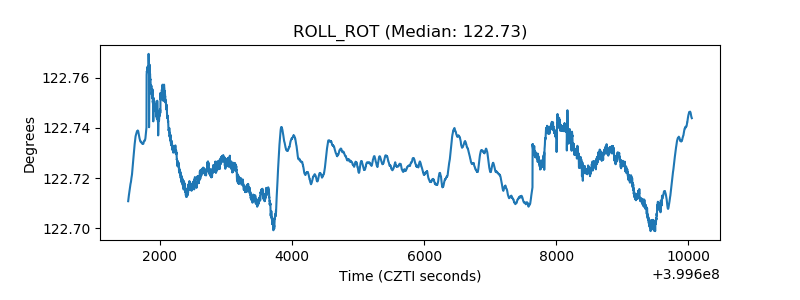 |
| _Roll_DEC | 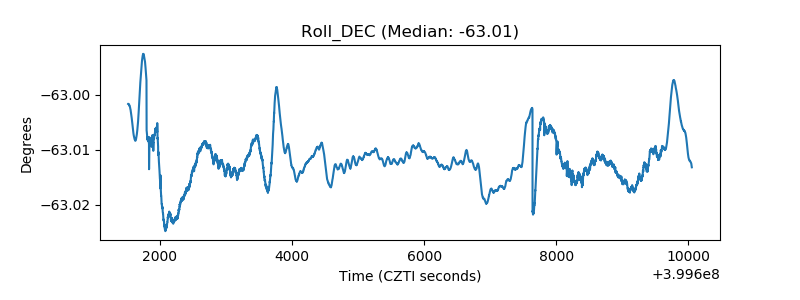 |
| _Roll_RA | 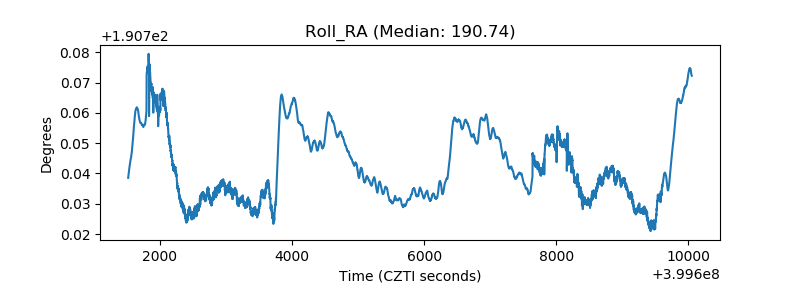 |
| Veto Counter | 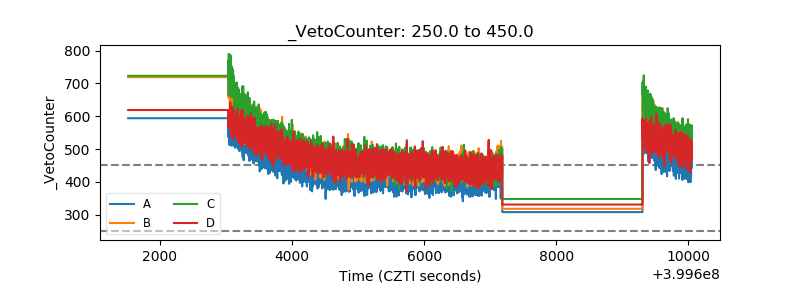 |