| Param | Original file | Final file |
|---|---|---|
| Filename | modeM0/AS1A09_002T01_9000005322_37435cztM0_level2.evt | modeM0/AS1A09_002T01_9000005322_37435cztM0_level2_quad_clean.evt |
| Size (bytes) | 380,880,000 | 88,686,720 |
| Size | 363.2 MB | 84.6 MB |
| Events in quadrant A | 2,642,849 | 584,910 |
| Events in quadrant B | 2,745,106 | 599,423 |
| Events in quadrant C | 2,832,508 | 595,926 |
| Events in quadrant D | 2,979,846 | 560,315 |
| Mode M0 | |||
|---|---|---|---|
| Quadrant | BADHDUFLAG | Total packets | Discarded packets |
| A | 0 | 10634 | 3 |
| B | 0 | 11084 | 2 |
| C | 0 | 11036 | 2 |
| D | 0 | 11948 | 2 |
| Mode M9 | |||
|---|---|---|---|
| Quadrant | BADHDUFLAG | Total packets | Discarded packets |
| A | 0 | 32 | 0 |
| B | 0 | 32 | 0 |
| C | 0 | 32 | 0 |
| D | 0 | 33 | 0 |
| Mode SS | |||
|---|---|---|---|
| Quadrant | BADHDUFLAG | Total packets | Discarded packets |
| A | 0 | 102 | 0 |
| B | 0 | 102 | 0 |
| C | 0 | 102 | 0 |
| D | 0 | 102 | 0 |
| Quadrant | Total seconds | Saturated seconds | Saturation percentage |
|---|---|---|---|
| A | 4916 | 10 | 0.203417% |
| B | 4916 | 58 | 1.179821% |
| C | 4916 | 85 | 1.729048% |
| D | 4916 | 69 | 1.403580% |
Noise dominated data is calculated using 1-second bins in cleaned event files. If a bin has >2000 counts, and if more than 50% of those come from <1% of pixels, then it is considered to be noise-dominated and hence unusable.
| Quadrant | # 1 sec bins | Bins with >0 counts | Bins with >2000 counts | High rate bins dominated by noise | Noise dominated (total time) | Noise dominated (detector-on time) | Marked lightcurve |
|---|---|---|---|---|---|---|---|
| A | 7040 | 4918 | 4 | 4 | 0.06% | 0.08% | 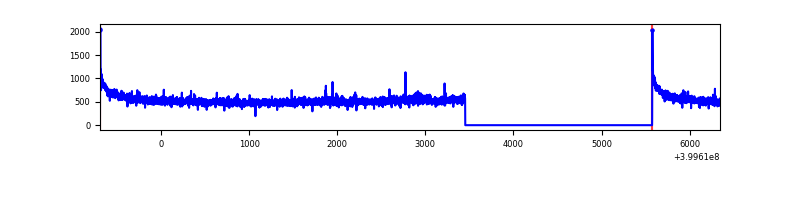 |
| B | 7040 | 4918 | 29 | 29 | 0.41% | 0.59% | 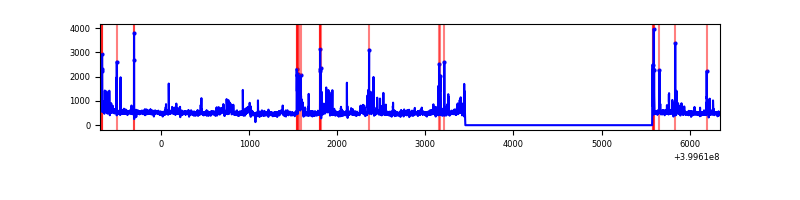 |
| C | 7040 | 4918 | 48 | 48 | 0.68% | 0.98% | 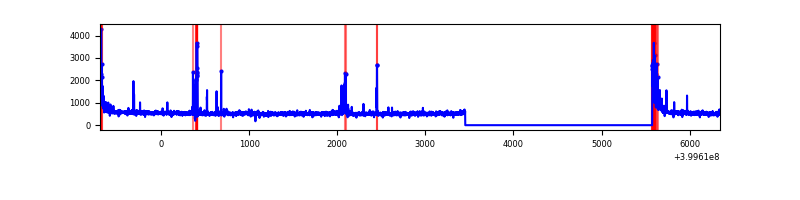 |
| D | 7040 | 4918 | 65 | 65 | 0.92% | 1.32% | 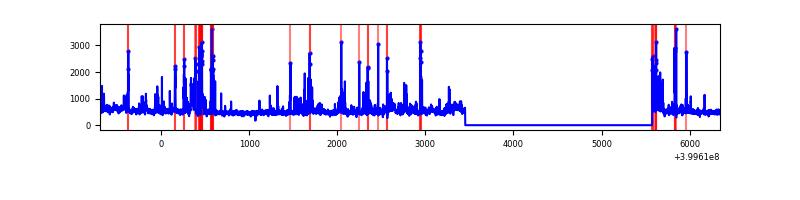 |
Top three noisy pixels from each quadrant. If the there are fewer than three noisy pixels in the level2.evt file, extra rows are filled as -1
| Pixel properties | Quadrant properties | ||||||
|---|---|---|---|---|---|---|---|
| Quadrant | DetID | PixID | Counts | Sigma | Mean | Median | Sigma |
| A | 10 | 83 | 264513 | 2175.38 | 602 | 591 | 121.3 |
| A | 12 | 189 | 30280 | 244.71 | 602 | 591 | 121.3 |
| A | 13 | 6 | 9583 | 74.12 | 602 | 591 | 121.3 |
| B | 0 | 189 | 86027 | 763.08 | 597 | 582 | 112.0 |
| B | 0 | 229 | 84816 | 752.26 | 597 | 582 | 112.0 |
| B | 5 | 184 | 54459 | 481.15 | 597 | 582 | 112.0 |
| C | 15 | 214 | 225503 | 1661.51 | 591 | 597 | 135.4 |
| C | 0 | 10 | 156068 | 1148.56 | 591 | 597 | 135.4 |
| C | 14 | 254 | 132347 | 973.32 | 591 | 597 | 135.4 |
| D | 10 | 253 | 212347 | 1501.52 | 592 | 576 | 141.0 |
| D | 2 | 249 | 161849 | 1143.47 | 592 | 576 | 141.0 |
| D | 12 | 227 | 150419 | 1062.43 | 592 | 576 | 141.0 |
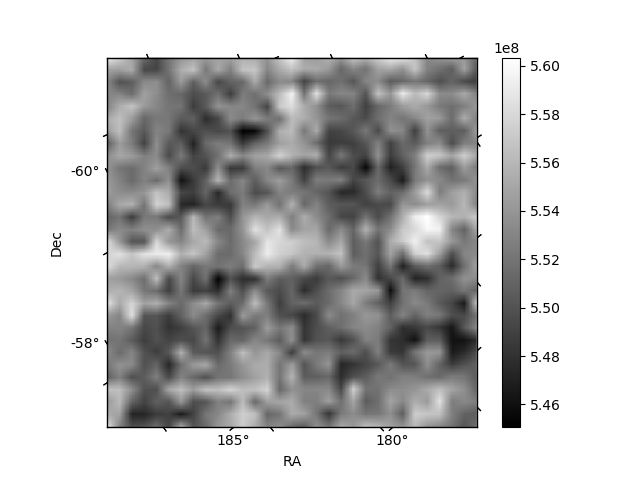
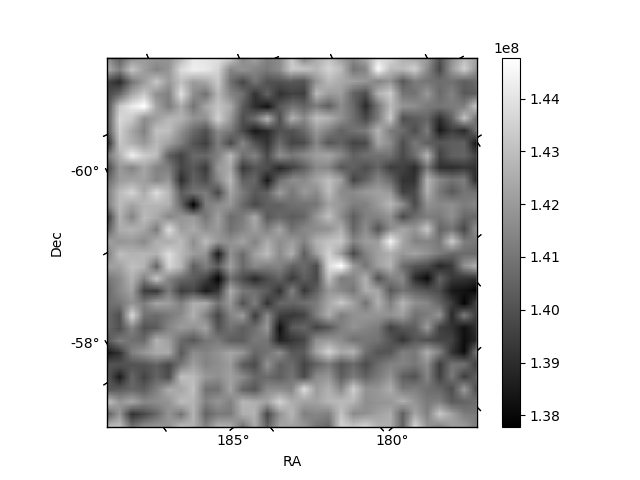
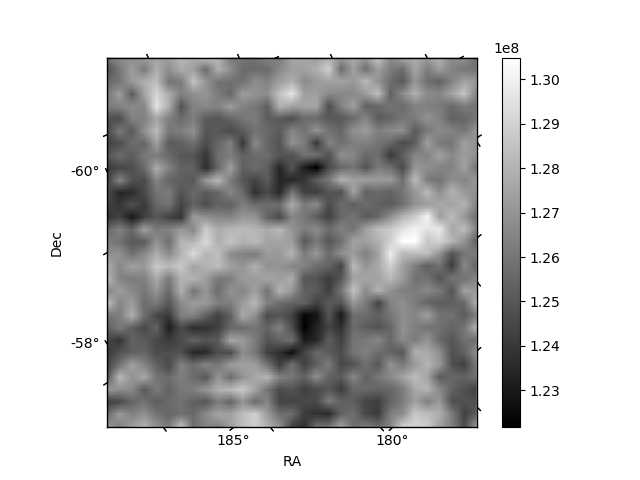
Histogram calculated using DETX and DETY for each event in the final _common_clean file
| Quadrant A | 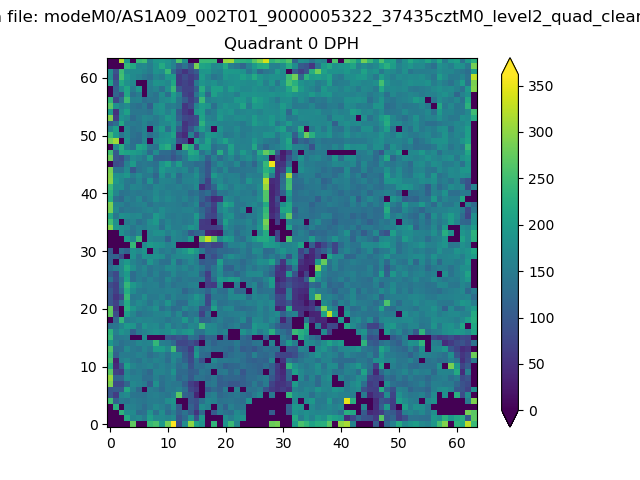 |
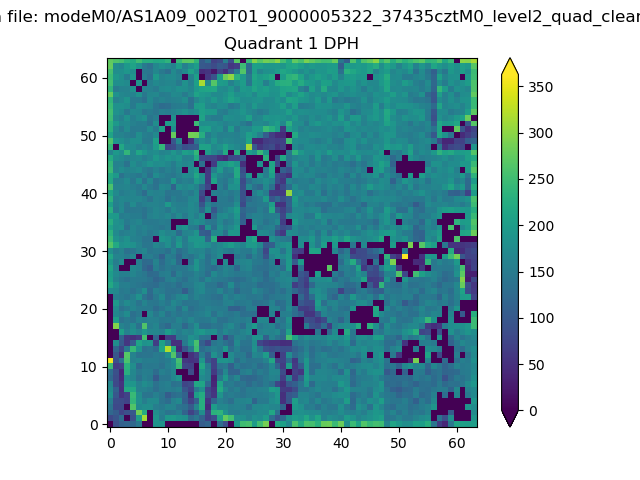 |
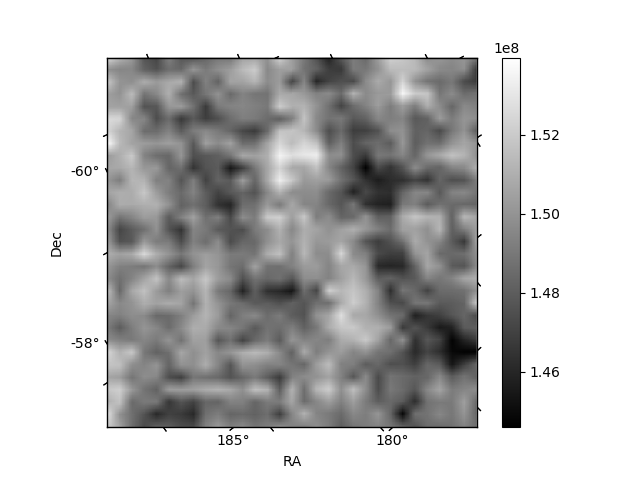
Quadrant B |
|---|---|---|---|
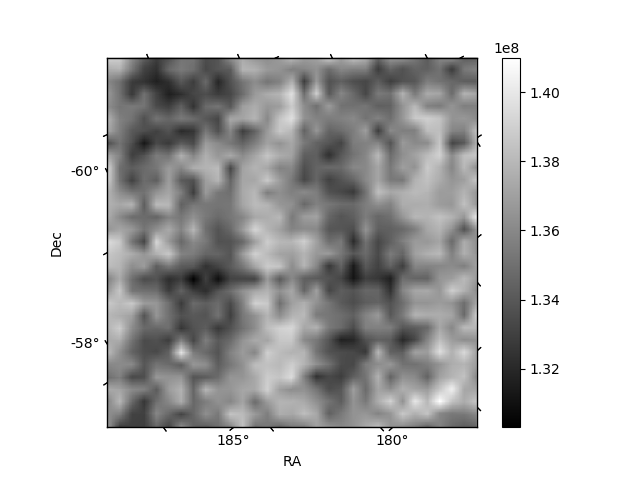
| Quadrant D | 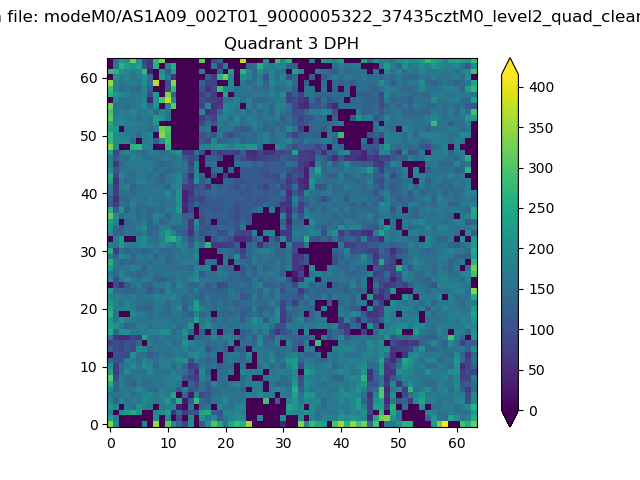 |
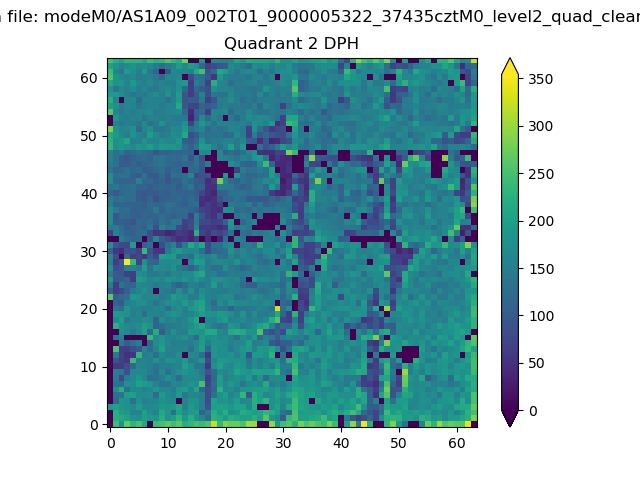 |
Quadrant C |
| Plot type | Count rate plots | Images |
|---|---|---|
| Comparison with Poisson distribution Blue bars denote a histogram of data divided into 1 sec bins. Red curve is a Poisson curve with rate = median count rate of data. |
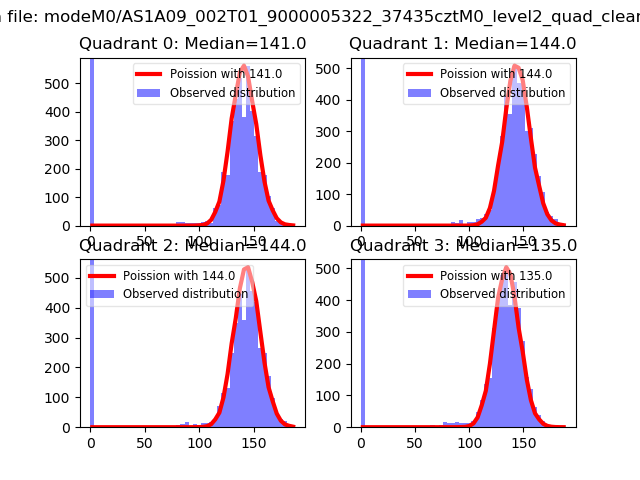 |
 |
| Quadrant-wise count rates Data is divided into 100 sec bins |
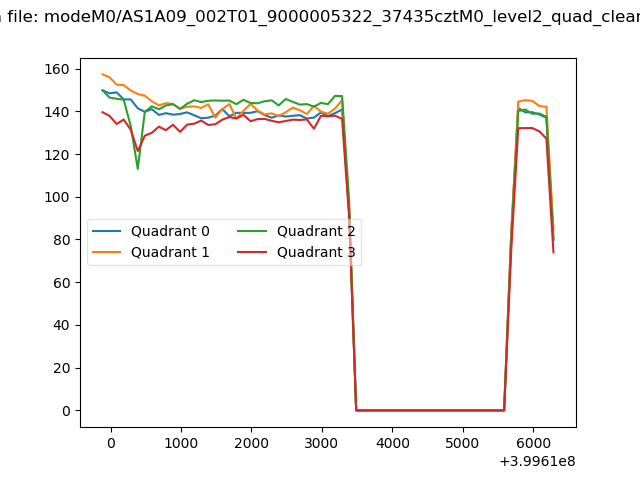 |
|
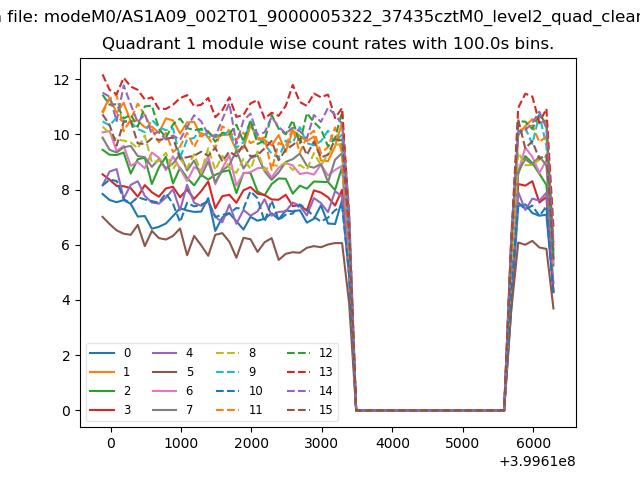
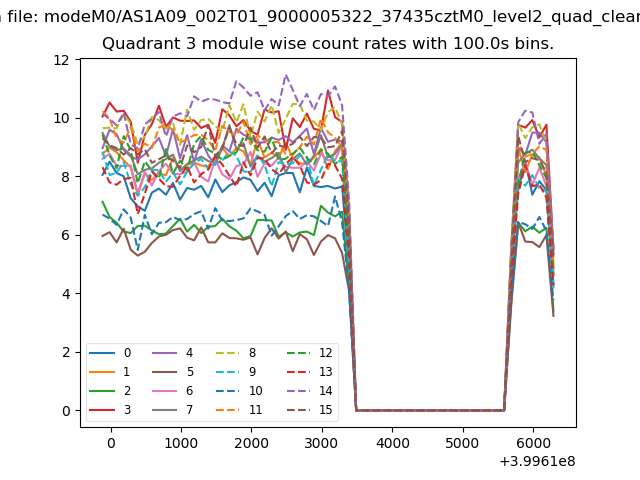
| Module-wise count rates for Quadrant A Data is divided into 100 sec bins |
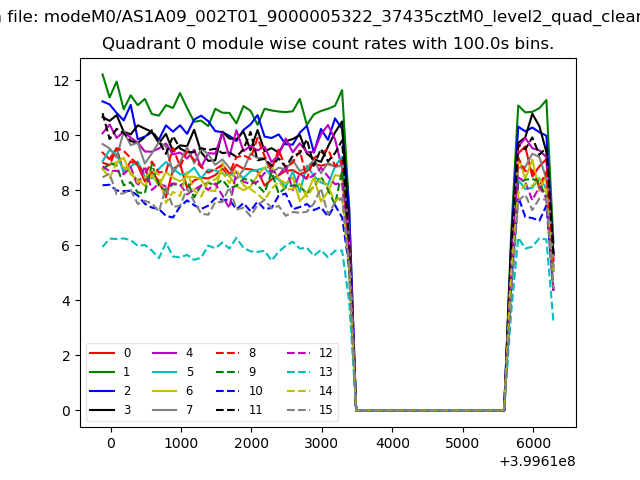 |
 |
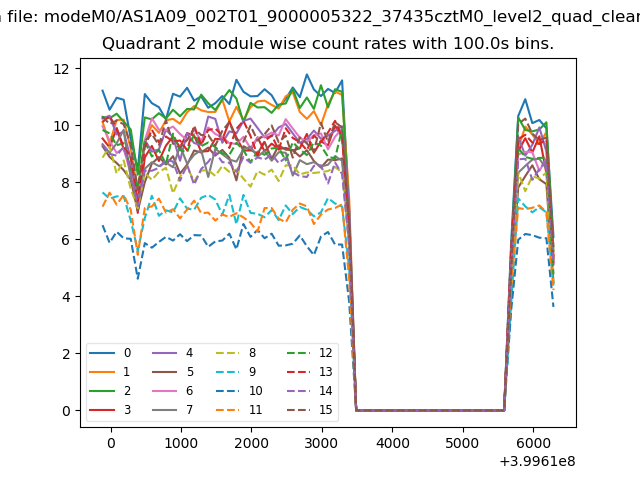
| Module-wise count rates for Quadrant B Data is divided into 100 sec bins |
 |
 |
| Module-wise count rates for Quadrant C Data is divided into 100 sec bins |
 |
 |
| Module-wise count rates for Quadrant D Data is divided into 100 sec bins |
 |
 |
| Parameter | Plot |
|---|---|
| CZT HV Monitor | 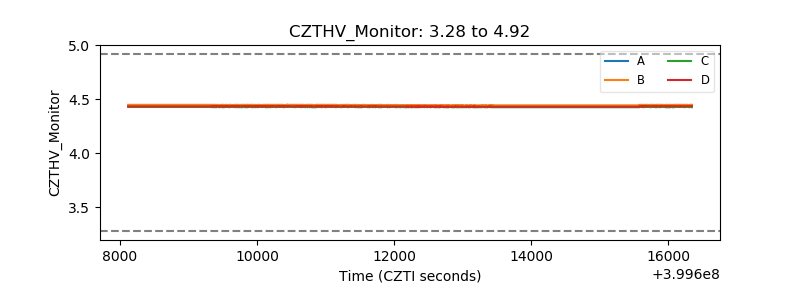 |
| D_VDD | 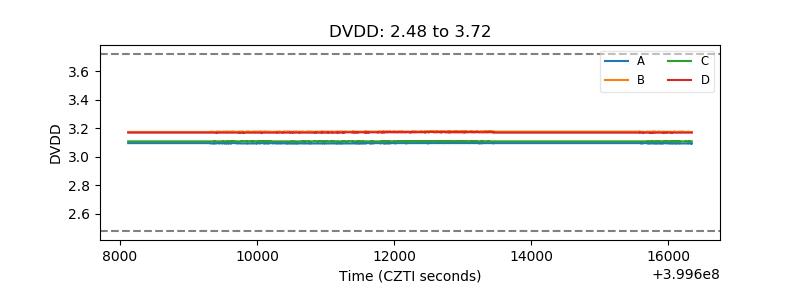 |
| Temperature 1 | 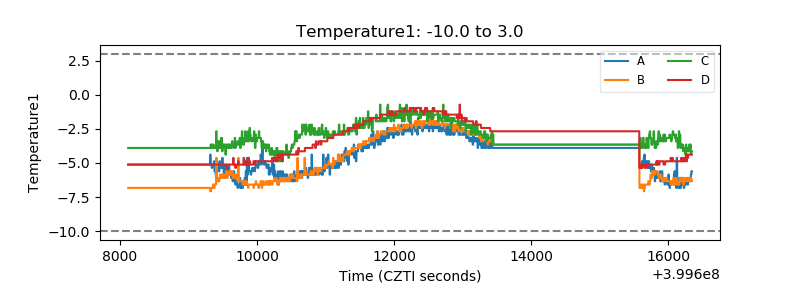 |
| Veto HV Monitor | 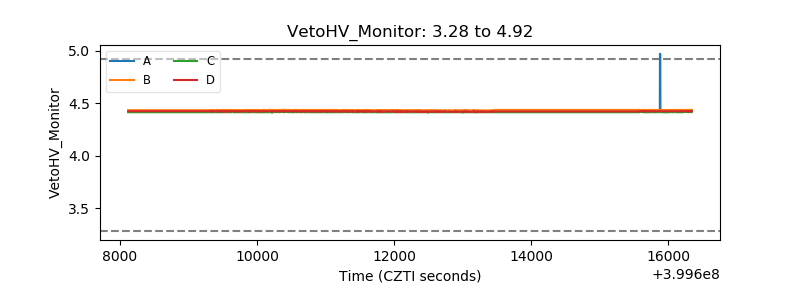 |
| Veto LLD | 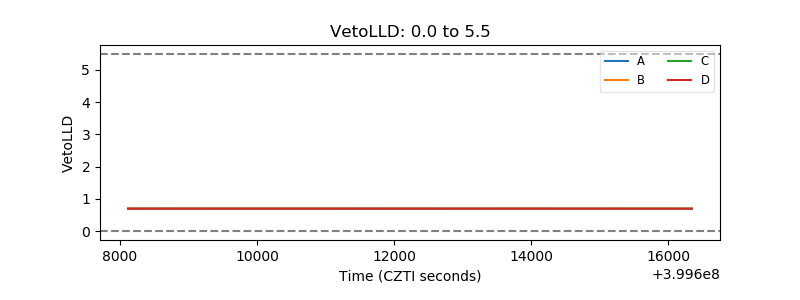 |
| Alpha Counter | 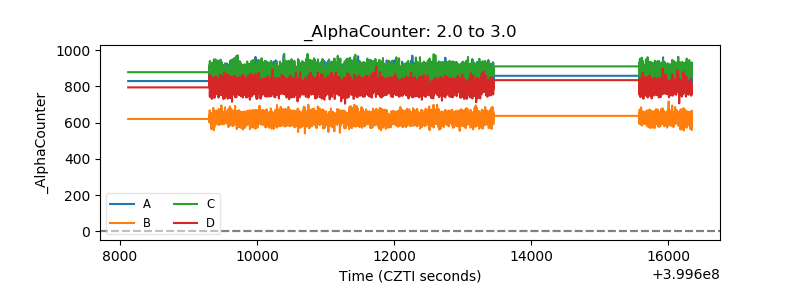 |
| _CPM_Rate | 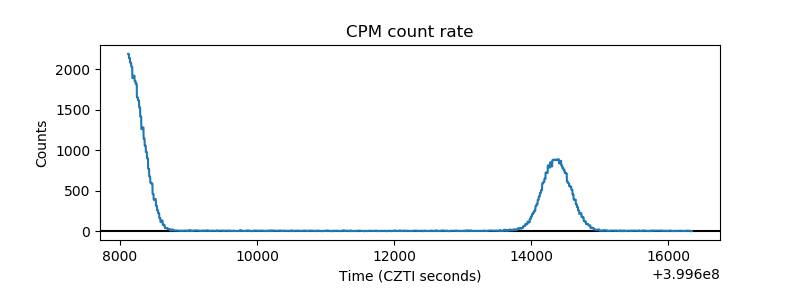 |
| CZT Counter | 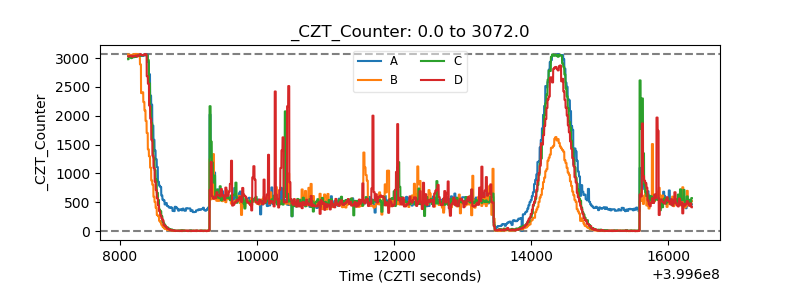 |
| +2.5 Volts monitor | 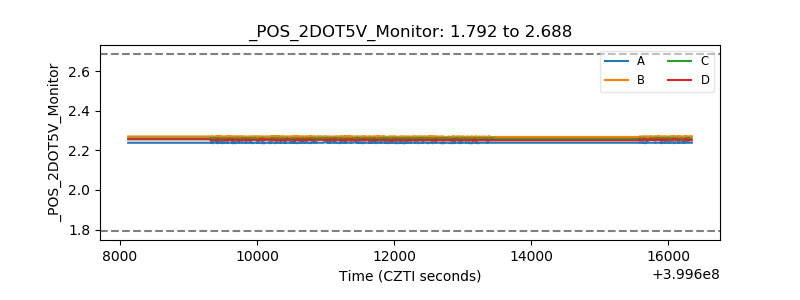 |
| +5 Volts monitor | 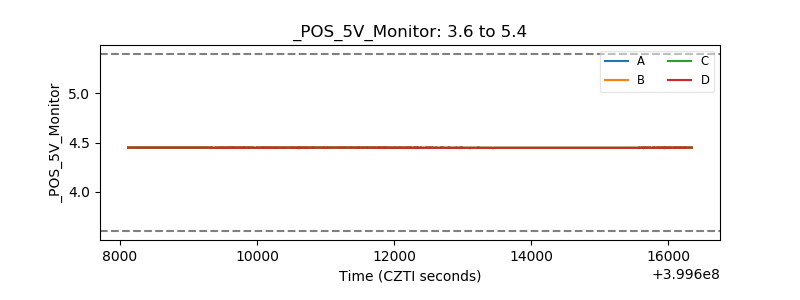 |
| _ROLL_ROT | 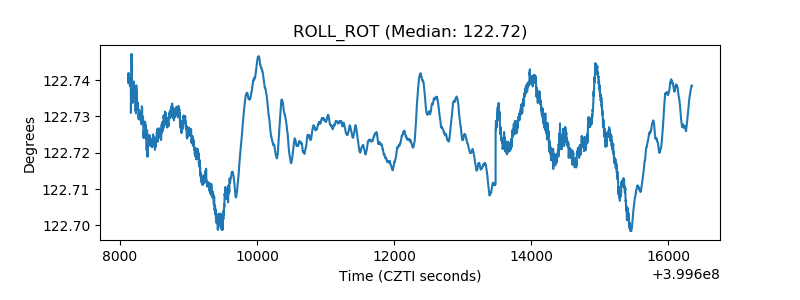 |
| _Roll_DEC | 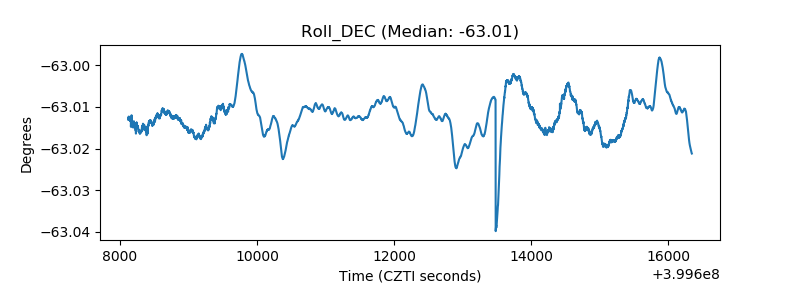 |
| _Roll_RA | 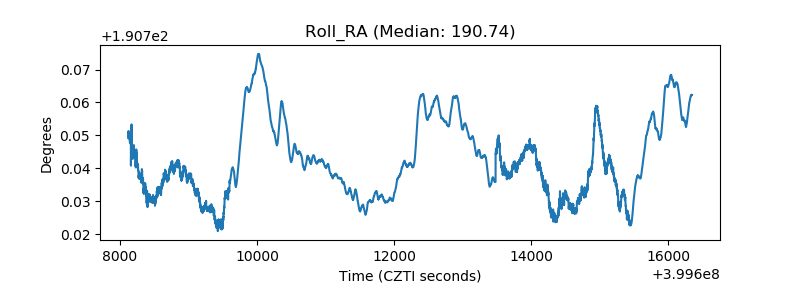 |
| Veto Counter | 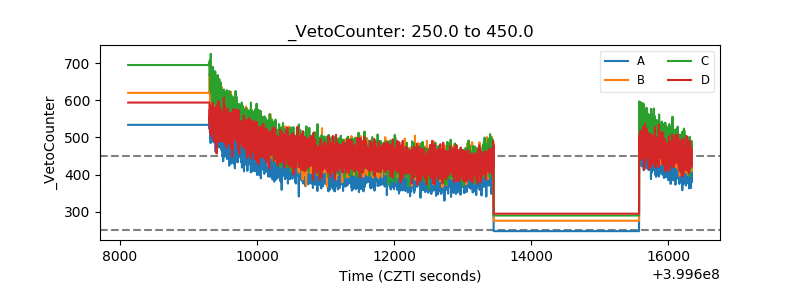 |