| Param | Original file | Final file |
|---|---|---|
| Filename | modeM0/AS1A09_002T01_9000005322_37436cztM0_level2.evt | modeM0/AS1A09_002T01_9000005322_37436cztM0_level2_quad_clean.evt |
| Size (bytes) | 418,374,720 | 97,695,360 |
| Size | 399.0 MB | 93.2 MB |
| Events in quadrant A | 2,810,853 | 651,032 |
| Events in quadrant B | 3,009,072 | 660,739 |
| Events in quadrant C | 2,936,098 | 668,378 |
| Events in quadrant D | 3,569,371 | 622,513 |
| Mode M0 | |||
|---|---|---|---|
| Quadrant | BADHDUFLAG | Total packets | Discarded packets |
| A | 0 | 11361 | 3 |
| B | 0 | 12143 | 2 |
| C | 0 | 11598 | 2 |
| D | 0 | 13957 | 2 |
| Mode M9 | |||
|---|---|---|---|
| Quadrant | BADHDUFLAG | Total packets | Discarded packets |
| A | 0 | 35 | 0 |
| B | 0 | 35 | 0 |
| C | 0 | 35 | 0 |
| D | 0 | 36 | 0 |
| Mode SS | |||
|---|---|---|---|
| Quadrant | BADHDUFLAG | Total packets | Discarded packets |
| A | 0 | 102 | 0 |
| B | 0 | 102 | 0 |
| C | 0 | 102 | 0 |
| D | 0 | 102 | 0 |
| Quadrant | Total seconds | Saturated seconds | Saturation percentage |
|---|---|---|---|
| A | 5086 | 21 | 0.412898% |
| B | 5086 | 146 | 2.870625% |
| C | 5086 | 111 | 2.182462% |
| D | 5086 | 179 | 3.519465% |
Noise dominated data is calculated using 1-second bins in cleaned event files. If a bin has >2000 counts, and if more than 50% of those come from <1% of pixels, then it is considered to be noise-dominated and hence unusable.
| Quadrant | # 1 sec bins | Bins with >0 counts | Bins with >2000 counts | High rate bins dominated by noise | Noise dominated (total time) | Noise dominated (detector-on time) | Marked lightcurve |
|---|---|---|---|---|---|---|---|
| A | 7119 | 5087 | 8 | 8 | 0.11% | 0.16% | 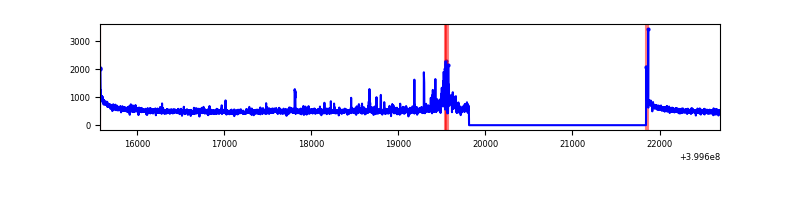 |
| B | 7119 | 5087 | 103 | 103 | 1.45% | 2.02% | 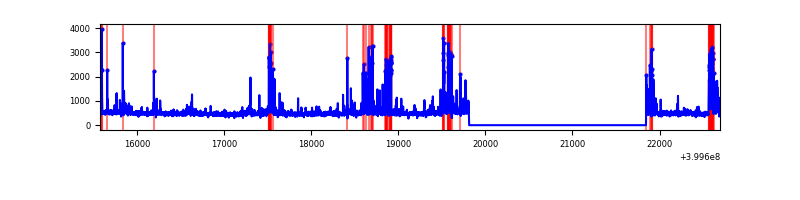 |
| C | 7119 | 5087 | 96 | 96 | 1.35% | 1.89% | 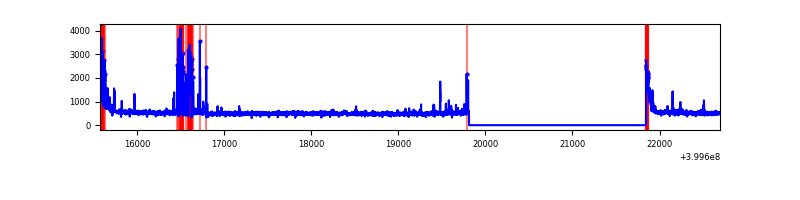 |
| D | 7119 | 5087 | 175 | 175 | 2.46% | 3.44% | 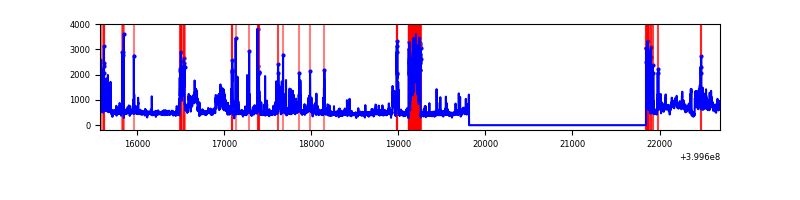 |
Top three noisy pixels from each quadrant. If the there are fewer than three noisy pixels in the level2.evt file, extra rows are filled as -1
| Pixel properties | Quadrant properties | ||||||
|---|---|---|---|---|---|---|---|
| Quadrant | DetID | PixID | Counts | Sigma | Mean | Median | Sigma |
| A | 10 | 83 | 275619 | 2319.04 | 597 | 586 | 118.6 |
| A | 15 | 222 | 146713 | 1232.12 | 597 | 586 | 118.6 |
| A | 12 | 189 | 45528 | 378.94 | 597 | 586 | 118.6 |
| B | 15 | 35 | 248518 | 2252.87 | 585 | 572 | 110.1 |
| B | 4 | 171 | 128352 | 1161.02 | 585 | 572 | 110.1 |
| B | 0 | 189 | 92379 | 834.17 | 585 | 572 | 110.1 |
| C | 14 | 254 | 233947 | 1720.14 | 584 | 588 | 135.7 |
| C | 15 | 214 | 232314 | 1708.11 | 584 | 588 | 135.7 |
| C | 0 | 10 | 182403 | 1340.2 | 584 | 588 | 135.7 |
| D | 12 | 227 | 573025 | 4114.42 | 581 | 566 | 139.1 |
| D | 10 | 253 | 294903 | 2115.48 | 581 | 566 | 139.1 |
| D | 2 | 249 | 204113 | 1462.95 | 581 | 566 | 139.1 |
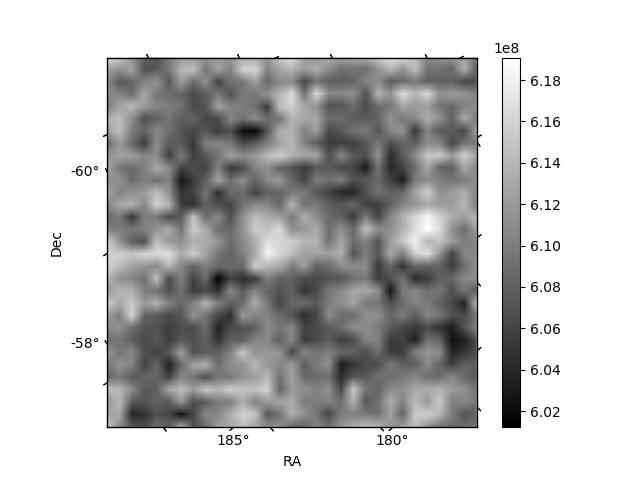
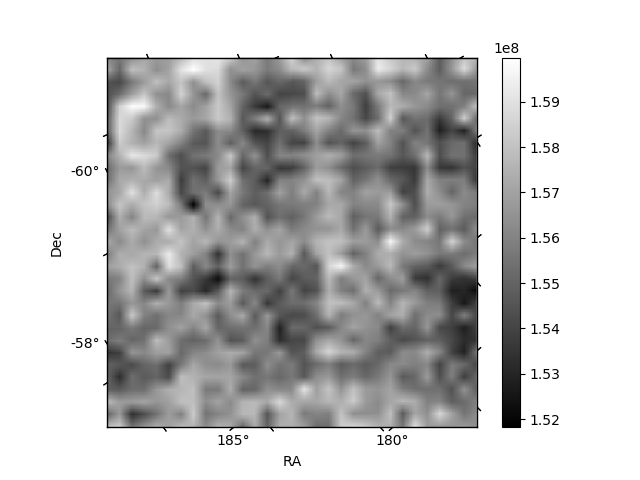
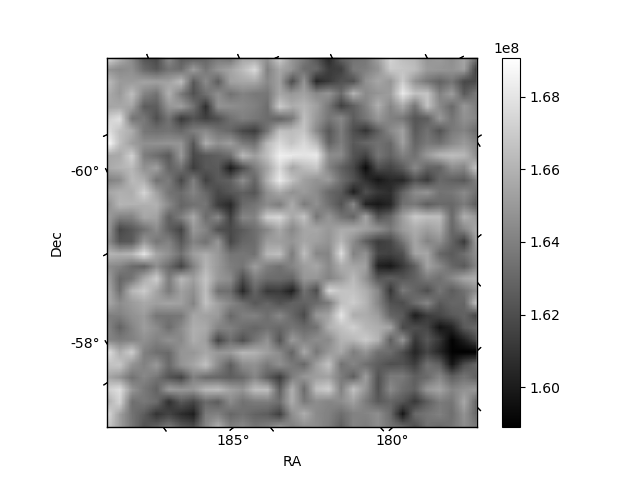
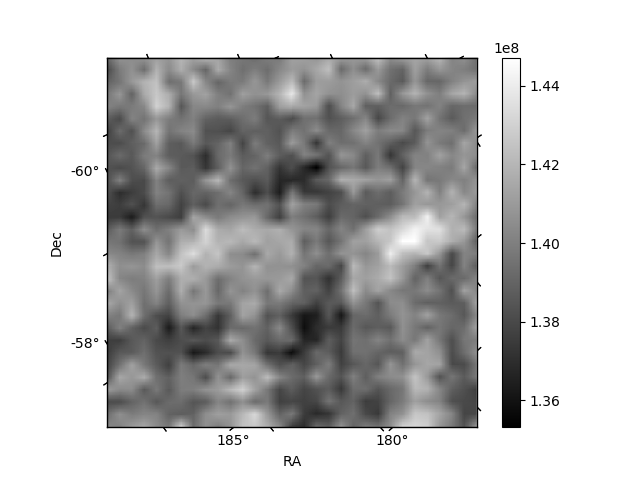
Histogram calculated using DETX and DETY for each event in the final _common_clean file
| Quadrant A | 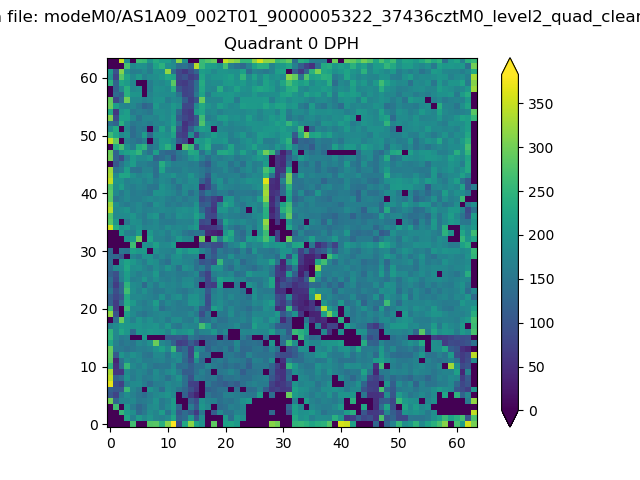 |
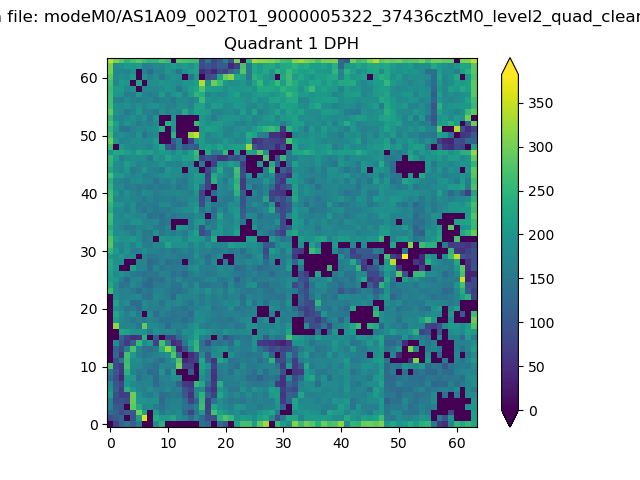 |
Quadrant B |
|---|---|---|---|
| Quadrant D | 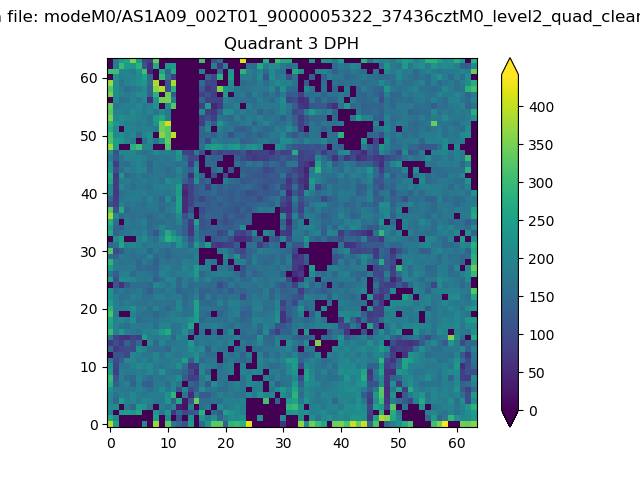 |
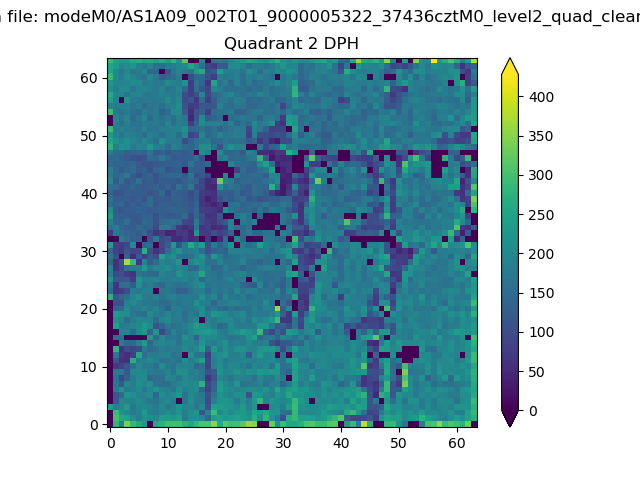 |
Quadrant C |
| Plot type | Count rate plots | Images |
|---|---|---|
| Comparison with Poisson distribution Blue bars denote a histogram of data divided into 1 sec bins. Red curve is a Poisson curve with rate = median count rate of data. |
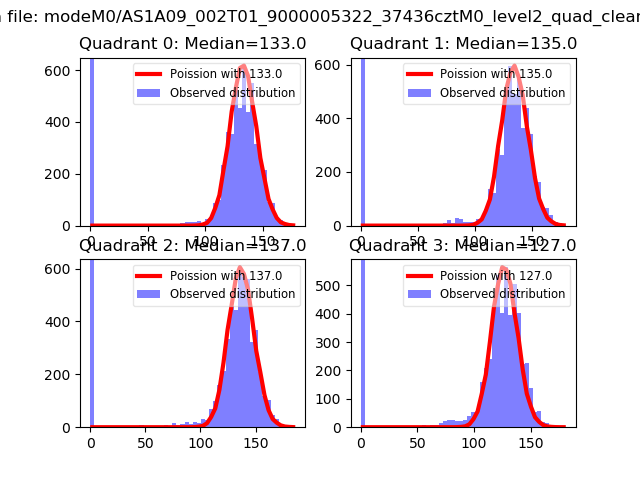 |
 |
| Quadrant-wise count rates Data is divided into 100 sec bins |
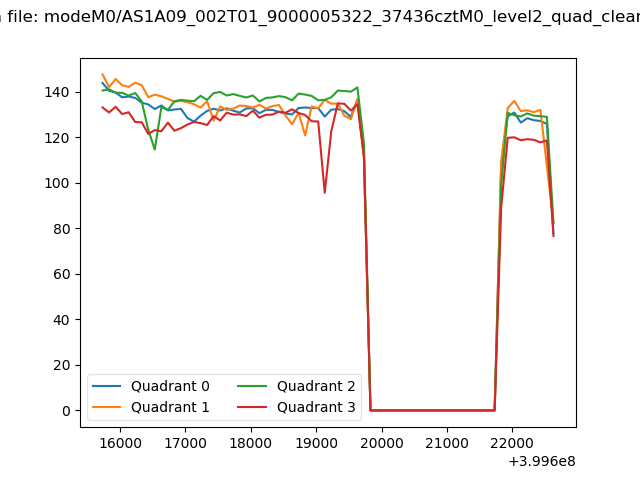 |
|
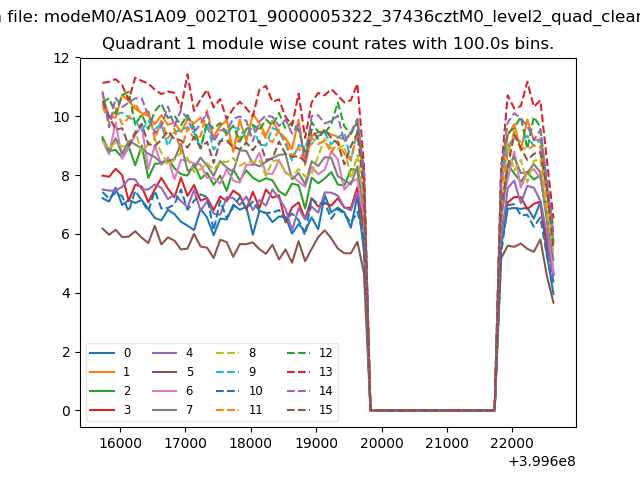
| Module-wise count rates for Quadrant A Data is divided into 100 sec bins |
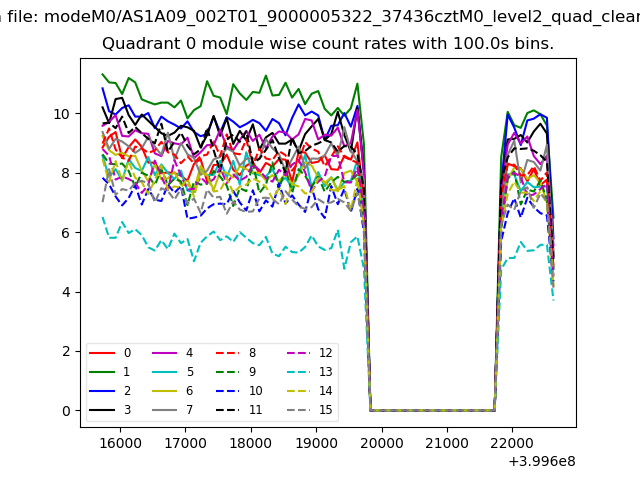 |
 |
| Module-wise count rates for Quadrant B Data is divided into 100 sec bins |
 |
 |
| Module-wise count rates for Quadrant C Data is divided into 100 sec bins |
 |
 |
| Module-wise count rates for Quadrant D Data is divided into 100 sec bins |
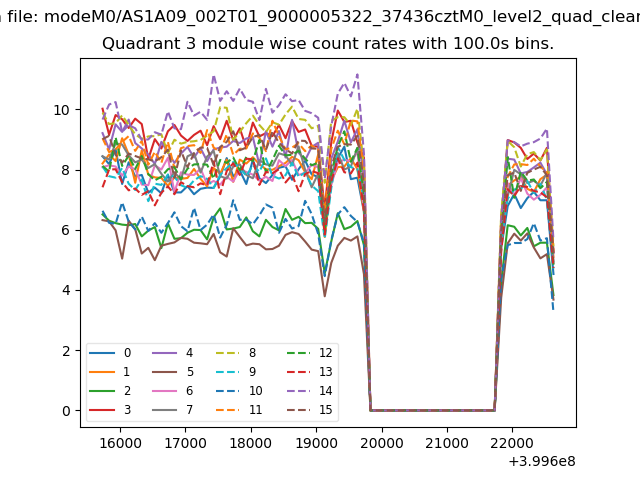 |
 |
| Parameter | Plot |
|---|---|
| CZT HV Monitor | 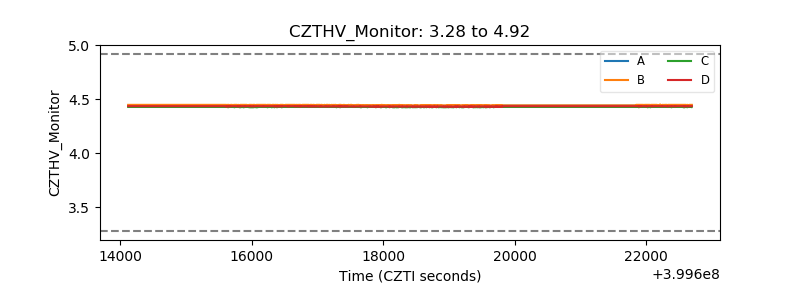 |
| D_VDD | 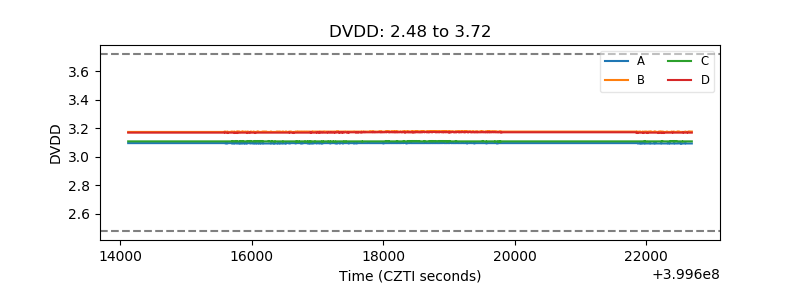 |
| Temperature 1 | 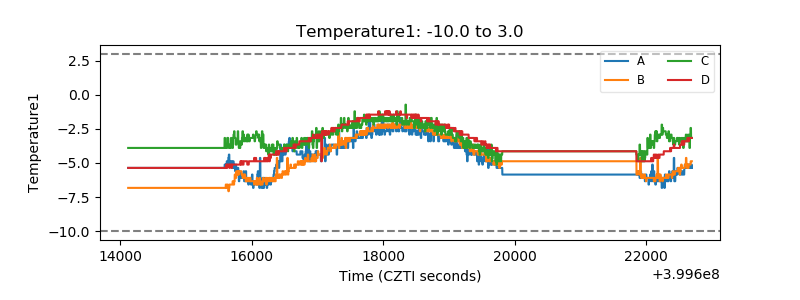 |
| Veto HV Monitor | 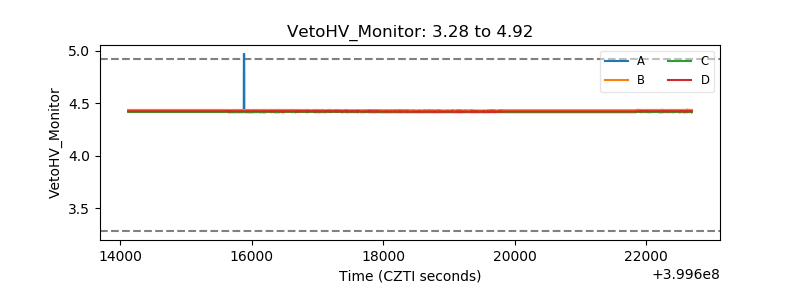 |
| Veto LLD | 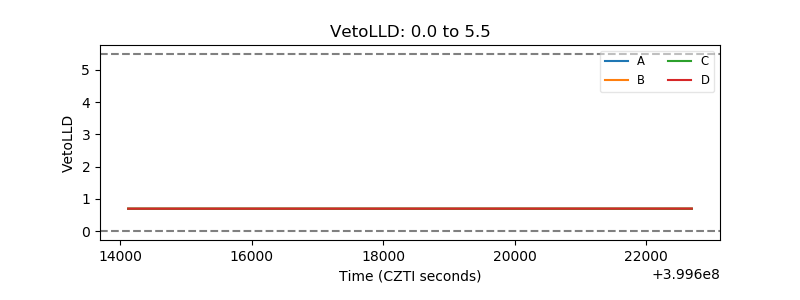 |
| Alpha Counter | 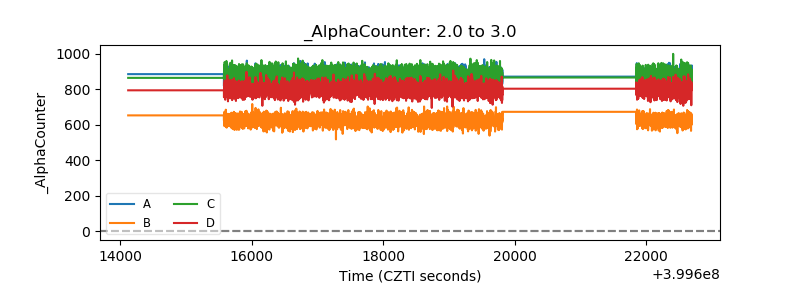 |
| _CPM_Rate | 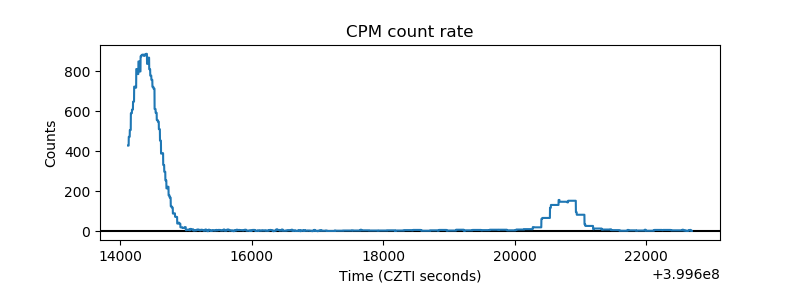 |
| CZT Counter | 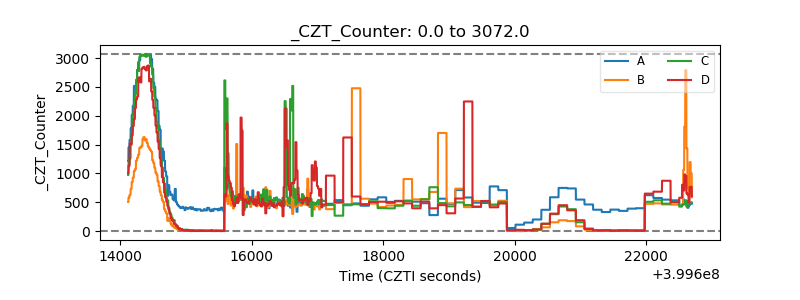 |
| +2.5 Volts monitor | 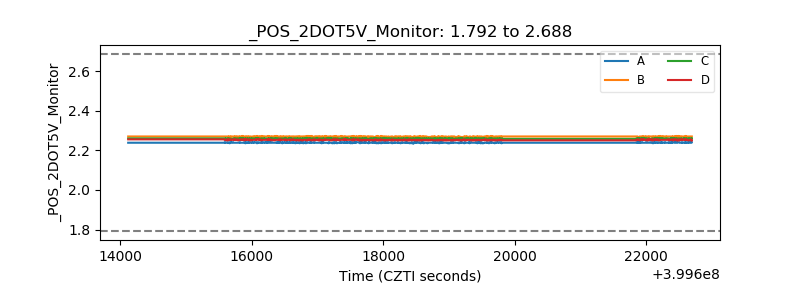 |
| +5 Volts monitor | 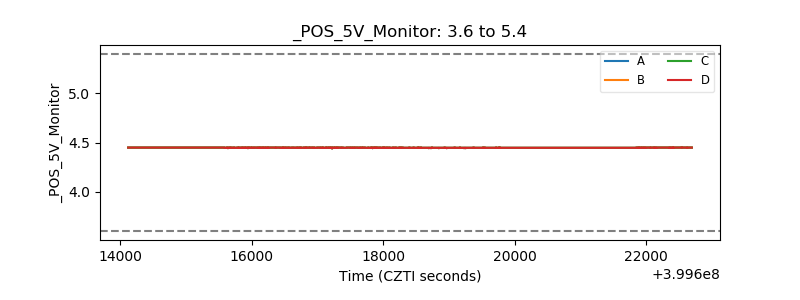 |
| _ROLL_ROT | 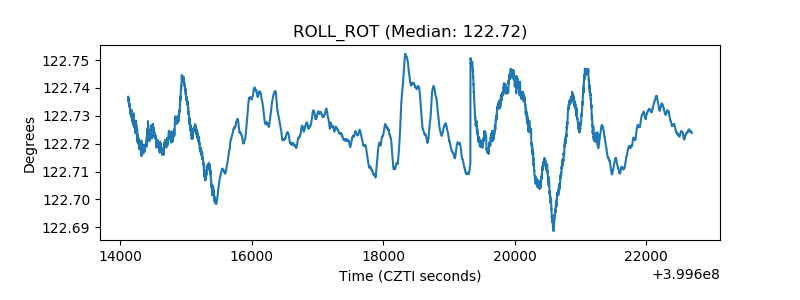 |
| _Roll_DEC | 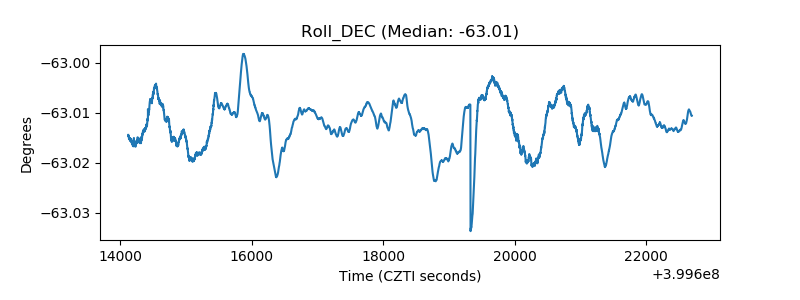 |
| _Roll_RA | 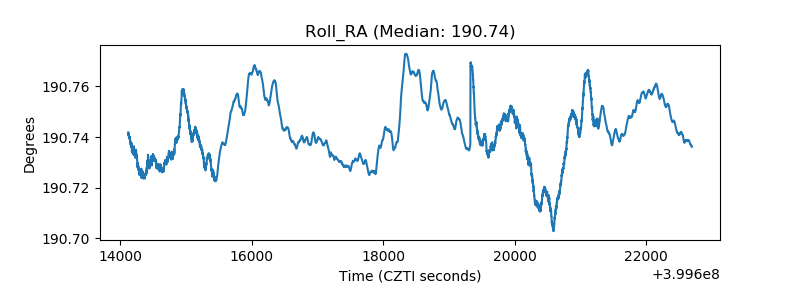 |
| Veto Counter | 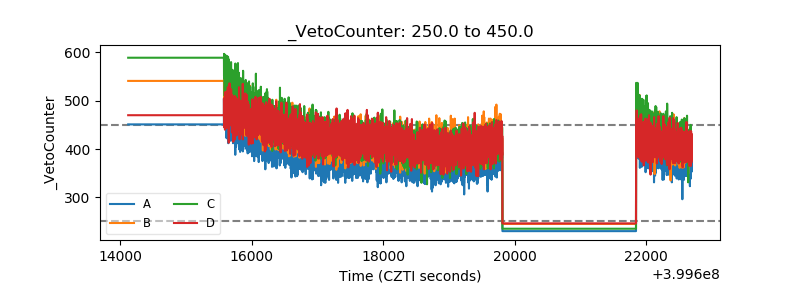 |