| Param | Original file | Final file |
|---|---|---|
| Filename | modeM0/AS1A09_002T01_9000005322_37438cztM0_level2.evt | modeM0/AS1A09_002T01_9000005322_37438cztM0_level2_quad_clean.evt |
| Size (bytes) | 472,870,080 | 90,172,800 |
| Size | 451.0 MB | 86.0 MB |
| Events in quadrant A | 3,441,444 | 577,920 |
| Events in quadrant B | 3,558,843 | 580,104 |
| Events in quadrant C | 3,163,976 | 598,869 |
| Events in quadrant D | 3,756,711 | 561,957 |
| Mode M0 | |||
|---|---|---|---|
| Quadrant | BADHDUFLAG | Total packets | Discarded packets |
| A | 0 | 14198 | 3 |
| B | 0 | 14450 | 2 |
| C | 0 | 12967 | 2 |
| D | 0 | 15083 | 2 |
| Mode M9 | |||
|---|---|---|---|
| Quadrant | BADHDUFLAG | Total packets | Discarded packets |
| A | 0 | 17 | 0 |
| B | 0 | 17 | 0 |
| C | 0 | 17 | 0 |
| D | 0 | 18 | 0 |
| Mode SS | |||
|---|---|---|---|
| Quadrant | BADHDUFLAG | Total packets | Discarded packets |
| A | 0 | 122 | 0 |
| B | 0 | 122 | 0 |
| C | 0 | 122 | 0 |
| D | 0 | 122 | 0 |
| Quadrant | Total seconds | Saturated seconds | Saturation percentage |
|---|---|---|---|
| A | 5884 | 28 | 0.475867% |
| B | 5884 | 204 | 3.467029% |
| C | 5884 | 74 | 1.257648% |
| D | 5884 | 232 | 3.942896% |
Noise dominated data is calculated using 1-second bins in cleaned event files. If a bin has >2000 counts, and if more than 50% of those come from <1% of pixels, then it is considered to be noise-dominated and hence unusable.
| Quadrant | # 1 sec bins | Bins with >0 counts | Bins with >2000 counts | High rate bins dominated by noise | Noise dominated (total time) | Noise dominated (detector-on time) | Marked lightcurve |
|---|---|---|---|---|---|---|---|
| A | 7318 | 5885 | 14 | 14 | 0.19% | 0.24% | 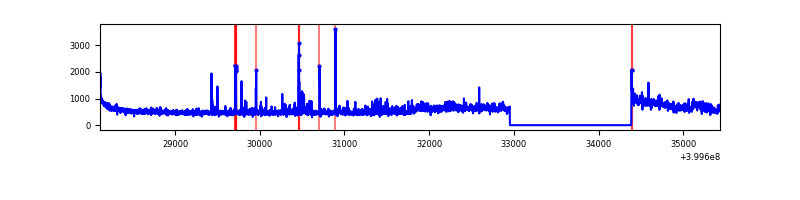 |
| B | 7318 | 5885 | 132 | 132 | 1.80% | 2.24% | 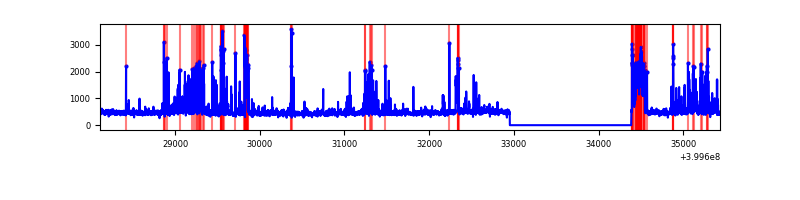 |
| C | 7318 | 5885 | 54 | 54 | 0.74% | 0.92% | 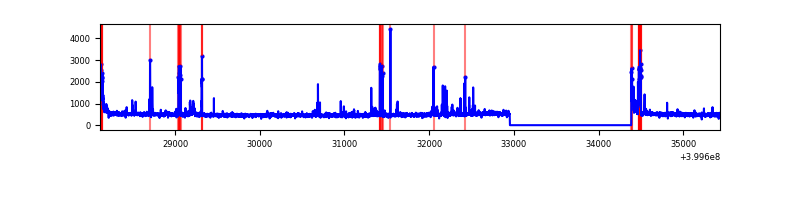 |
| D | 7318 | 5885 | 233 | 233 | 3.18% | 3.96% | 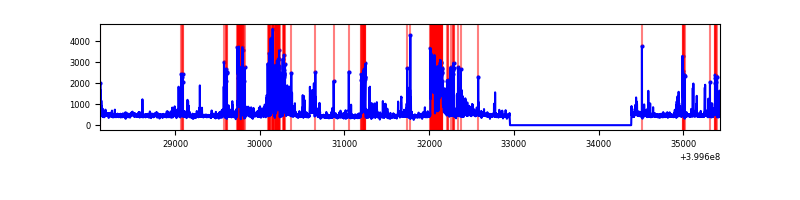 |
Top three noisy pixels from each quadrant. If the there are fewer than three noisy pixels in the level2.evt file, extra rows are filled as -1
| Pixel properties | Quadrant properties | ||||||
|---|---|---|---|---|---|---|---|
| Quadrant | DetID | PixID | Counts | Sigma | Mean | Median | Sigma |
| A | 15 | 222 | 434516 | 3249.58 | 660 | 646 | 133.5 |
| A | 10 | 83 | 298945 | 2234.19 | 660 | 646 | 133.5 |
| A | 9 | 143 | 77880 | 578.46 | 660 | 646 | 133.5 |
| B | 4 | 171 | 423910 | 3410.66 | 650 | 633 | 124.1 |
| B | 5 | 184 | 277192 | 2228.44 | 650 | 633 | 124.1 |
| B | 15 | 35 | 62714 | 500.23 | 650 | 633 | 124.1 |
| C | 15 | 214 | 266970 | 1778.48 | 646 | 651 | 149.7 |
| C | 14 | 254 | 181459 | 1207.44 | 646 | 651 | 149.7 |
| C | 0 | 10 | 104028 | 690.35 | 646 | 651 | 149.7 |
| D | 13 | 249 | 466865 | 3010.99 | 639 | 623 | 154.8 |
| D | 12 | 233 | 266423 | 1716.53 | 639 | 623 | 154.8 |
| D | 2 | 249 | 162779 | 1047.2 | 639 | 623 | 154.8 |
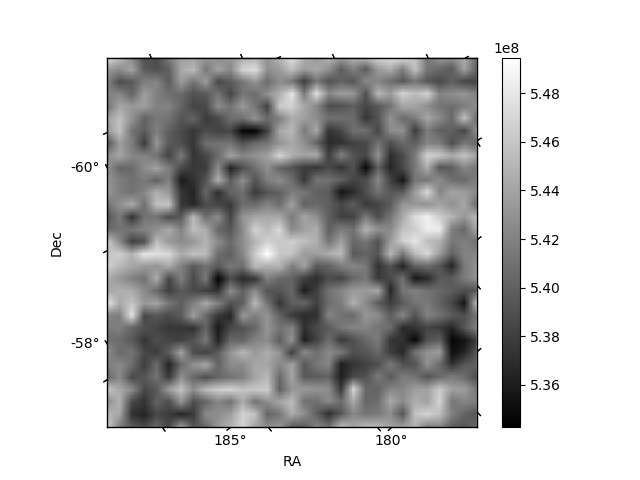
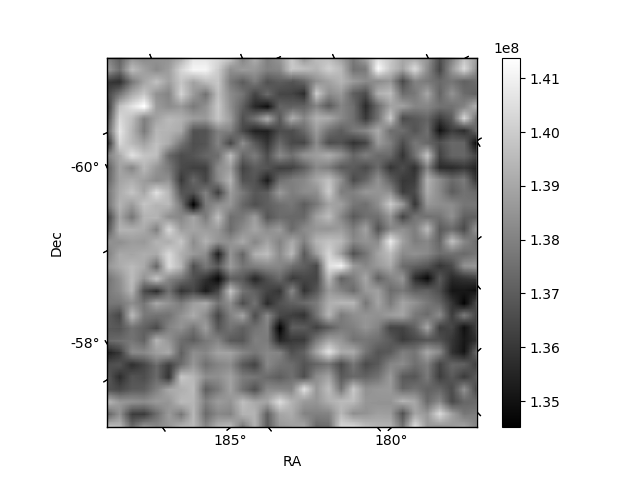
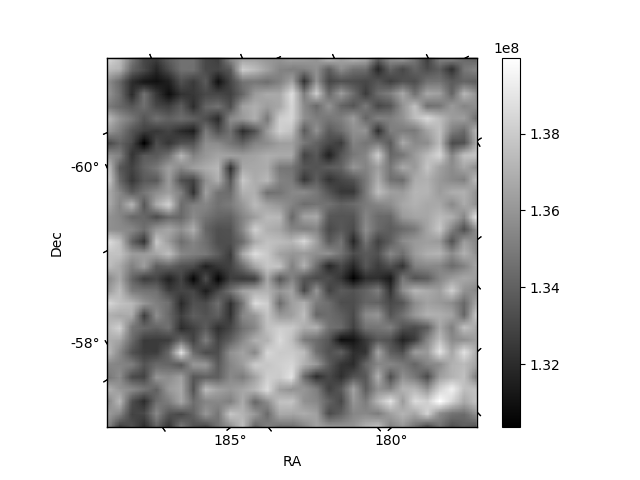
Histogram calculated using DETX and DETY for each event in the final _common_clean file
| Quadrant A | 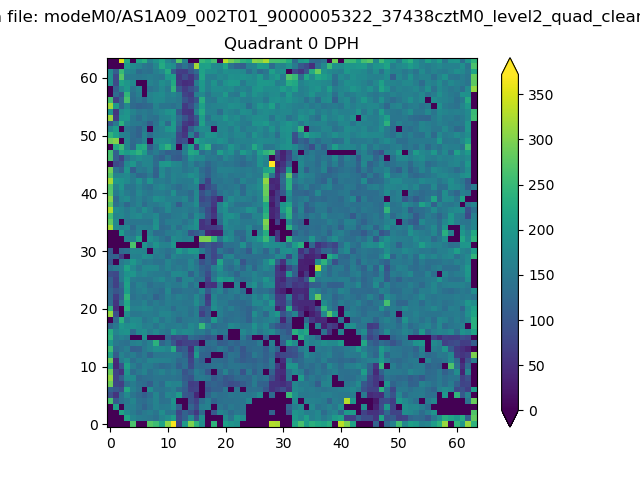 |
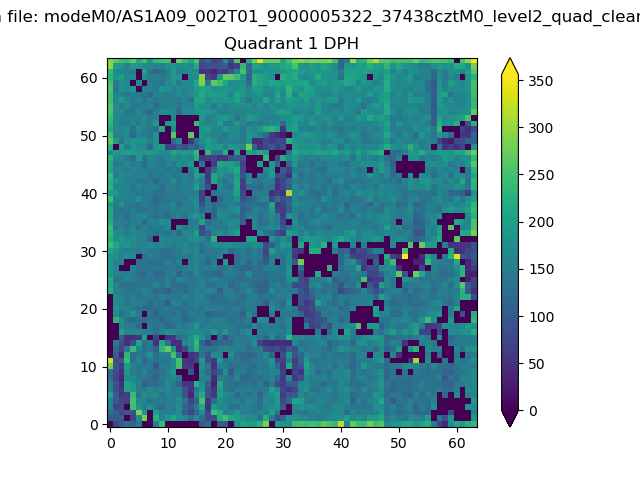 |
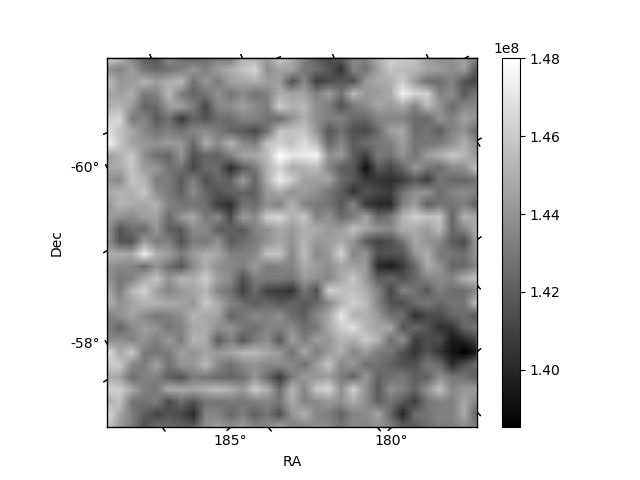
Quadrant B |
|---|---|---|---|
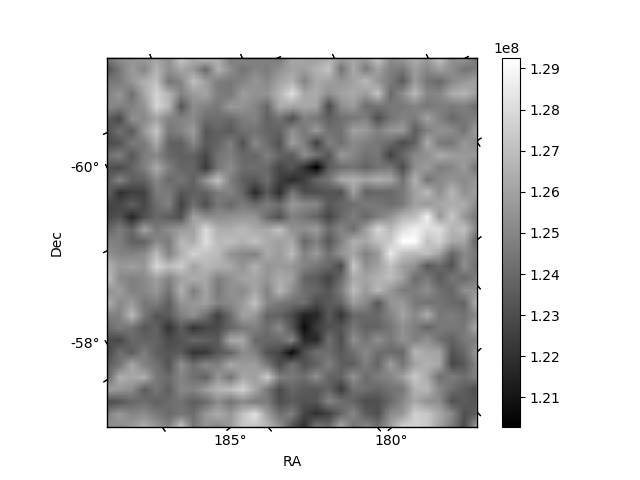
| Quadrant D | 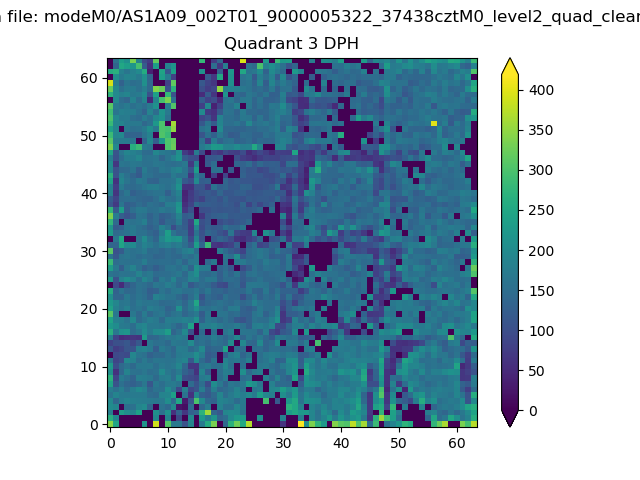 |
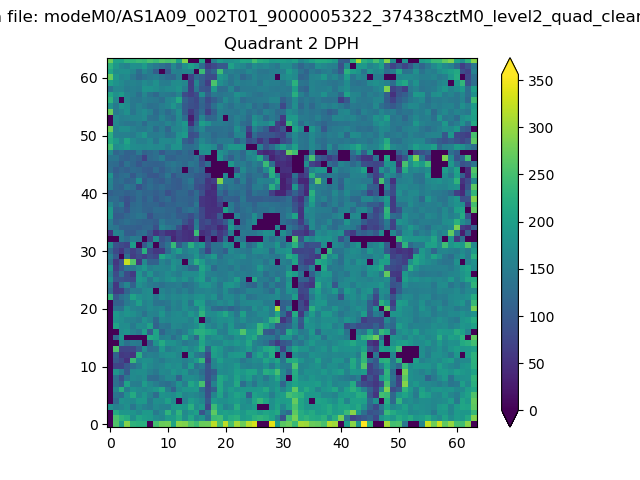 |
Quadrant C |
| Plot type | Count rate plots | Images |
|---|---|---|
| Comparison with Poisson distribution Blue bars denote a histogram of data divided into 1 sec bins. Red curve is a Poisson curve with rate = median count rate of data. |
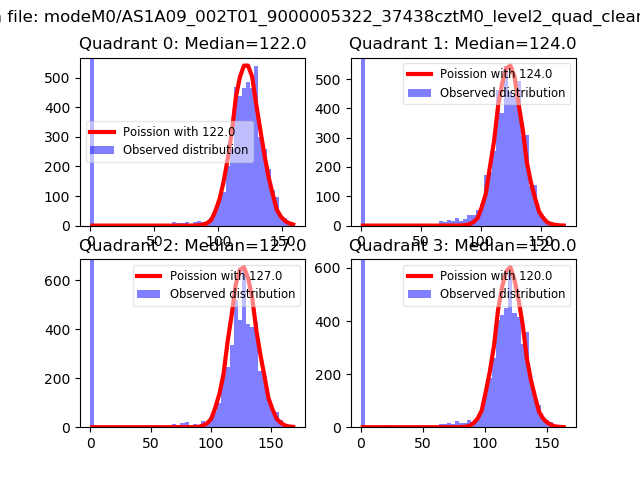 |
 |
| Quadrant-wise count rates Data is divided into 100 sec bins |
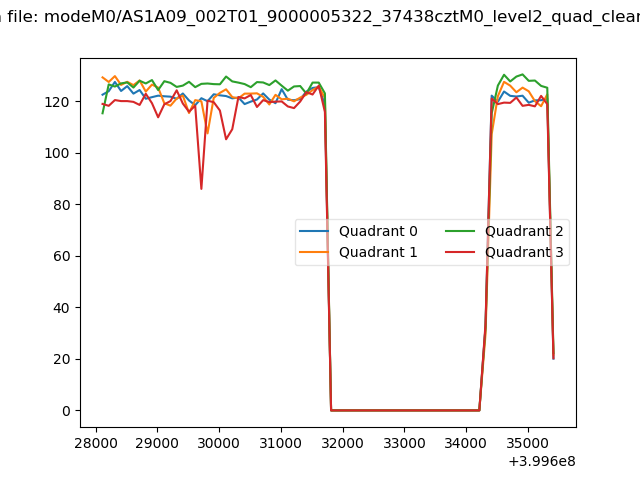 |
|
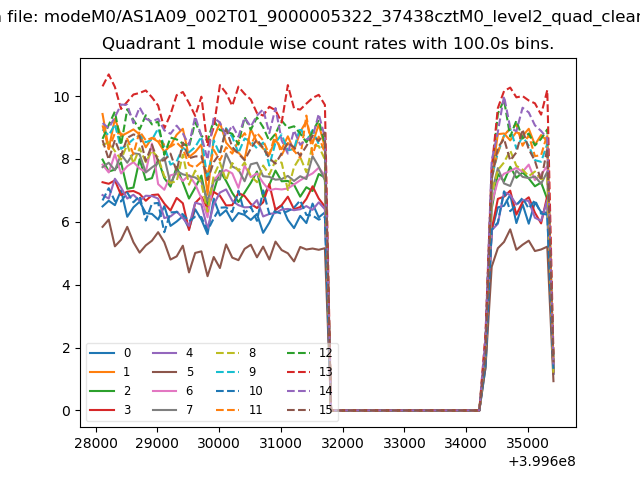
| Module-wise count rates for Quadrant A Data is divided into 100 sec bins |
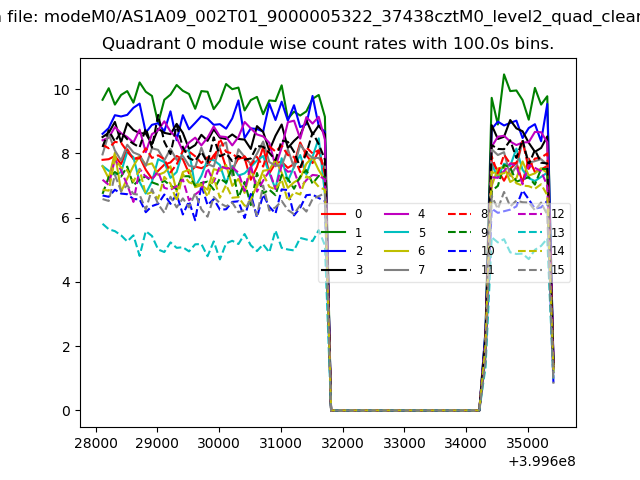 |
 |
| Module-wise count rates for Quadrant B Data is divided into 100 sec bins |
 |
 |
| Module-wise count rates for Quadrant C Data is divided into 100 sec bins |
 |
 |
| Module-wise count rates for Quadrant D Data is divided into 100 sec bins |
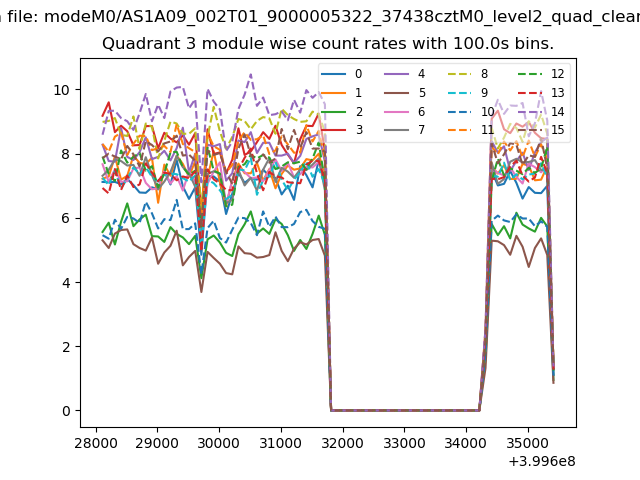 |
 |
| Parameter | Plot |
|---|---|
| CZT HV Monitor | 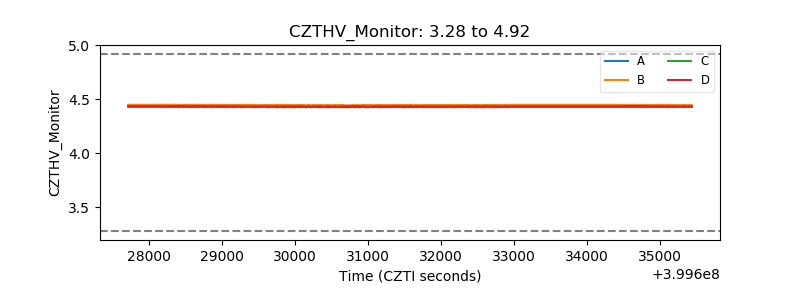 |
| D_VDD | 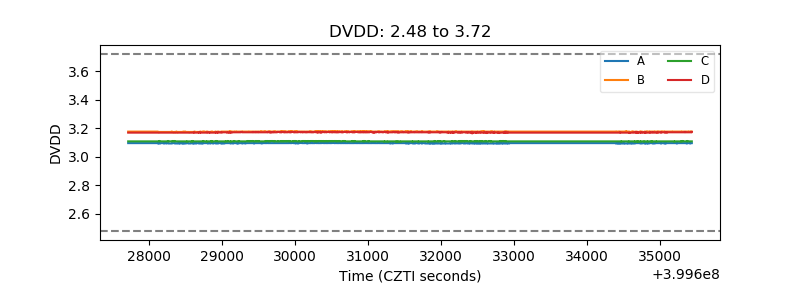 |
| Temperature 1 | 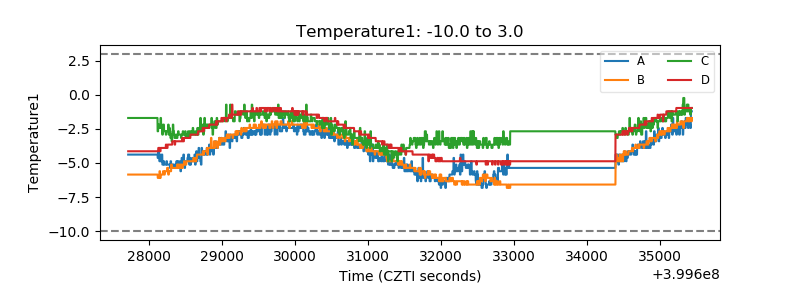 |
| Veto HV Monitor | 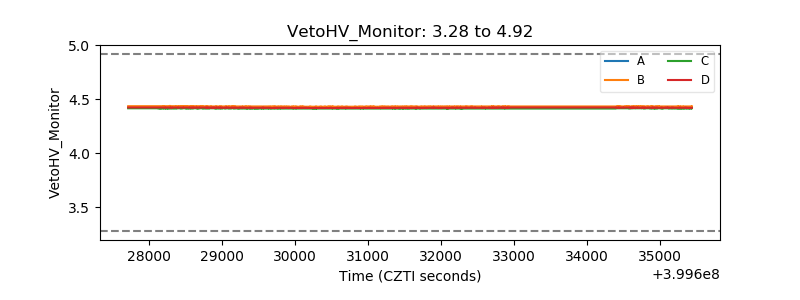 |
| Veto LLD | 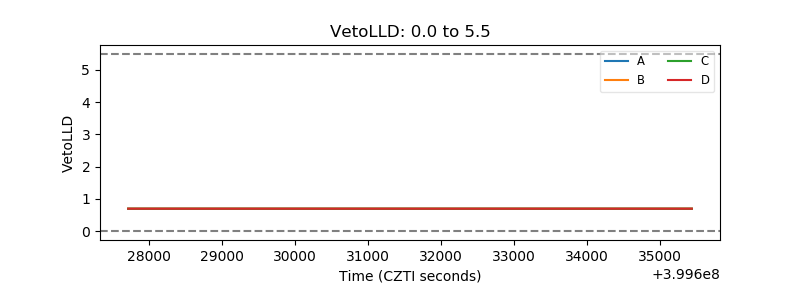 |
| Alpha Counter | 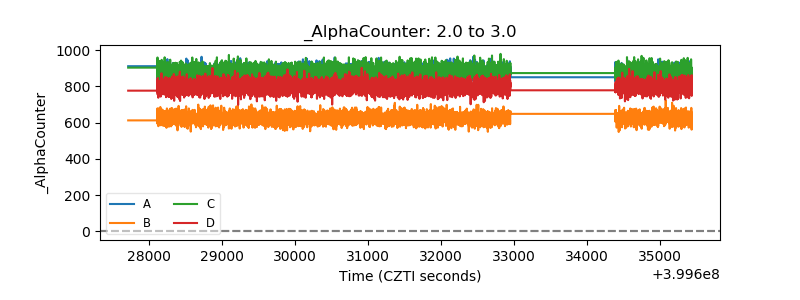 |
| _CPM_Rate | 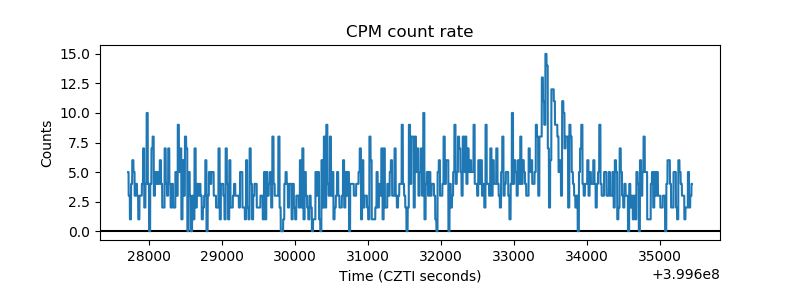 |
| CZT Counter | 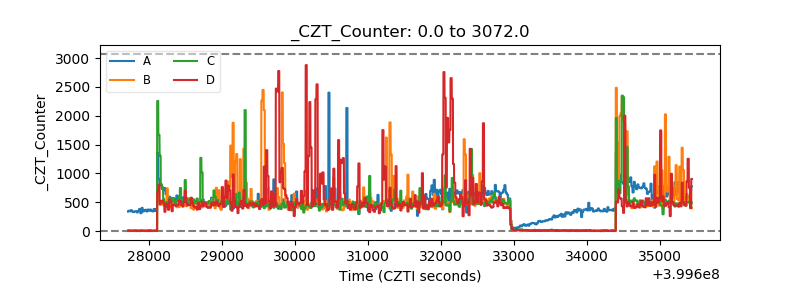 |
| +2.5 Volts monitor | 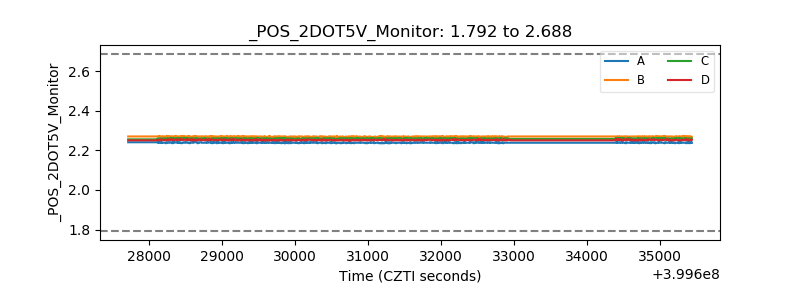 |
| +5 Volts monitor | 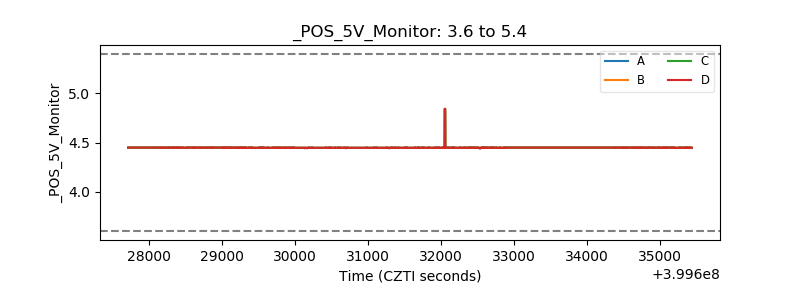 |
| _ROLL_ROT | 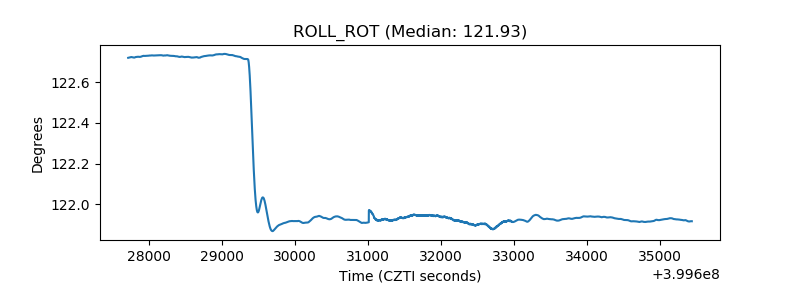 |
| _Roll_DEC | 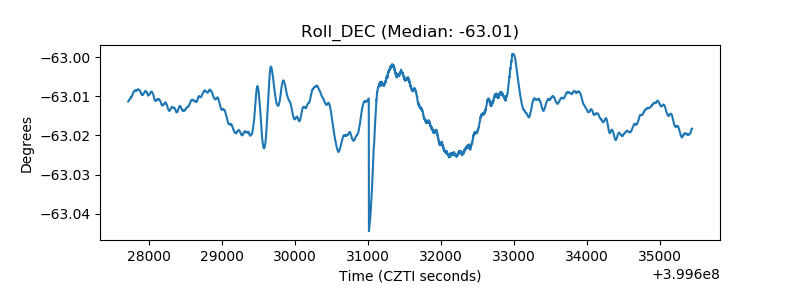 |
| _Roll_RA | 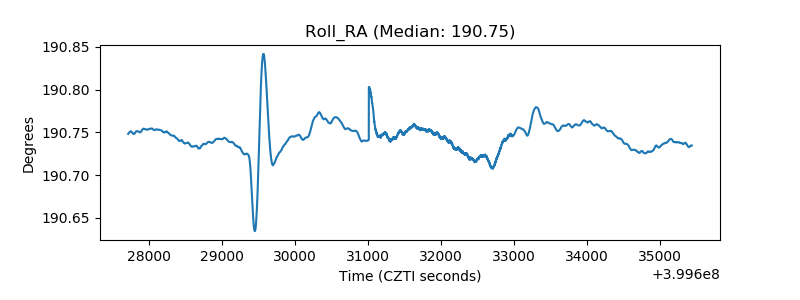 |
| Veto Counter | 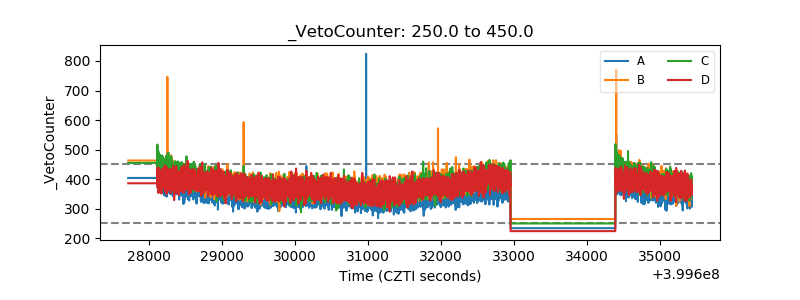 |