| Param | Original file | Final file |
|---|---|---|
| Filename | modeM0/AS1A09_002T01_9000005322_37439cztM0_level2.evt | modeM0/AS1A09_002T01_9000005322_37439cztM0_level2_quad_clean.evt |
| Size (bytes) | 456,091,200 | 84,191,040 |
| Size | 435.0 MB | 80.3 MB |
| Events in quadrant A | 3,497,084 | 530,050 |
| Events in quadrant B | 3,415,577 | 532,781 |
| Events in quadrant C | 3,142,512 | 549,831 |
| Events in quadrant D | 3,359,467 | 527,037 |
| Mode M0 | |||
|---|---|---|---|
| Quadrant | BADHDUFLAG | Total packets | Discarded packets |
| A | 0 | 14017 | 2 |
| B | 0 | 14023 | 1 |
| C | 0 | 12988 | 1 |
| D | 0 | 13955 | 1 |
| Mode M9 | |||
|---|---|---|---|
| Quadrant | BADHDUFLAG | Total packets | Discarded packets |
| A | 0 | 13 | 0 |
| B | 0 | 13 | 0 |
| C | 0 | 13 | 0 |
| D | 0 | 13 | 0 |
| Mode SS | |||
|---|---|---|---|
| Quadrant | BADHDUFLAG | Total packets | Discarded packets |
| A | 0 | 120 | 0 |
| B | 0 | 120 | 0 |
| C | 0 | 120 | 0 |
| D | 0 | 120 | 0 |
| Quadrant | Total seconds | Saturated seconds | Saturation percentage |
|---|---|---|---|
| A | 5863 | 43 | 0.733413% |
| B | 5863 | 123 | 2.097902% |
| C | 5863 | 83 | 1.415658% |
| D | 5863 | 96 | 1.637387% |
Noise dominated data is calculated using 1-second bins in cleaned event files. If a bin has >2000 counts, and if more than 50% of those come from <1% of pixels, then it is considered to be noise-dominated and hence unusable.
| Quadrant | # 1 sec bins | Bins with >0 counts | Bins with >2000 counts | High rate bins dominated by noise | Noise dominated (total time) | Noise dominated (detector-on time) | Marked lightcurve |
|---|---|---|---|---|---|---|---|
| A | 7175 | 5864 | 33 | 33 | 0.46% | 0.56% | 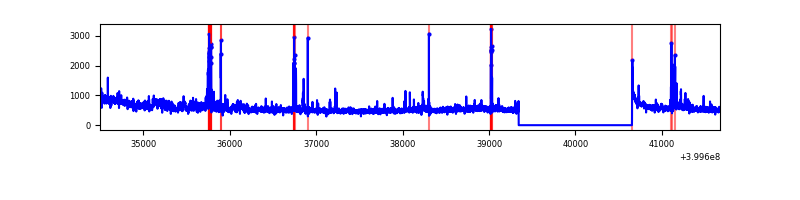 |
| B | 7175 | 5864 | 82 | 82 | 1.14% | 1.40% | 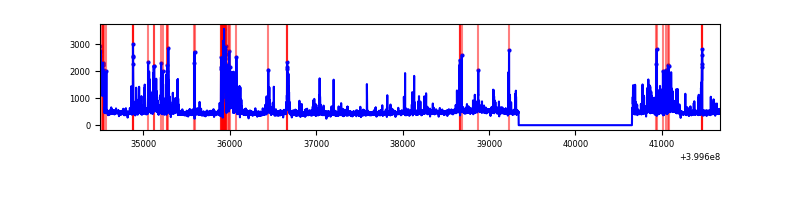 |
| C | 7175 | 5864 | 61 | 61 | 0.85% | 1.04% | 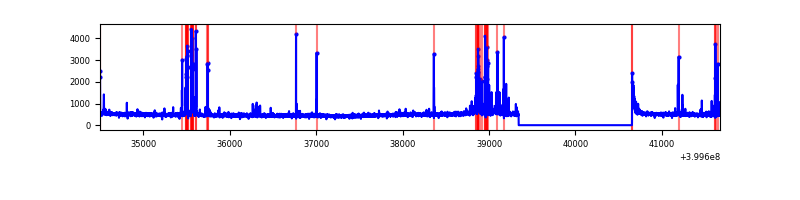 |
| D | 7175 | 5864 | 101 | 101 | 1.41% | 1.72% | 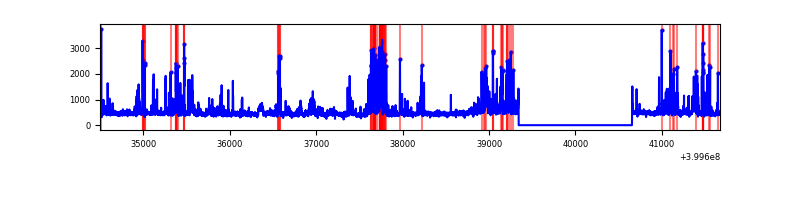 |
Top three noisy pixels from each quadrant. If the there are fewer than three noisy pixels in the level2.evt file, extra rows are filled as -1
| Pixel properties | Quadrant properties | ||||||
|---|---|---|---|---|---|---|---|
| Quadrant | DetID | PixID | Counts | Sigma | Mean | Median | Sigma |
| A | 15 | 222 | 451967 | 3395.04 | 655 | 642 | 132.9 |
| A | 10 | 83 | 266343 | 1998.71 | 655 | 642 | 132.9 |
| A | 7 | 3 | 89044 | 664.99 | 655 | 642 | 132.9 |
| B | 4 | 171 | 352868 | 2859.2 | 647 | 630 | 123.2 |
| B | 5 | 200 | 128895 | 1041.16 | 647 | 630 | 123.2 |
| B | 4 | 232 | 106632 | 860.44 | 647 | 630 | 123.2 |
| C | 15 | 214 | 263549 | 1759.35 | 640 | 646 | 149.4 |
| C | 14 | 254 | 241621 | 1612.61 | 640 | 646 | 149.4 |
| C | 15 | 208 | 75049 | 497.91 | 640 | 646 | 149.4 |
| D | 2 | 249 | 333564 | 2127.52 | 642 | 624 | 156.5 |
| D | 13 | 249 | 164937 | 1049.98 | 642 | 624 | 156.5 |
| D | 2 | 153 | 95105 | 603.74 | 642 | 624 | 156.5 |
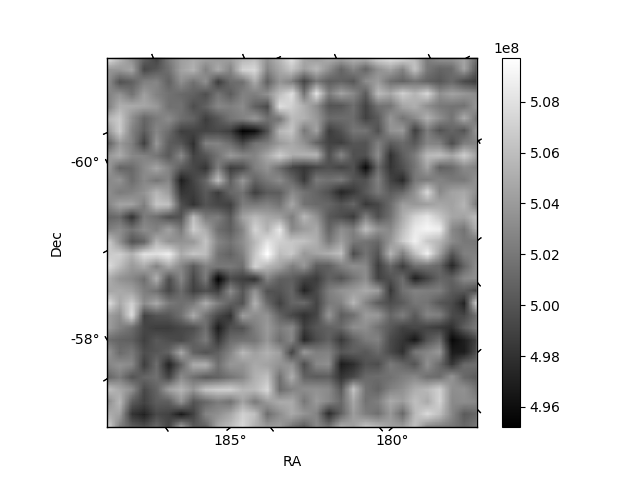
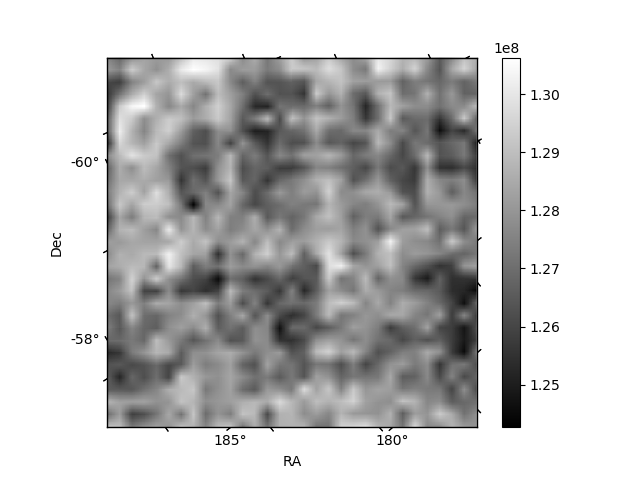
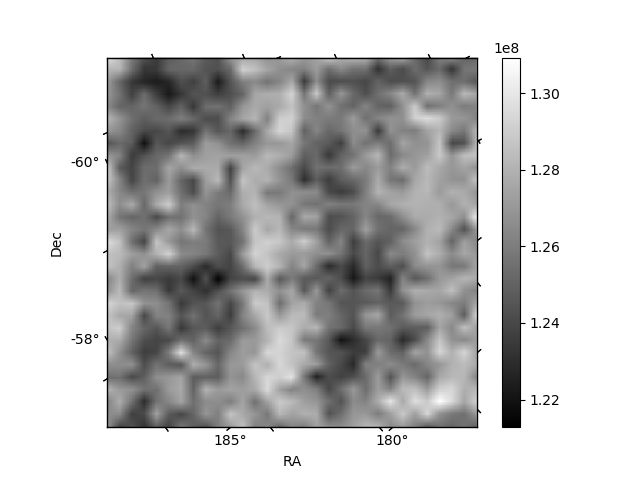
Histogram calculated using DETX and DETY for each event in the final _common_clean file
| Quadrant A | 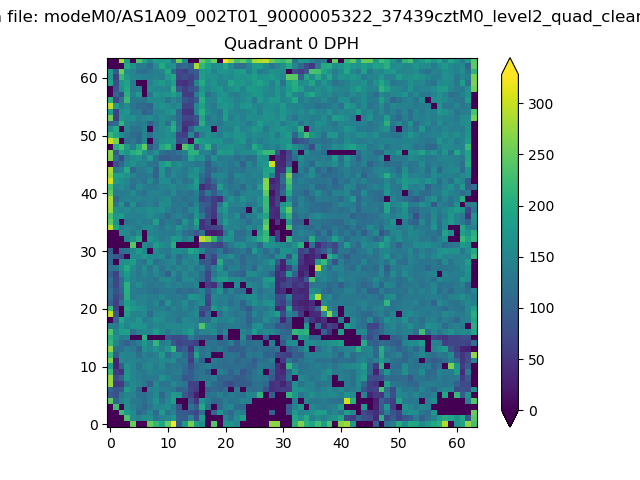 |
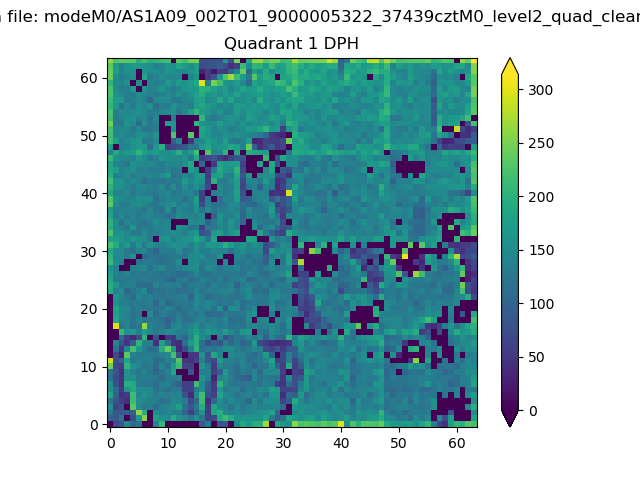 |
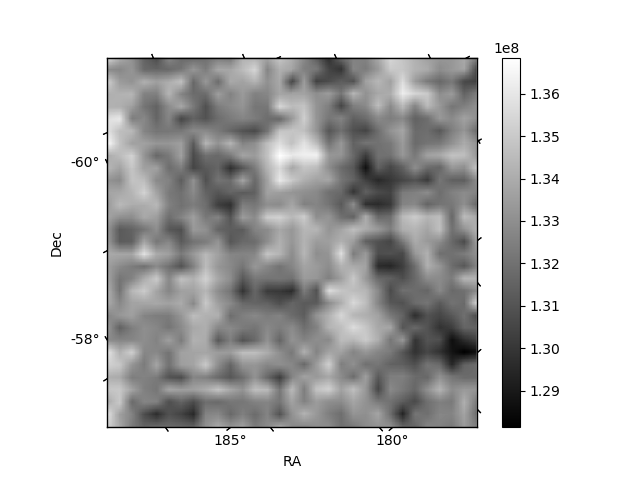
Quadrant B |
|---|---|---|---|
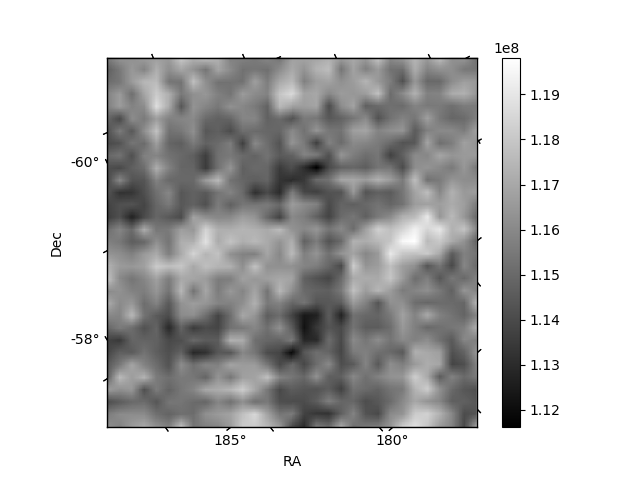
| Quadrant D | 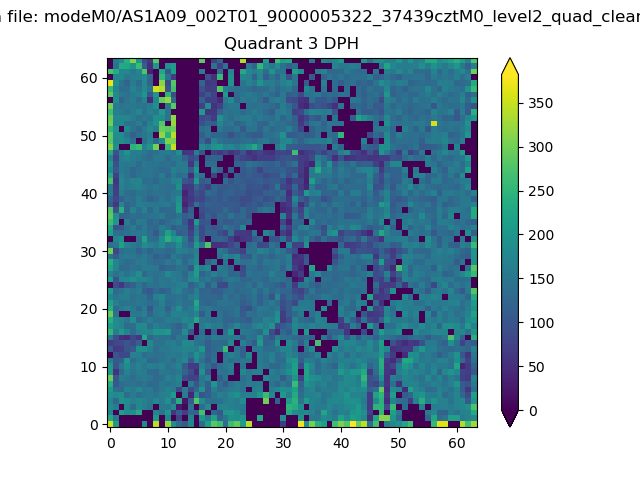 |
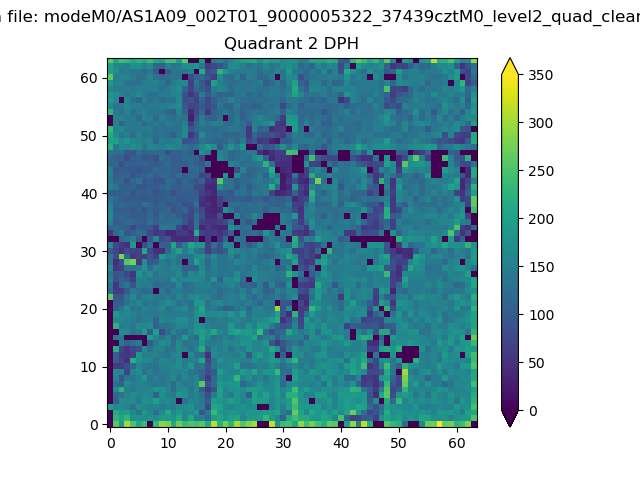 |
Quadrant C |
| Plot type | Count rate plots | Images |
|---|---|---|
| Comparison with Poisson distribution Blue bars denote a histogram of data divided into 1 sec bins. Red curve is a Poisson curve with rate = median count rate of data. |
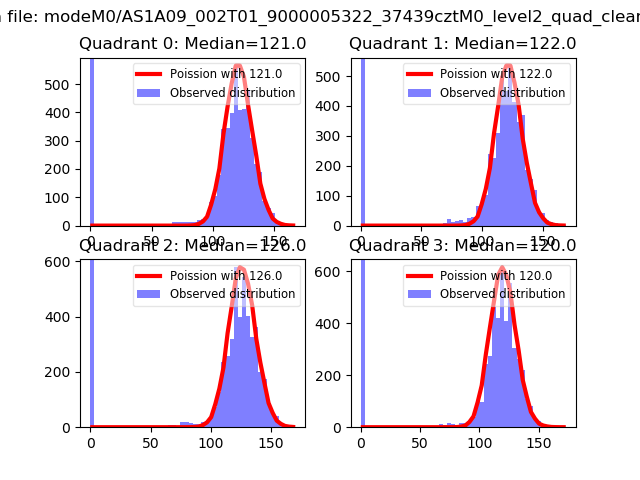 |
 |
| Quadrant-wise count rates Data is divided into 100 sec bins |
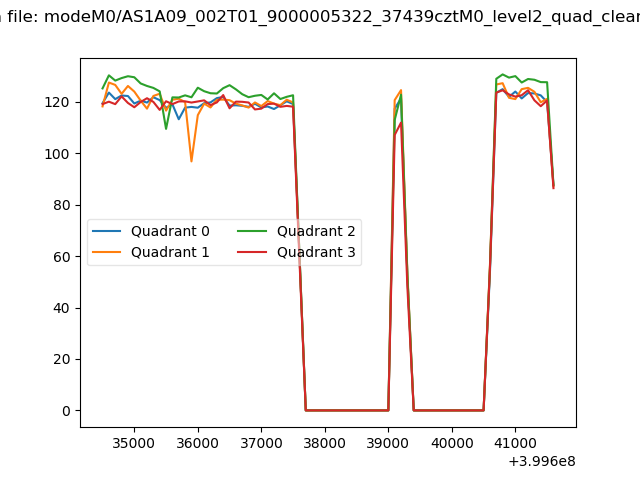 |
|
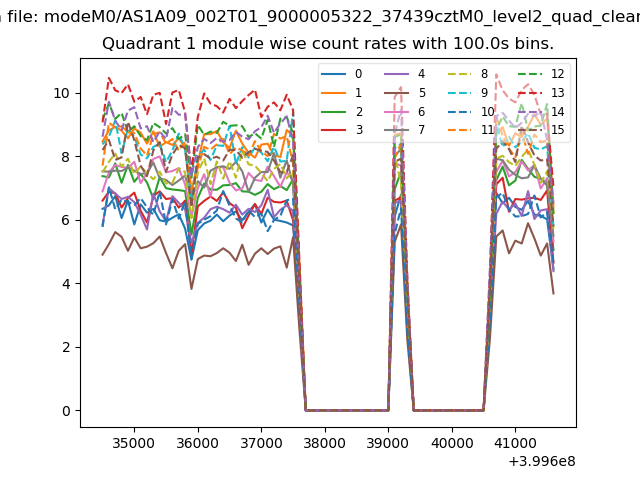
| Module-wise count rates for Quadrant A Data is divided into 100 sec bins |
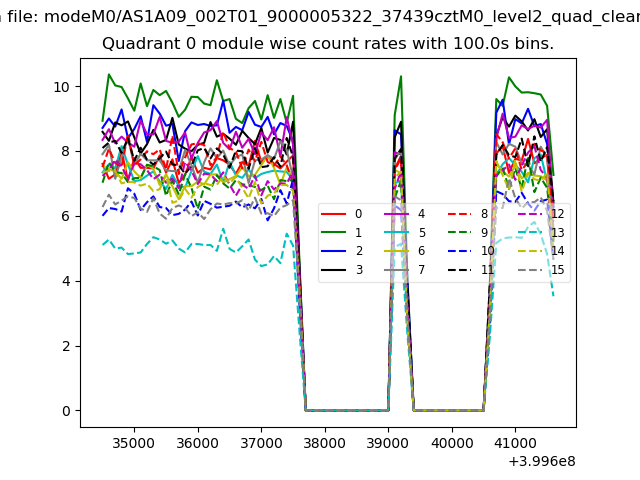 |
 |
| Module-wise count rates for Quadrant B Data is divided into 100 sec bins |
 |
 |
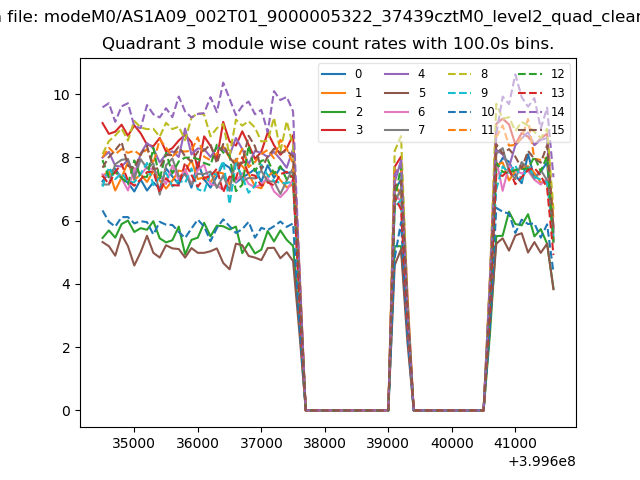
| Module-wise count rates for Quadrant C Data is divided into 100 sec bins |
 |
 |
| Module-wise count rates for Quadrant D Data is divided into 100 sec bins |
 |
 |
| Parameter | Plot |
|---|---|
| CZT HV Monitor | 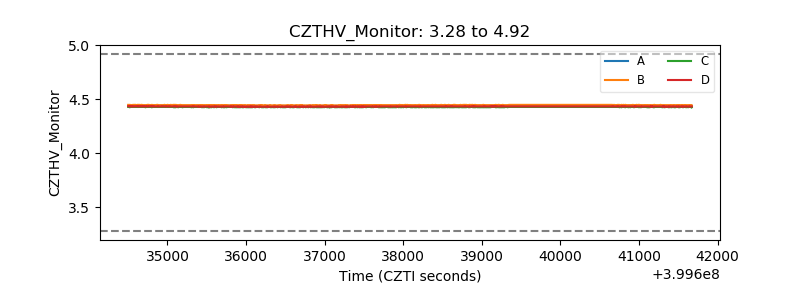 |
| D_VDD | 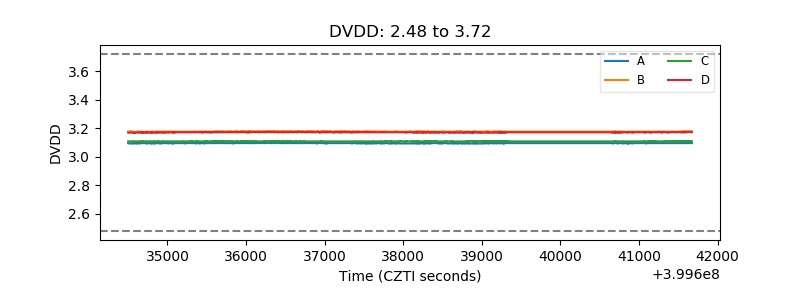 |
| Temperature 1 | 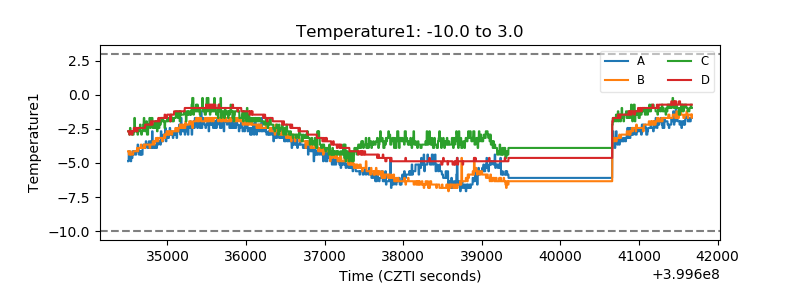 |
| Veto HV Monitor | 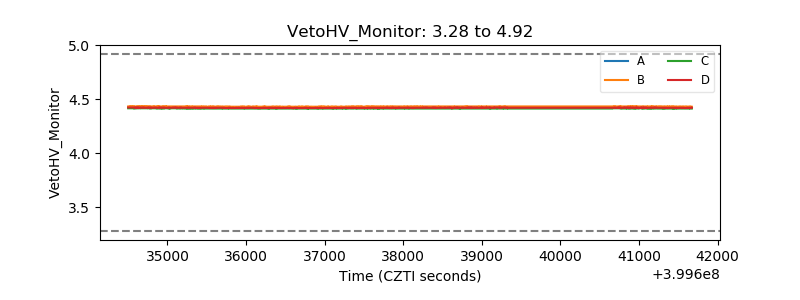 |
| Veto LLD | 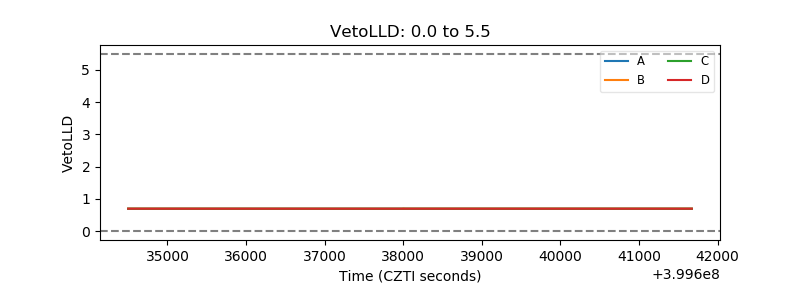 |
| Alpha Counter | 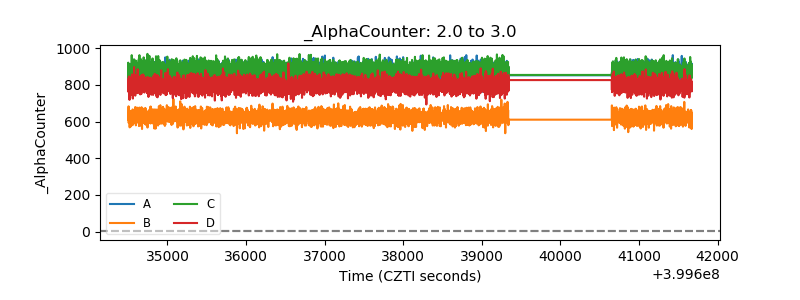 |
| _CPM_Rate | 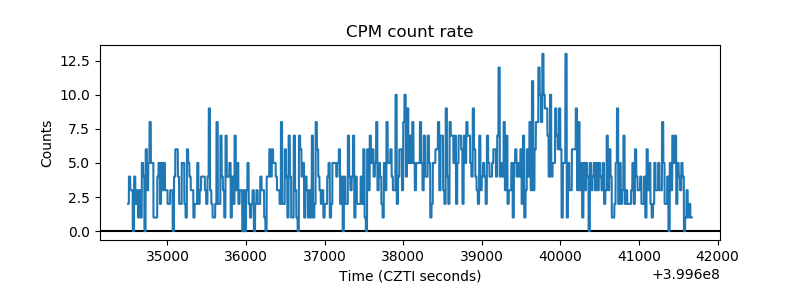 |
| CZT Counter | 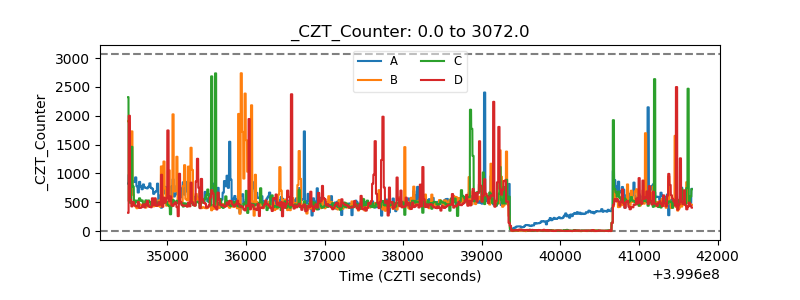 |
| +2.5 Volts monitor | 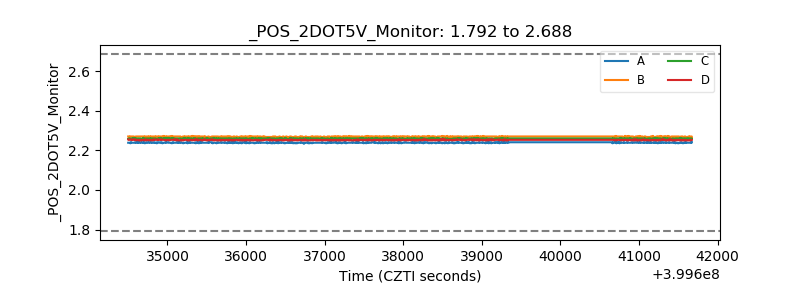 |
| +5 Volts monitor | 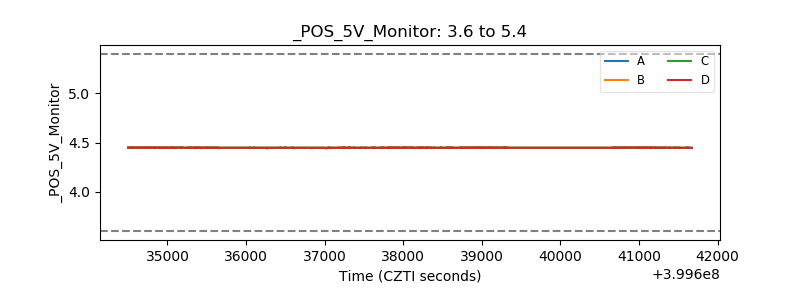 |
| _ROLL_ROT | 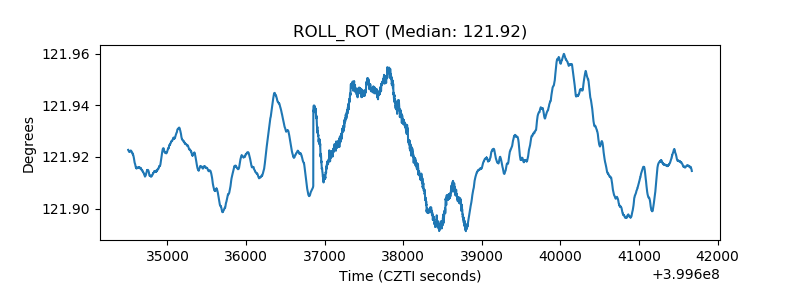 |
| _Roll_DEC | 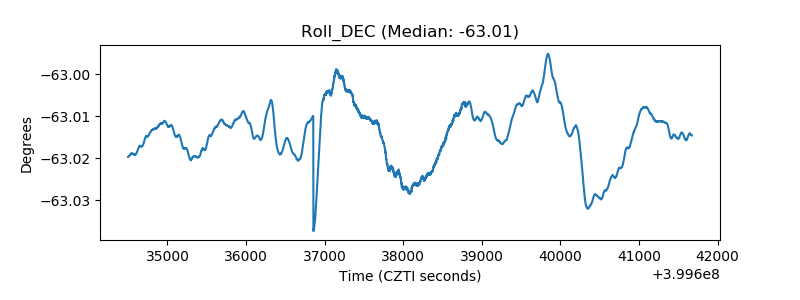 |
| _Roll_RA | 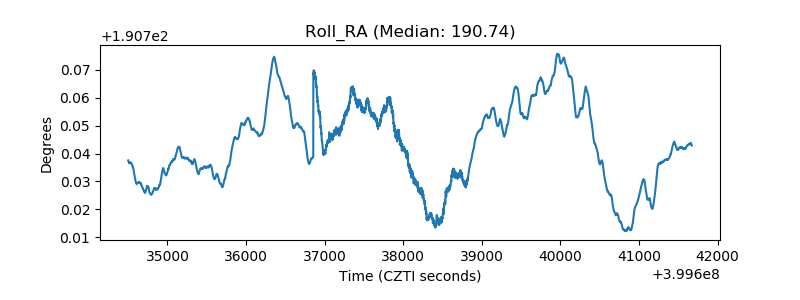 |
| Veto Counter | 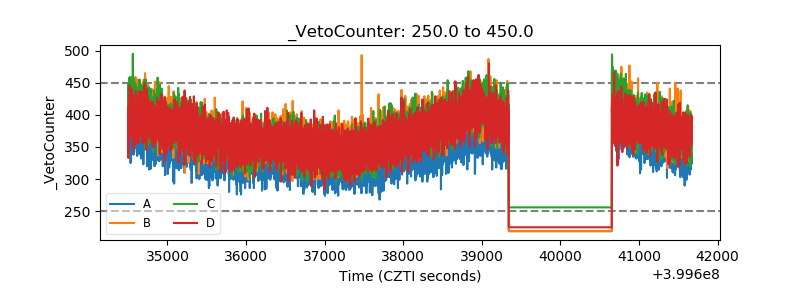 |