| Param | Original file | Final file |
|---|---|---|
| Filename | modeM0/AS1A09_002T01_9000005322_37442cztM0_level2.evt | modeM0/AS1A09_002T01_9000005322_37442cztM0_level2_quad_clean.evt |
| Size (bytes) | 1,330,027,200 | 211,674,240 |
| Size | 1.2 GB | 201.9 MB |
| Events in quadrant A | 10,646,363 | 1,303,104 |
| Events in quadrant B | 9,120,670 | 1,347,024 |
| Events in quadrant C | 9,081,522 | 1,372,053 |
| Events in quadrant D | 10,385,433 | 1,318,762 |
| Mode M0 | |||
|---|---|---|---|
| Quadrant | BADHDUFLAG | Total packets | Discarded packets |
| A | 0 | 41331 | 5 |
| B | 0 | 37411 | 4 |
| C | 0 | 36747 | 4 |
| D | 0 | 41435 | 4 |
| Mode M9 | |||
|---|---|---|---|
| Quadrant | BADHDUFLAG | Total packets | Discarded packets |
| A | 0 | 45 | 0 |
| B | 0 | 45 | 0 |
| C | 0 | 45 | 0 |
| D | 0 | 46 | 0 |
| Mode SS | |||
|---|---|---|---|
| Quadrant | BADHDUFLAG | Total packets | Discarded packets |
| A | 0 | 314 | 0 |
| B | 0 | 314 | 0 |
| C | 0 | 314 | 0 |
| D | 0 | 314 | 0 |
| Quadrant | Total seconds | Saturated seconds | Saturation percentage |
|---|---|---|---|
| A | 15508 | 1035 | 6.673975% |
| B | 15508 | 431 | 2.779211% |
| C | 15508 | 376 | 2.424555% |
| D | 15508 | 1025 | 6.609492% |
Noise dominated data is calculated using 1-second bins in cleaned event files. If a bin has >2000 counts, and if more than 50% of those come from <1% of pixels, then it is considered to be noise-dominated and hence unusable.
| Quadrant | # 1 sec bins | Bins with >0 counts | Bins with >2000 counts | High rate bins dominated by noise | Noise dominated (total time) | Noise dominated (detector-on time) | Marked lightcurve |
|---|---|---|---|---|---|---|---|
| A | 19715 | 15511 | 940 | 940 | 4.77% | 6.06% | 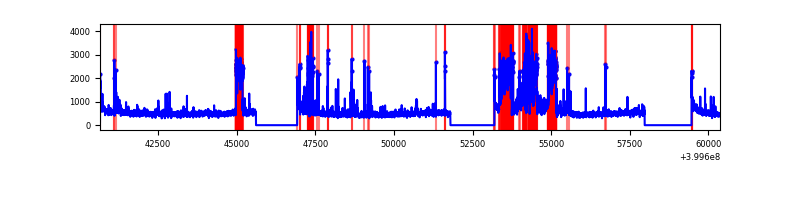 |
| B | 19714 | 15510 | 300 | 300 | 1.52% | 1.93% | 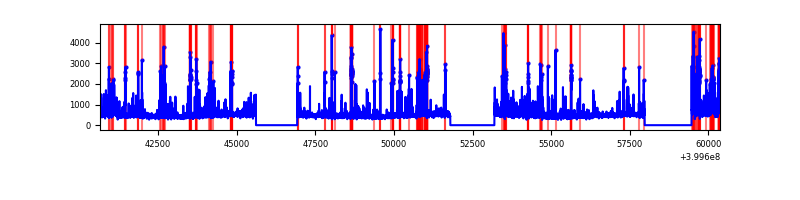 |
| C | 19715 | 15511 | 352 | 352 | 1.79% | 2.27% | 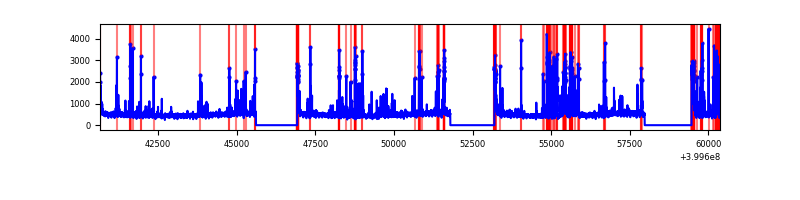 |
| D | 19715 | 15511 | 749 | 749 | 3.80% | 4.83% | 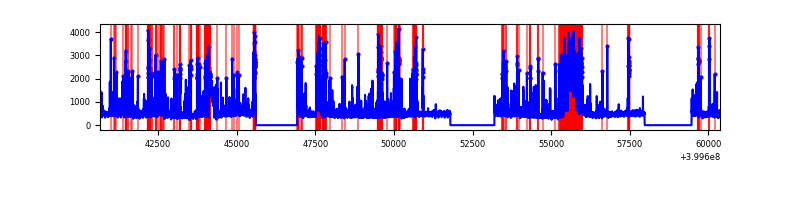 |
Top three noisy pixels from each quadrant. If the there are fewer than three noisy pixels in the level2.evt file, extra rows are filled as -1
| Pixel properties | Quadrant properties | ||||||
|---|---|---|---|---|---|---|---|
| Quadrant | DetID | PixID | Counts | Sigma | Mean | Median | Sigma |
| A | 15 | 222 | 2859327 | 8423.68 | 1691 | 1655 | 339.2 |
| A | 10 | 83 | 718765 | 2113.86 | 1691 | 1655 | 339.2 |
| A | 9 | 143 | 229185 | 670.7 | 1691 | 1655 | 339.2 |
| B | 4 | 171 | 572072 | 1768.66 | 1707 | 1664 | 322.5 |
| B | 15 | 35 | 272926 | 841.1 | 1707 | 1664 | 322.5 |
| B | 0 | 189 | 225562 | 694.24 | 1707 | 1664 | 322.5 |
| C | 14 | 254 | 969073 | 2485.75 | 1676 | 1684 | 389.2 |
| C | 15 | 214 | 692451 | 1774.96 | 1676 | 1684 | 389.2 |
| C | 0 | 207 | 461377 | 1181.2 | 1676 | 1684 | 389.2 |
| D | 12 | 227 | 1130139 | 2809.88 | 1640 | 1595 | 401.6 |
| D | 2 | 249 | 819032 | 2035.28 | 1640 | 1595 | 401.6 |
| D | 13 | 249 | 327739 | 812.04 | 1640 | 1595 | 401.6 |
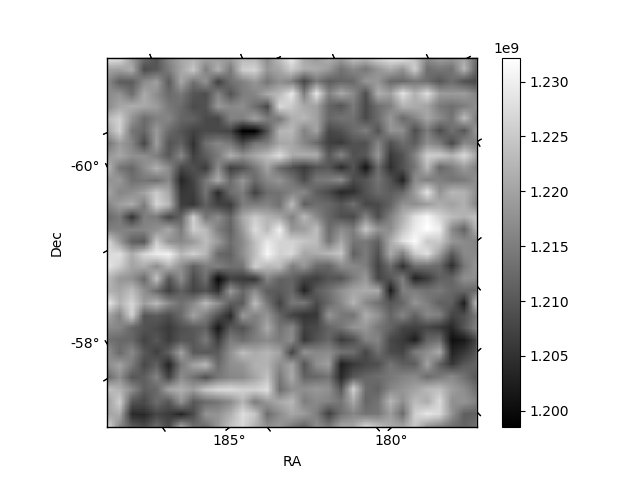
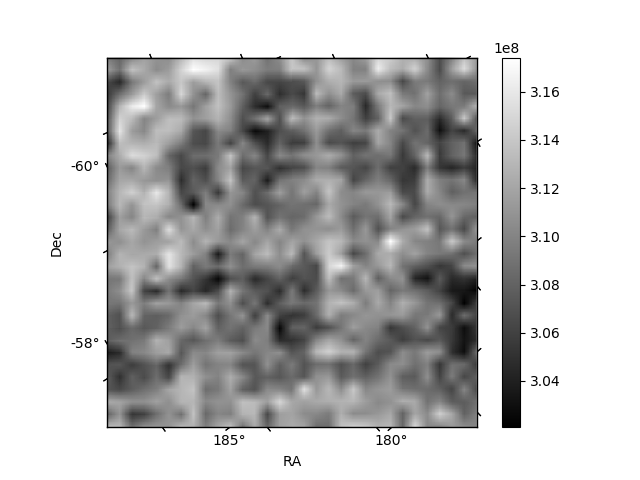
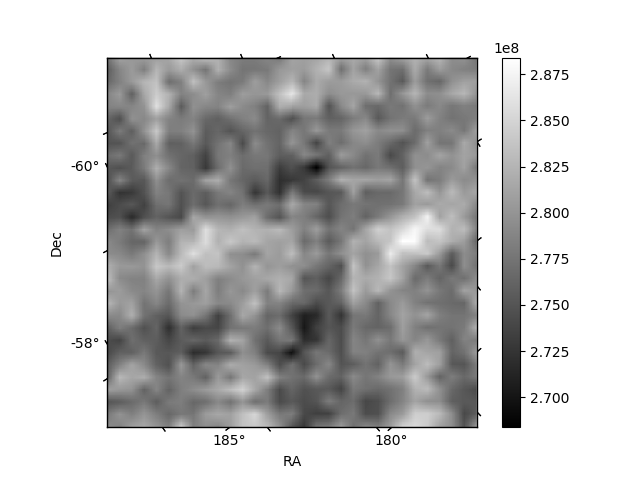
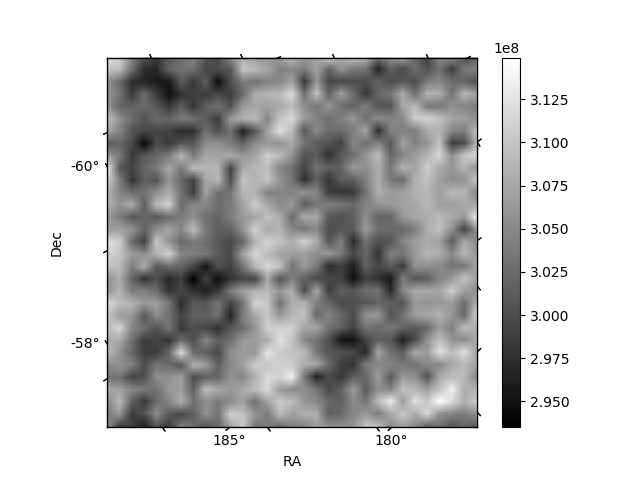
Histogram calculated using DETX and DETY for each event in the final _common_clean file
| Quadrant A | 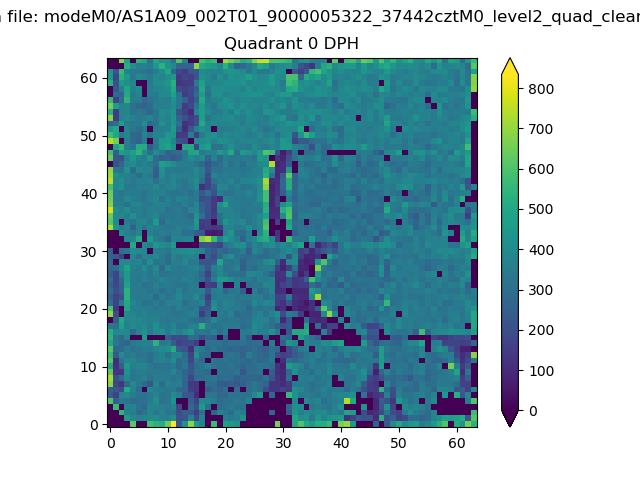 |
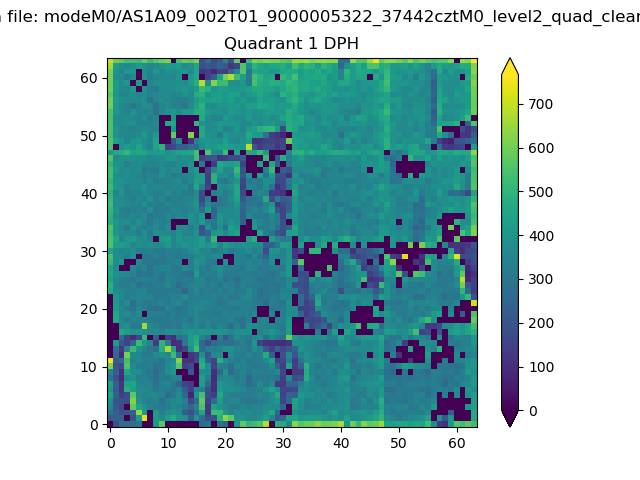 |
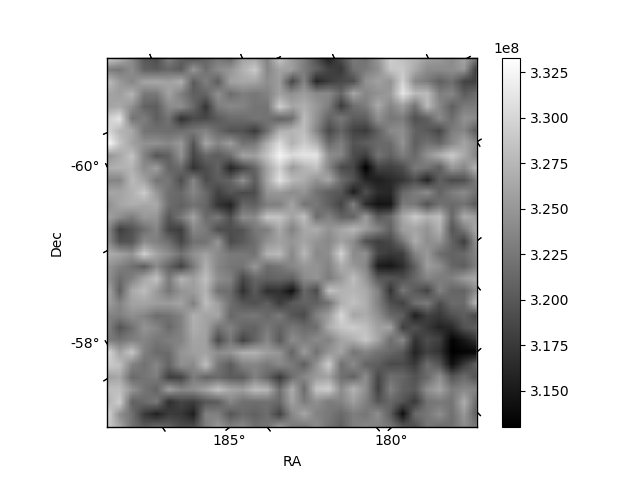
Quadrant B |
|---|---|---|---|
| Quadrant D | 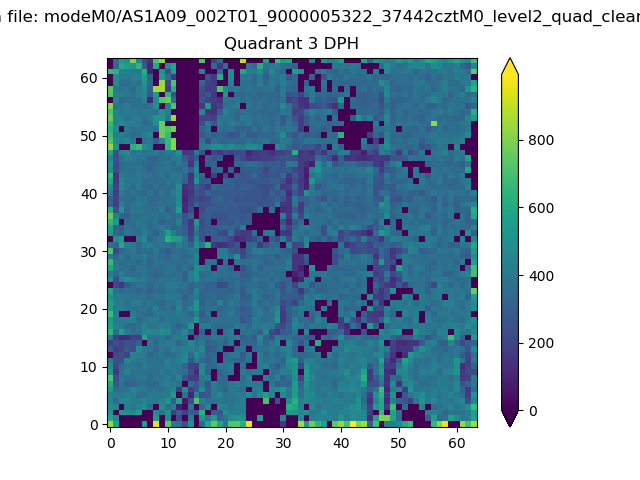 |
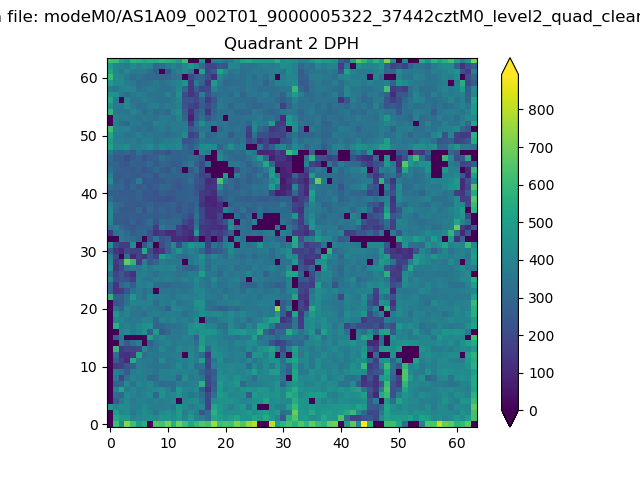 |
Quadrant C |
| Plot type | Count rate plots | Images |
|---|---|---|
| Comparison with Poisson distribution Blue bars denote a histogram of data divided into 1 sec bins. Red curve is a Poisson curve with rate = median count rate of data. |
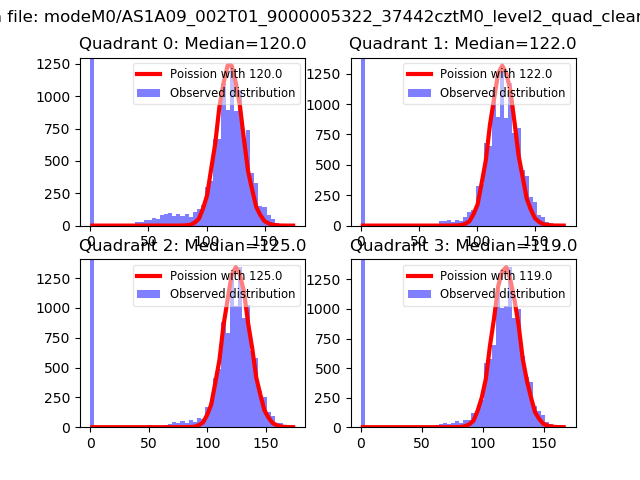 |
 |
| Quadrant-wise count rates Data is divided into 100 sec bins |
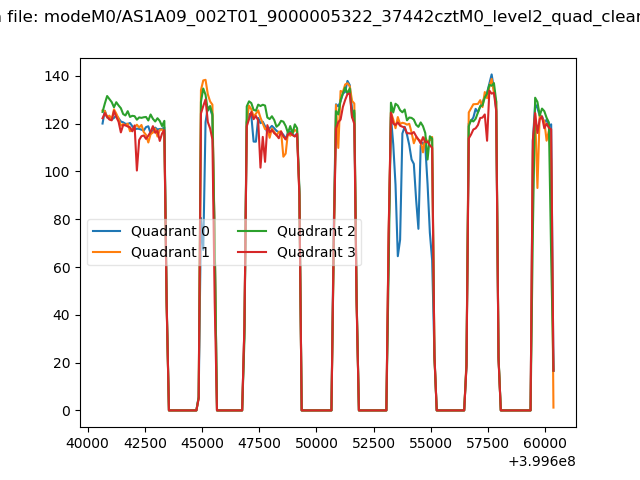 |
|
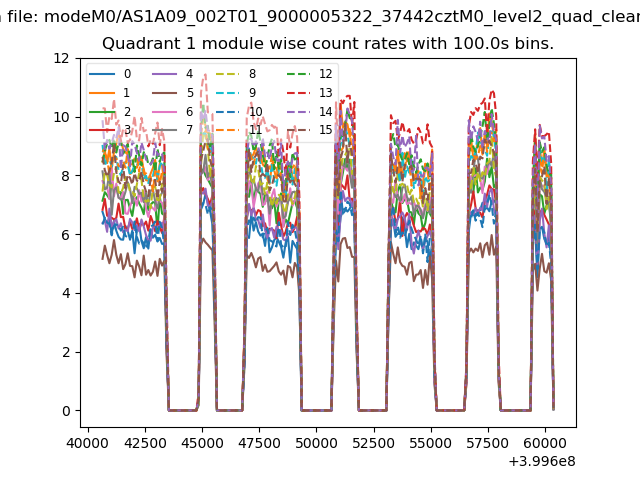
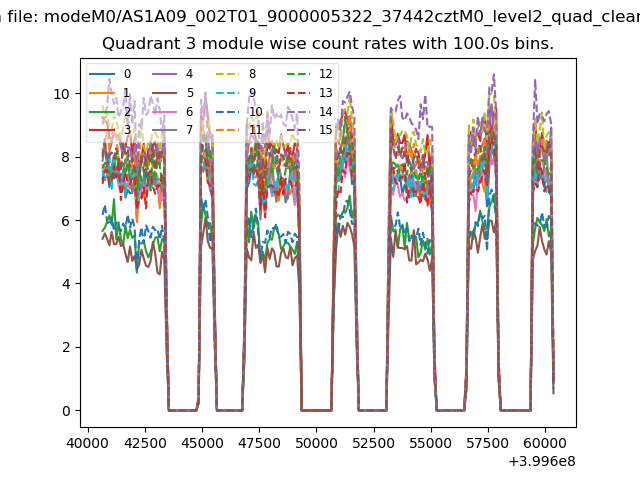
| Module-wise count rates for Quadrant A Data is divided into 100 sec bins |
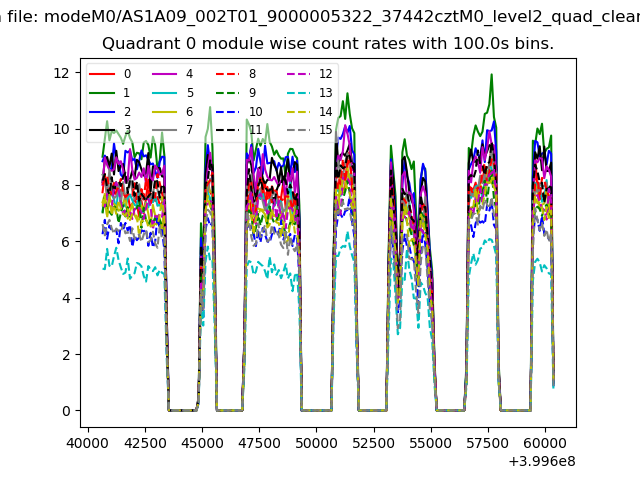 |
 |
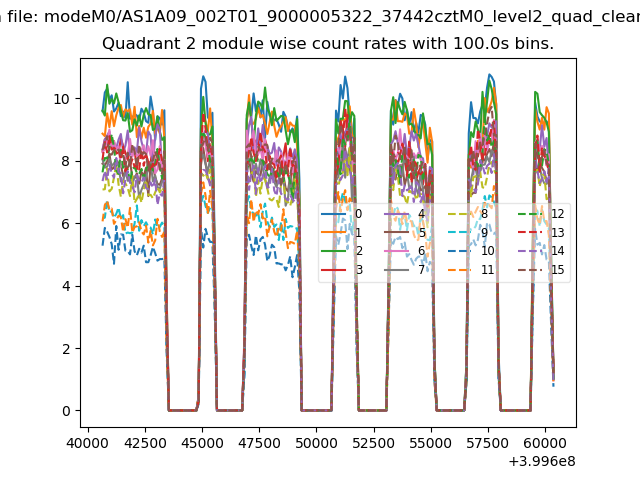
| Module-wise count rates for Quadrant B Data is divided into 100 sec bins |
 |
 |
| Module-wise count rates for Quadrant C Data is divided into 100 sec bins |
 |
 |
| Module-wise count rates for Quadrant D Data is divided into 100 sec bins |
 |
 |
| Parameter | Plot |
|---|---|
| CZT HV Monitor | 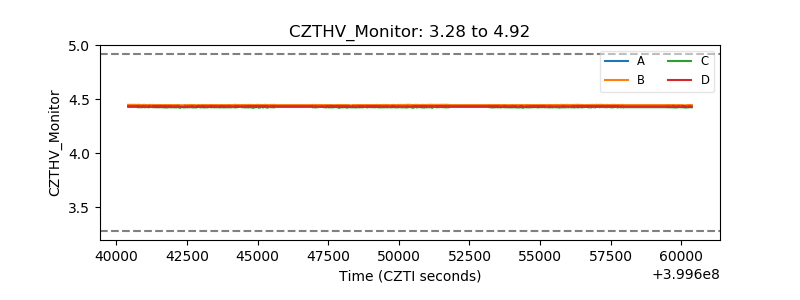 |
| D_VDD | 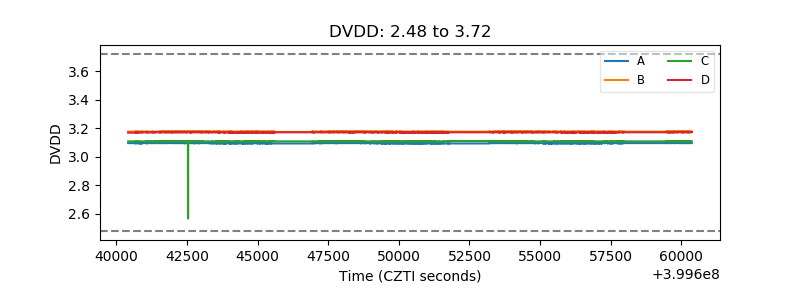 |
| Temperature 1 | 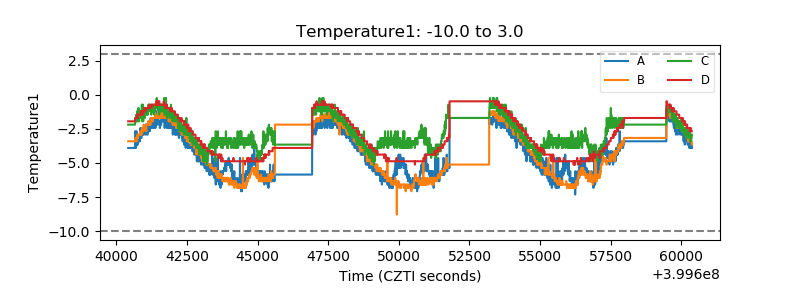 |
| Veto HV Monitor | 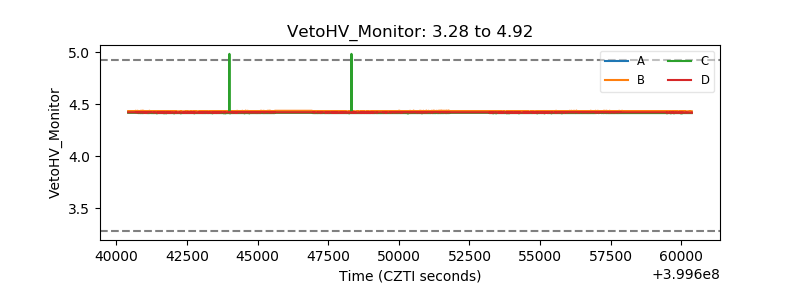 |
| Veto LLD | 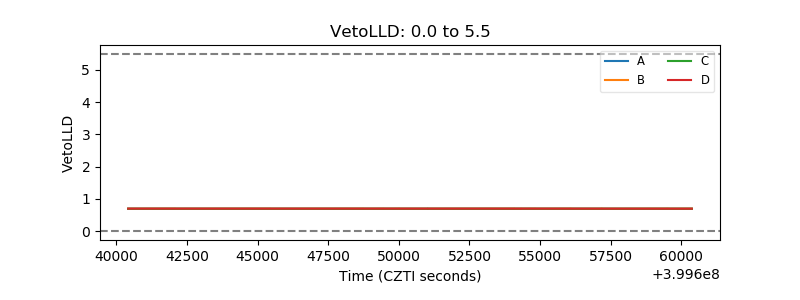 |
| Alpha Counter | 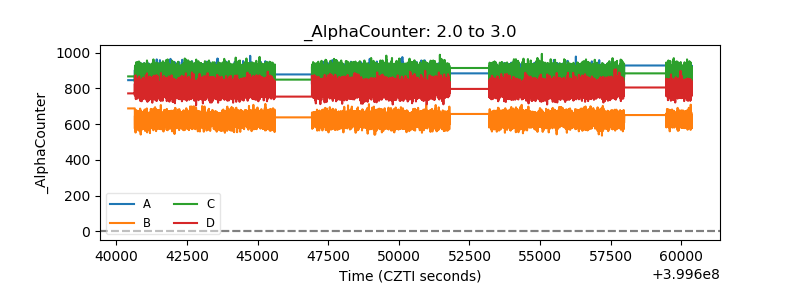 |
| _CPM_Rate | 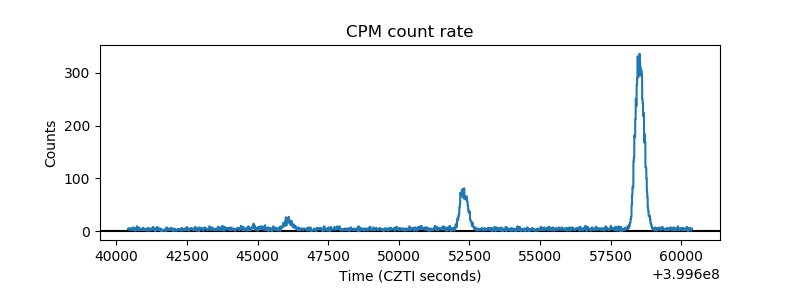 |
| CZT Counter | 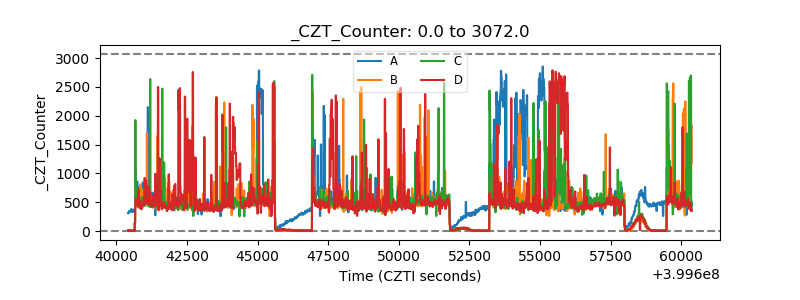 |
| +2.5 Volts monitor | 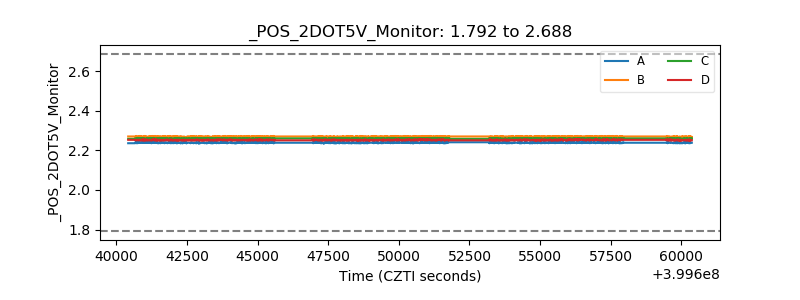 |
| +5 Volts monitor | 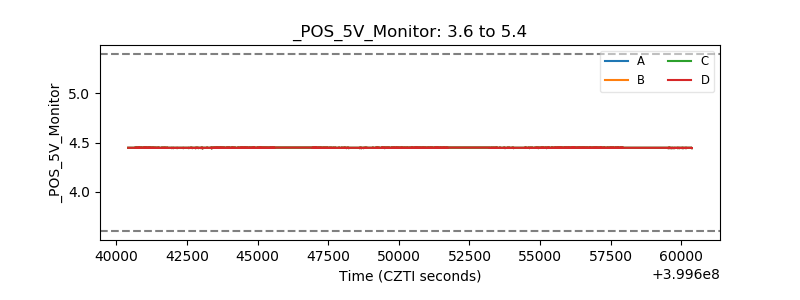 |
| _ROLL_ROT | 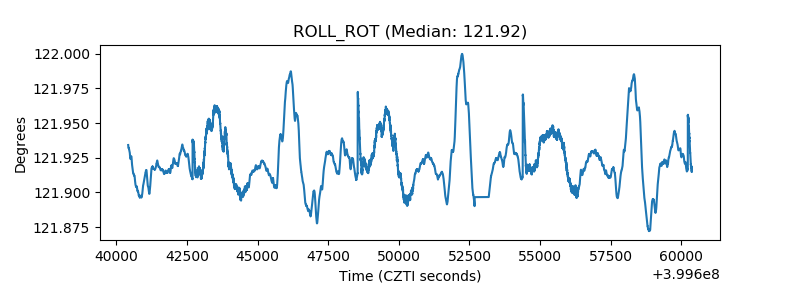 |
| _Roll_DEC | 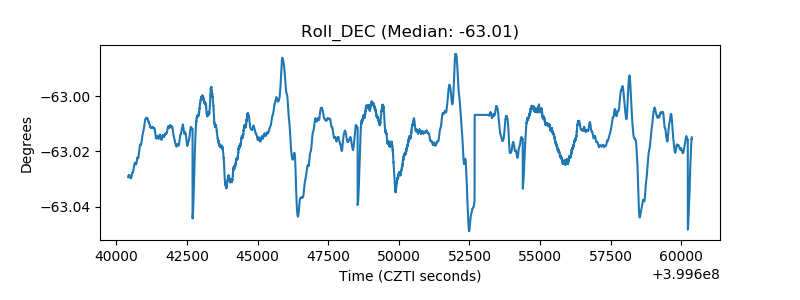 |
| _Roll_RA | 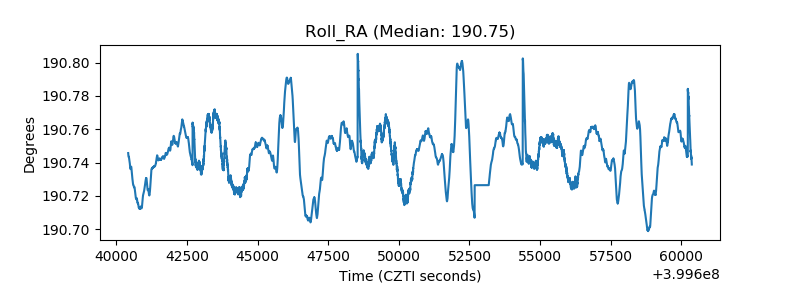 |
| Veto Counter | 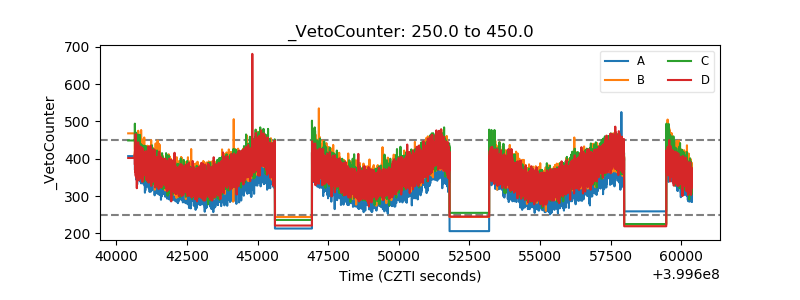 |