| Param | Original file | Final file |
|---|---|---|
| Filename | modeM0/AS1A09_002T01_9000005322_37443cztM0_level2.evt | modeM0/AS1A09_002T01_9000005322_37443cztM0_level2_quad_clean.evt |
| Size (bytes) | 600,056,640 | 75,637,440 |
| Size | 572.3 MB | 72.1 MB |
| Events in quadrant A | 4,114,409 | 491,421 |
| Events in quadrant B | 5,736,600 | 439,891 |
| Events in quadrant C | 4,170,401 | 480,784 |
| Events in quadrant D | 3,773,340 | 486,821 |
| Mode M0 | |||
|---|---|---|---|
| Quadrant | BADHDUFLAG | Total packets | Discarded packets |
| A | 0 | 15958 | 3 |
| B | 0 | 20924 | 2 |
| C | 0 | 15957 | 2 |
| D | 0 | 15119 | 2 |
| Mode M9 | |||
|---|---|---|---|
| Quadrant | BADHDUFLAG | Total packets | Discarded packets |
| A | 0 | 22 | 0 |
| B | 0 | 22 | 0 |
| C | 0 | 22 | 0 |
| D | 0 | 23 | 0 |
| Mode SS | |||
|---|---|---|---|
| Quadrant | BADHDUFLAG | Total packets | Discarded packets |
| A | 0 | 116 | 0 |
| B | 0 | 116 | 0 |
| C | 0 | 116 | 0 |
| D | 0 | 116 | 0 |
| Quadrant | Total seconds | Saturated seconds | Saturation percentage |
|---|---|---|---|
| A | 5574 | 395 | 7.086473% |
| B | 5574 | 1128 | 20.236814% |
| C | 5574 | 513 | 9.203445% |
| D | 5574 | 247 | 4.431288% |
Noise dominated data is calculated using 1-second bins in cleaned event files. If a bin has >2000 counts, and if more than 50% of those come from <1% of pixels, then it is considered to be noise-dominated and hence unusable.
| Quadrant | # 1 sec bins | Bins with >0 counts | Bins with >2000 counts | High rate bins dominated by noise | Noise dominated (total time) | Noise dominated (detector-on time) | Marked lightcurve |
|---|---|---|---|---|---|---|---|
| A | 7157 | 5575 | 358 | 358 | 5.00% | 6.42% | 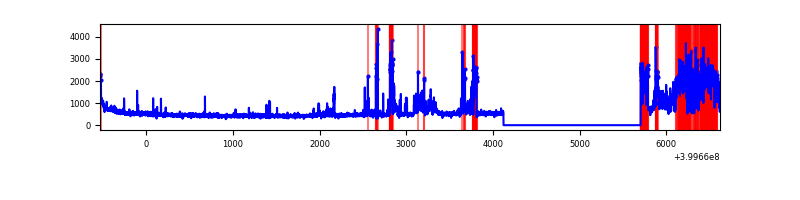 |
| B | 7156 | 5574 | 933 | 933 | 13.04% | 16.74% | 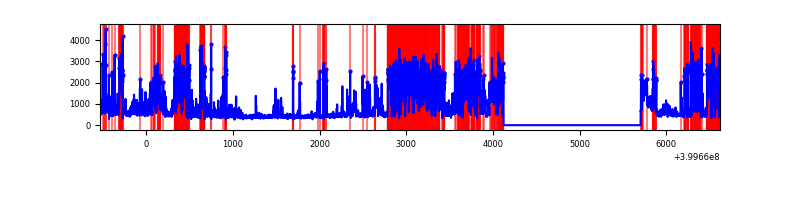 |
| C | 7157 | 5575 | 461 | 461 | 6.44% | 8.27% |  |
| D | 7157 | 5575 | 257 | 257 | 3.59% | 4.61% | 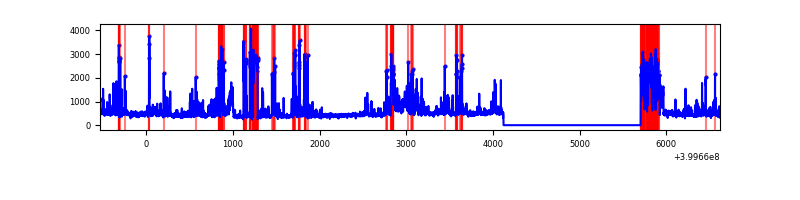 |
Top three noisy pixels from each quadrant. If the there are fewer than three noisy pixels in the level2.evt file, extra rows are filled as -1
| Pixel properties | Quadrant properties | ||||||
|---|---|---|---|---|---|---|---|
| Quadrant | DetID | PixID | Counts | Sigma | Mean | Median | Sigma |
| A | 15 | 222 | 1392892 | 11173.32 | 611 | 599 | 124.6 |
| A | 10 | 83 | 297496 | 2382.63 | 611 | 599 | 124.6 |
| A | 13 | 6 | 29453 | 231.56 | 611 | 599 | 124.6 |
| B | 15 | 35 | 2710197 | 24793.89 | 564 | 549 | 109.3 |
| B | 0 | 197 | 143729 | 1310.13 | 564 | 549 | 109.3 |
| B | 0 | 189 | 143454 | 1307.61 | 564 | 549 | 109.3 |
| C | 14 | 254 | 1345318 | 9953.61 | 576 | 581 | 135.1 |
| C | 0 | 10 | 306827 | 2266.8 | 576 | 581 | 135.1 |
| C | 15 | 214 | 240966 | 1779.31 | 576 | 581 | 135.1 |
| D | 2 | 153 | 385034 | 2649.22 | 594 | 577 | 145.1 |
| D | 13 | 249 | 355784 | 2447.66 | 594 | 577 | 145.1 |
| D | 2 | 249 | 154644 | 1061.64 | 594 | 577 | 145.1 |
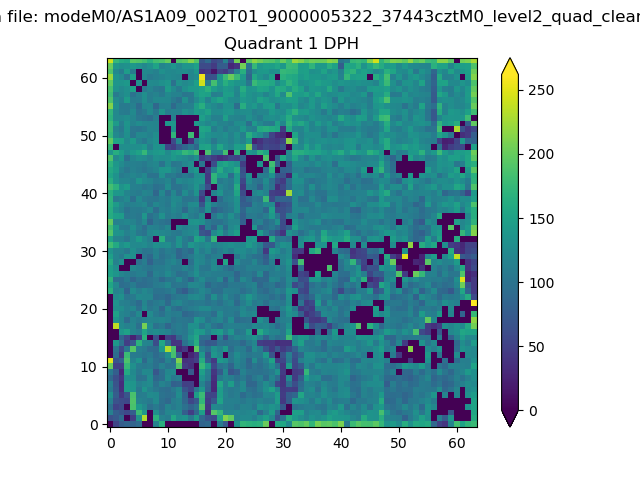
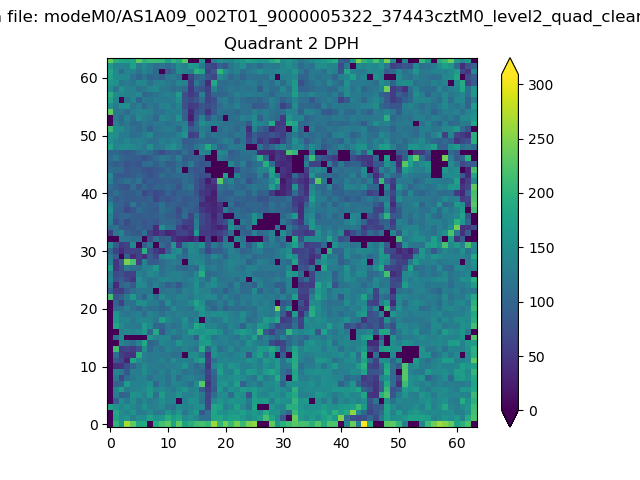
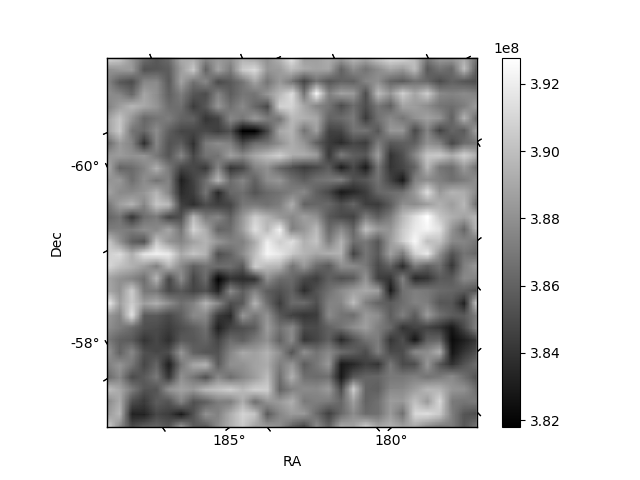
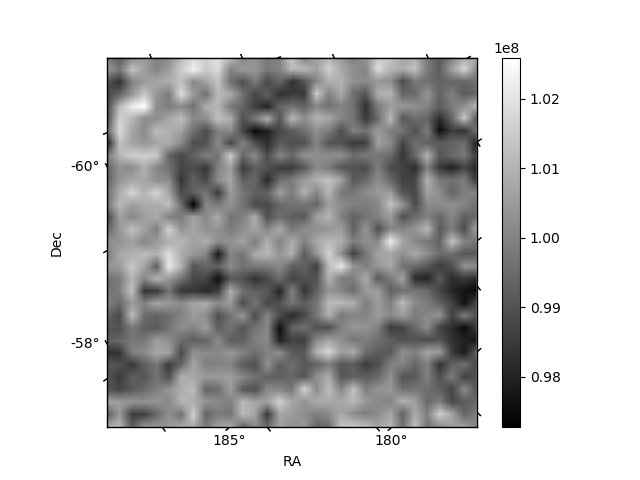
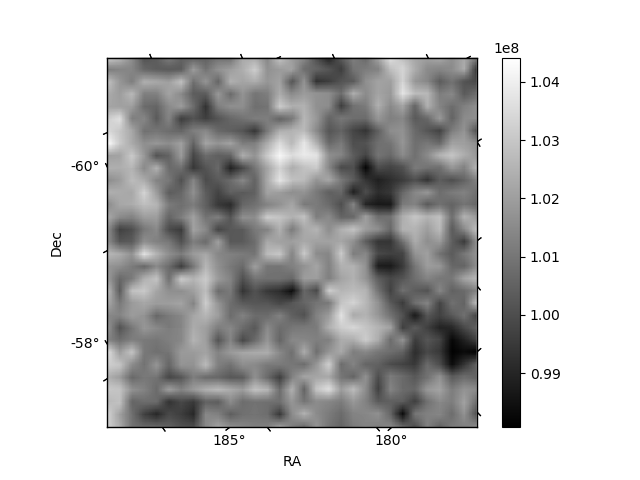
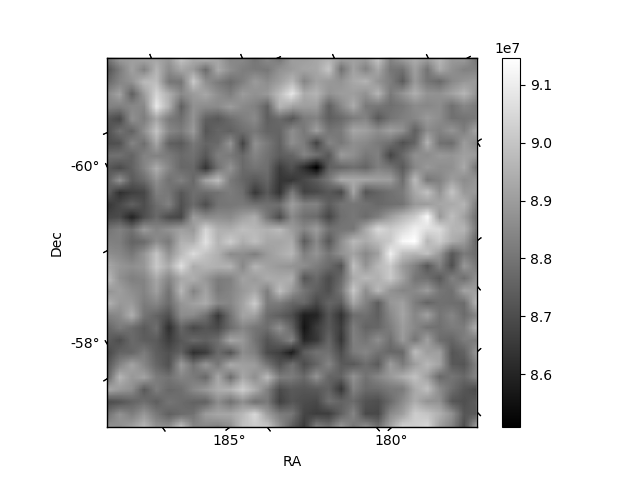
Histogram calculated using DETX and DETY for each event in the final _common_clean file
| Quadrant A | 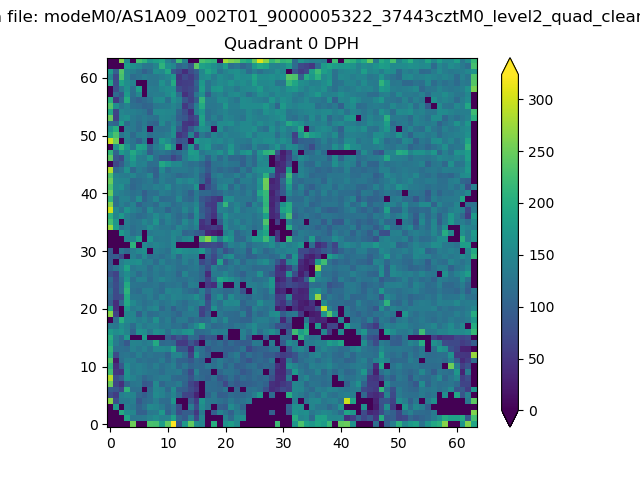 |
 |
Quadrant B |
|---|---|---|---|
| Quadrant D | 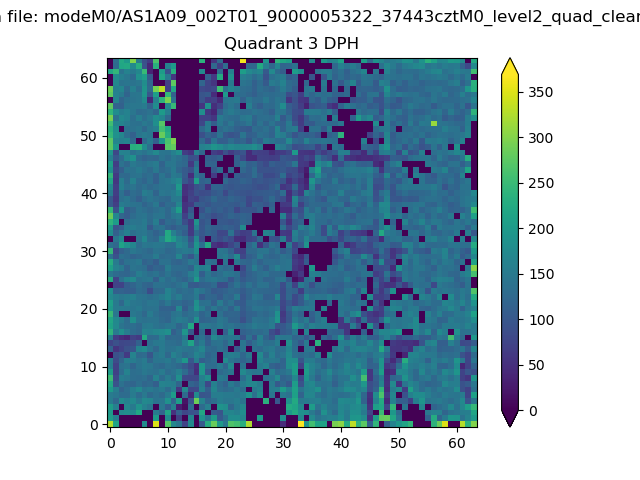 |
 |
Quadrant C |
| Plot type | Count rate plots | Images |
|---|---|---|
| Comparison with Poisson distribution Blue bars denote a histogram of data divided into 1 sec bins. Red curve is a Poisson curve with rate = median count rate of data. |
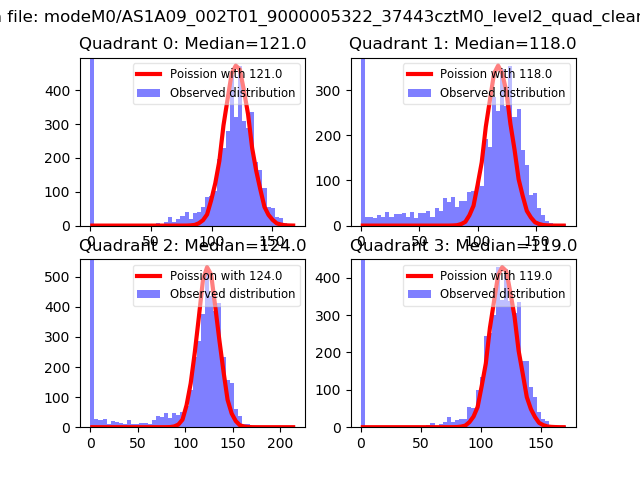 |
 |
| Quadrant-wise count rates Data is divided into 100 sec bins |
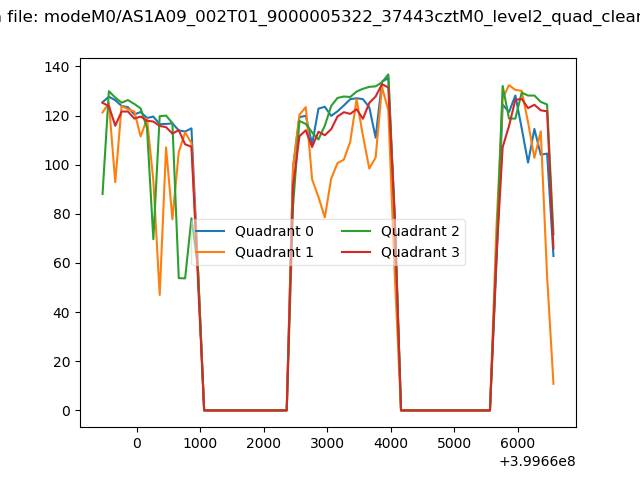 |
|
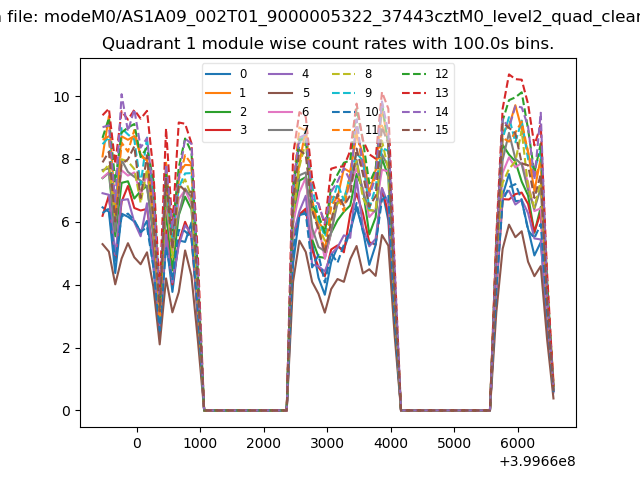
| Module-wise count rates for Quadrant A Data is divided into 100 sec bins |
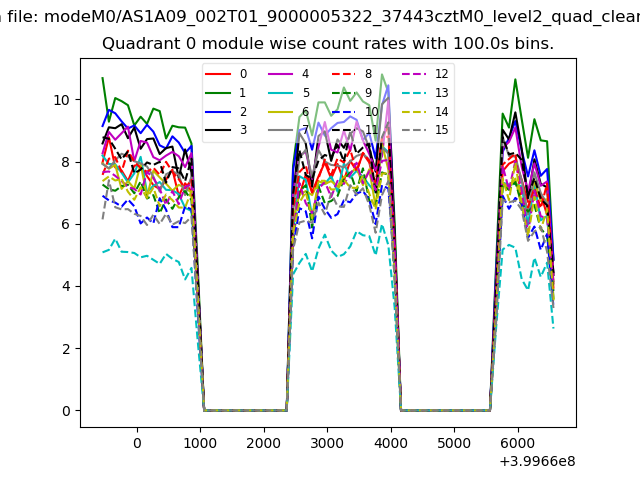 |
 |
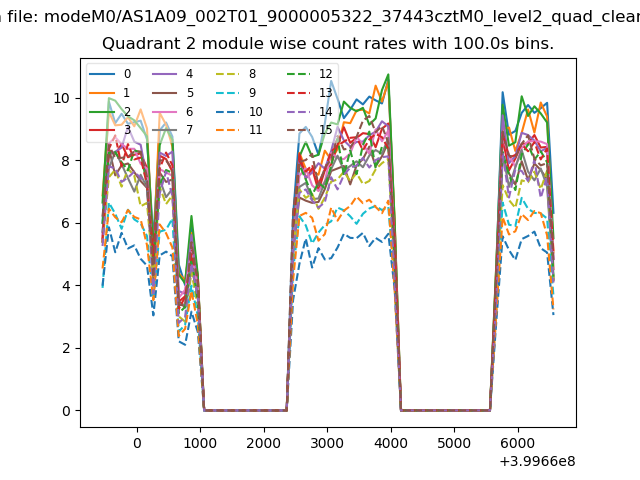
| Module-wise count rates for Quadrant B Data is divided into 100 sec bins |
 |
 |
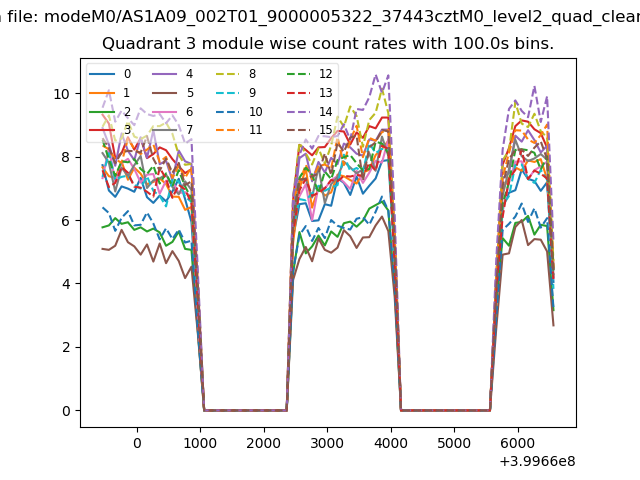
| Module-wise count rates for Quadrant C Data is divided into 100 sec bins |
 |
 |
| Module-wise count rates for Quadrant D Data is divided into 100 sec bins |
 |
 |
| Parameter | Plot |
|---|---|
| CZT HV Monitor | 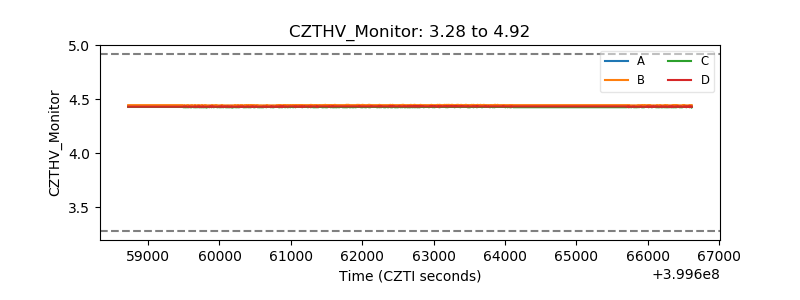 |
| D_VDD | 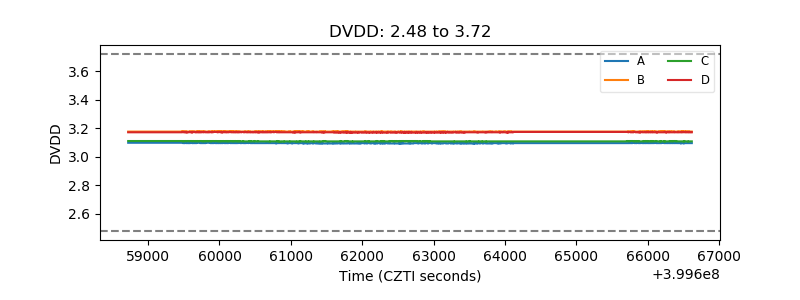 |
| Temperature 1 | 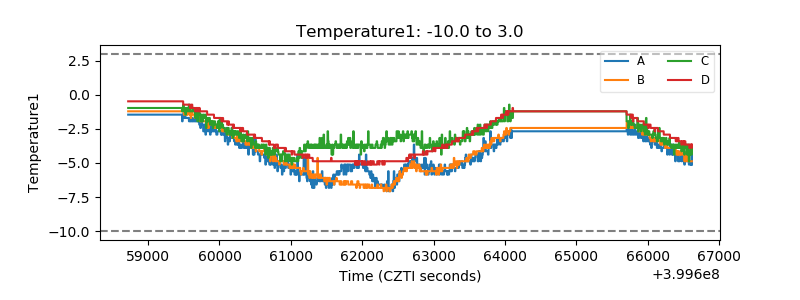 |
| Veto HV Monitor | 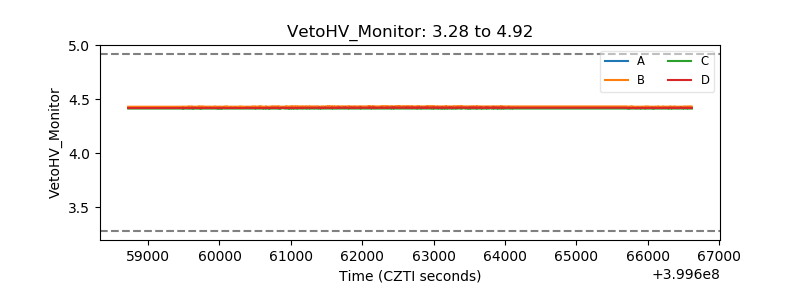 |
| Veto LLD | 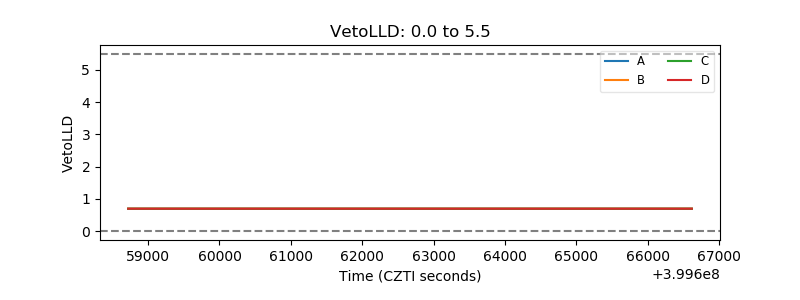 |
| Alpha Counter | 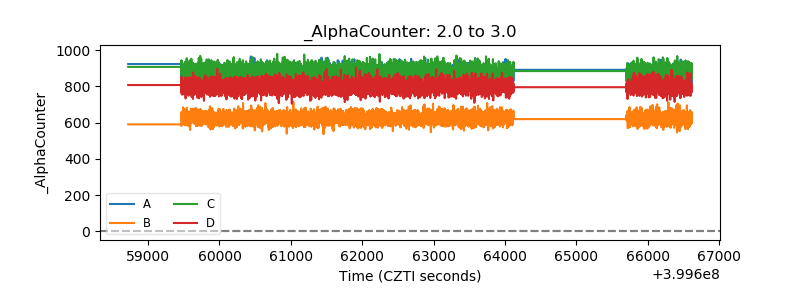 |
| _CPM_Rate | 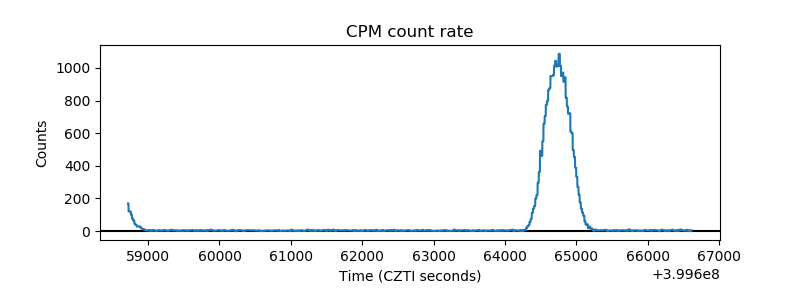 |
| CZT Counter | 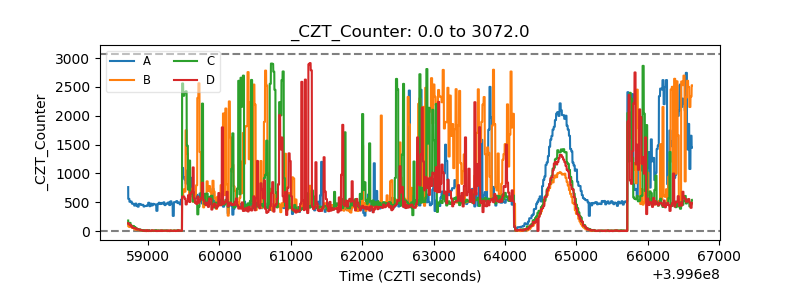 |
| +2.5 Volts monitor | 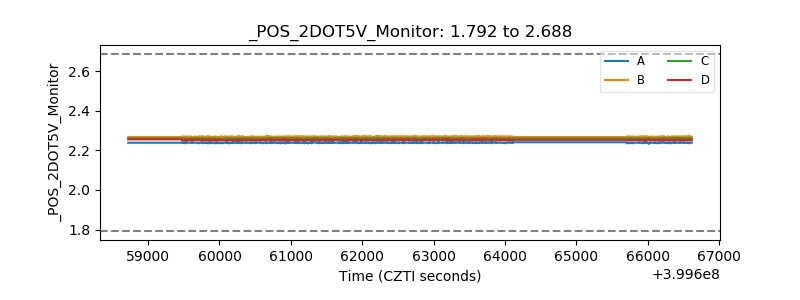 |
| +5 Volts monitor | 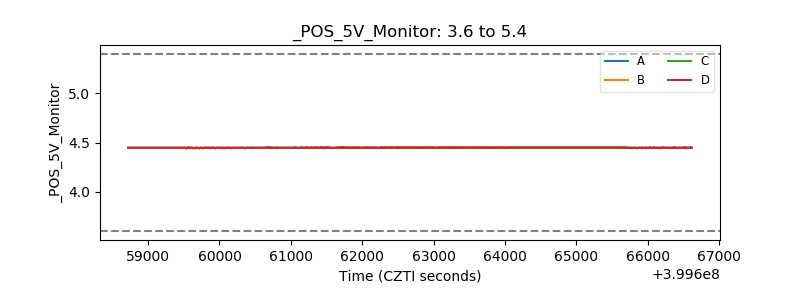 |
| _ROLL_ROT | 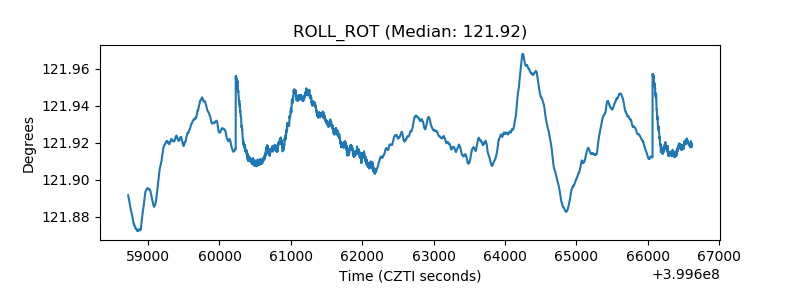 |
| _Roll_DEC | 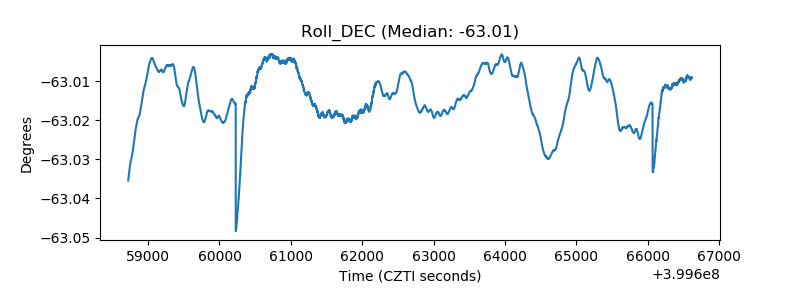 |
| _Roll_RA | 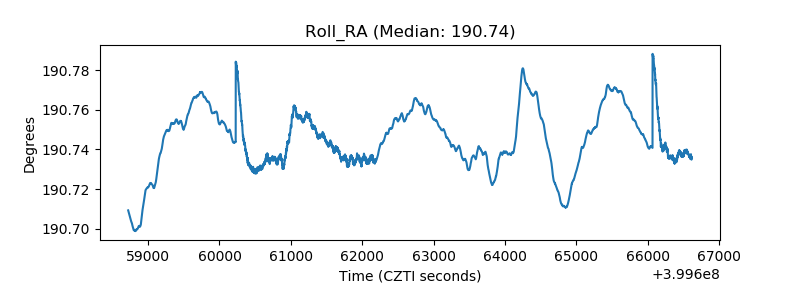 |
| Veto Counter | 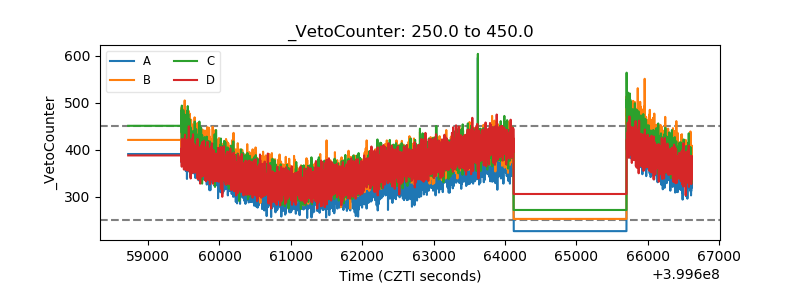 |