| Param | Original file | Final file |
|---|---|---|
| Filename | modeM0/AS1A09_002T01_9000005322_37445cztM0_level2.evt | modeM0/AS1A09_002T01_9000005322_37445cztM0_level2_quad_clean.evt |
| Size (bytes) | 826,119,360 | 69,140,160 |
| Size | 787.8 MB | 65.9 MB |
| Events in quadrant A | 8,738,245 | 432,823 |
| Events in quadrant B | 8,811,495 | 335,703 |
| Events in quadrant C | 3,266,571 | 484,775 |
| Events in quadrant D | 3,836,249 | 457,619 |
| Mode M0 | |||
|---|---|---|---|
| Quadrant | BADHDUFLAG | Total packets | Discarded packets |
| A | 0 | 29720 | 3 |
| B | 0 | 29902 | 2 |
| C | 0 | 13100 | 2 |
| D | 0 | 15237 | 2 |
| Mode M9 | |||
|---|---|---|---|
| Quadrant | BADHDUFLAG | Total packets | Discarded packets |
| A | 0 | 19 | 0 |
| B | 0 | 19 | 0 |
| C | 0 | 19 | 0 |
| D | 0 | 20 | 0 |
| Mode SS | |||
|---|---|---|---|
| Quadrant | BADHDUFLAG | Total packets | Discarded packets |
| A | 0 | 112 | 0 |
| B | 0 | 112 | 0 |
| C | 0 | 112 | 0 |
| D | 0 | 112 | 0 |
| Quadrant | Total seconds | Saturated seconds | Saturation percentage |
|---|---|---|---|
| A | 5440 | 2052 | 37.720588% |
| B | 5440 | 2538 | 46.654412% |
| C | 5440 | 169 | 3.106618% |
| D | 5440 | 201 | 3.694853% |
Noise dominated data is calculated using 1-second bins in cleaned event files. If a bin has >2000 counts, and if more than 50% of those come from <1% of pixels, then it is considered to be noise-dominated and hence unusable.
| Quadrant | # 1 sec bins | Bins with >0 counts | Bins with >2000 counts | High rate bins dominated by noise | Noise dominated (total time) | Noise dominated (detector-on time) | Marked lightcurve |
|---|---|---|---|---|---|---|---|
| A | 7173 | 5440 | 1861 | 1861 | 25.94% | 34.21% | 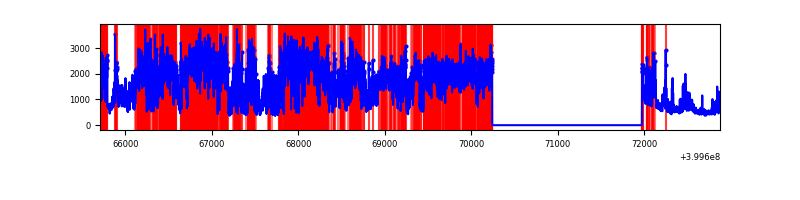 |
| B | 7173 | 5440 | 2273 | 2273 | 31.69% | 41.78% | 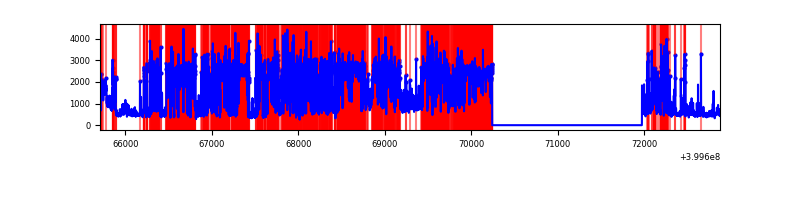 |
| C | 7173 | 5441 | 158 | 158 | 2.20% | 2.90% | 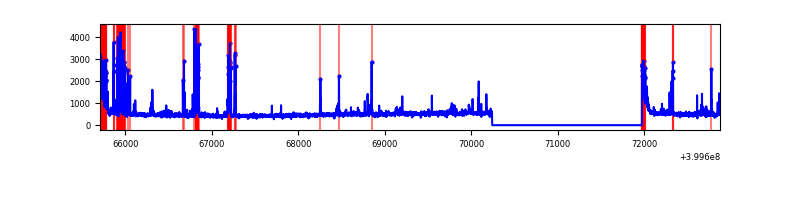 |
| D | 7173 | 5441 | 221 | 221 | 3.08% | 4.06% | 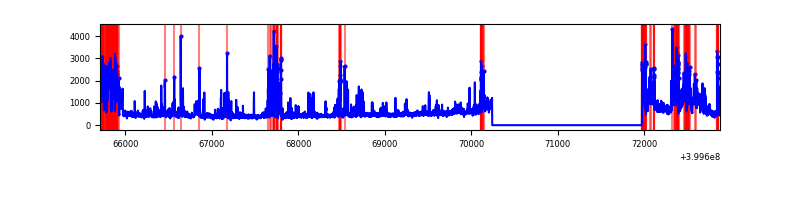 |
Top three noisy pixels from each quadrant. If the there are fewer than three noisy pixels in the level2.evt file, extra rows are filled as -1
| Pixel properties | Quadrant properties | ||||||
|---|---|---|---|---|---|---|---|
| Quadrant | DetID | PixID | Counts | Sigma | Mean | Median | Sigma |
| A | 15 | 222 | 5931983 | 53076.91 | 560 | 549 | 111.8 |
| A | 5 | 168 | 283701 | 2533.76 | 560 | 549 | 111.8 |
| A | 10 | 83 | 269254 | 2404.48 | 560 | 549 | 111.8 |
| B | 15 | 35 | 5438563 | 64521.05 | 437 | 427 | 84.3 |
| B | 4 | 171 | 1055856 | 12522.19 | 437 | 427 | 84.3 |
| B | 0 | 189 | 404471 | 4793.8 | 437 | 427 | 84.3 |
| C | 14 | 254 | 479595 | 3496.92 | 589 | 593 | 137.0 |
| C | 15 | 214 | 245313 | 1786.56 | 589 | 593 | 137.0 |
| C | 0 | 10 | 233264 | 1698.6 | 589 | 593 | 137.0 |
| D | 12 | 235 | 531337 | 3749.68 | 586 | 570 | 141.5 |
| D | 2 | 153 | 365298 | 2576.68 | 586 | 570 | 141.5 |
| D | 13 | 249 | 327410 | 2309.01 | 586 | 570 | 141.5 |
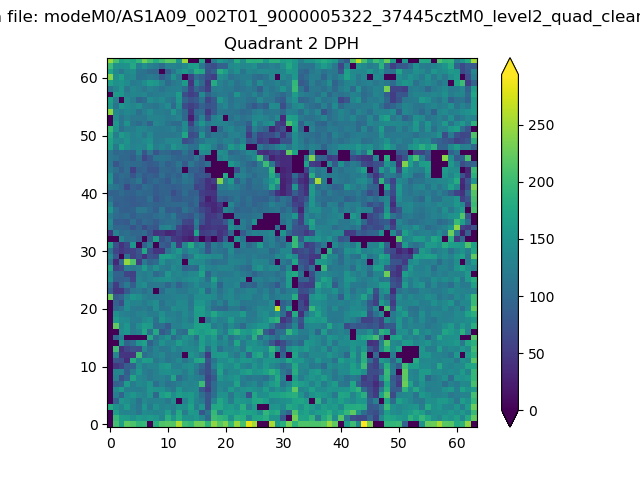
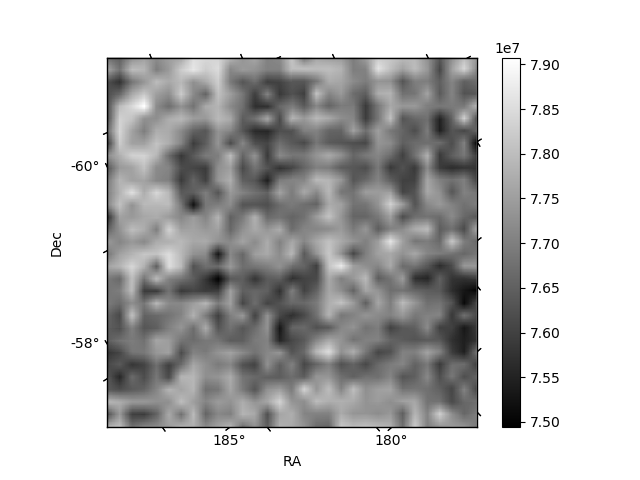
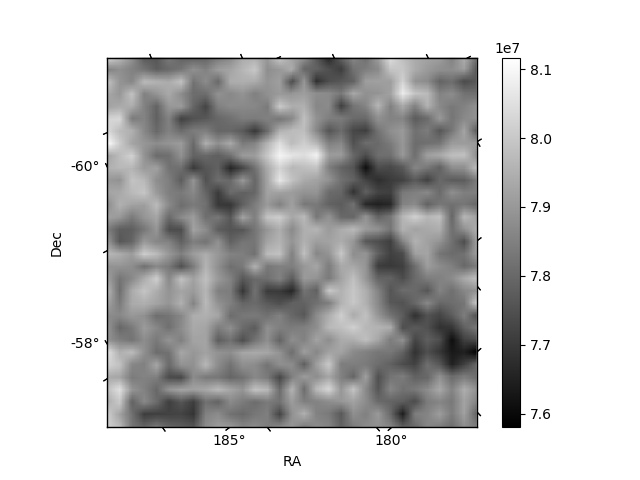
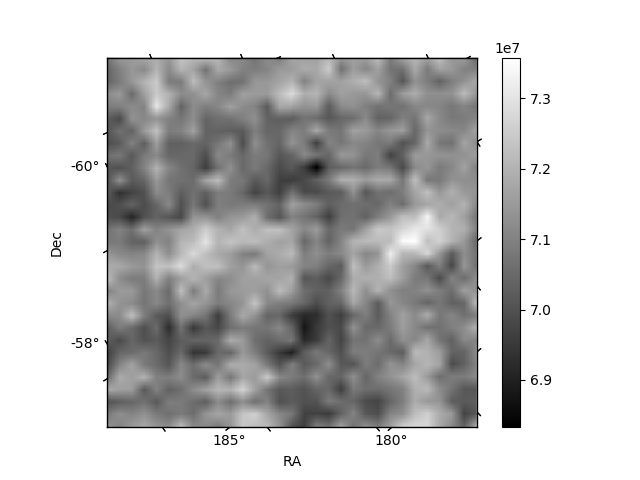
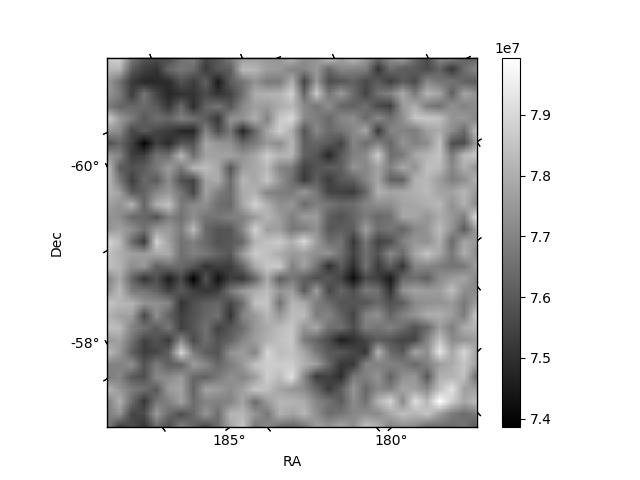
Histogram calculated using DETX and DETY for each event in the final _common_clean file
| Quadrant A | 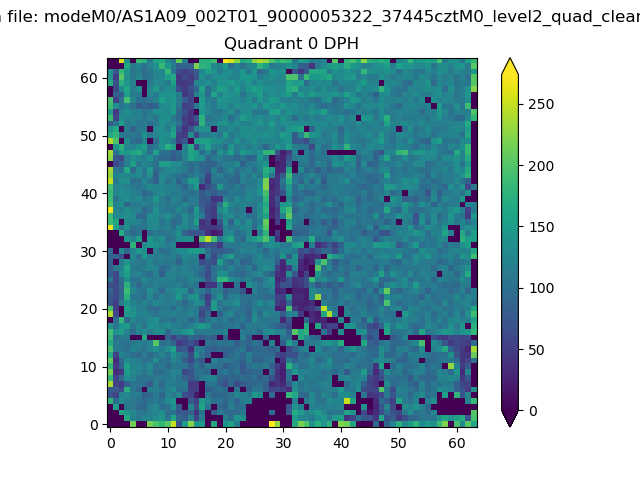 |
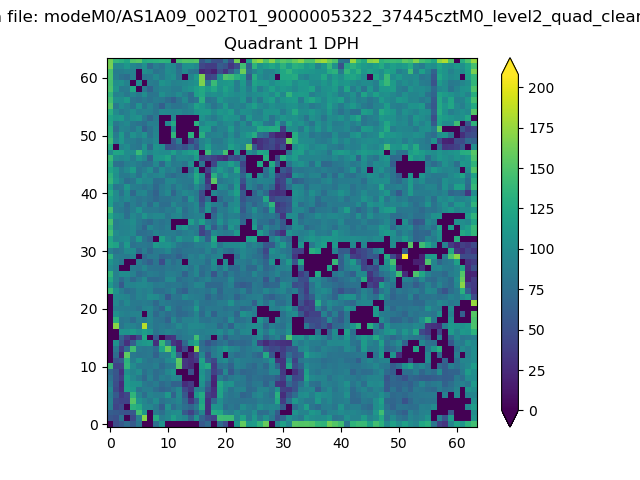 |
Quadrant B |
|---|---|---|---|
| Quadrant D | 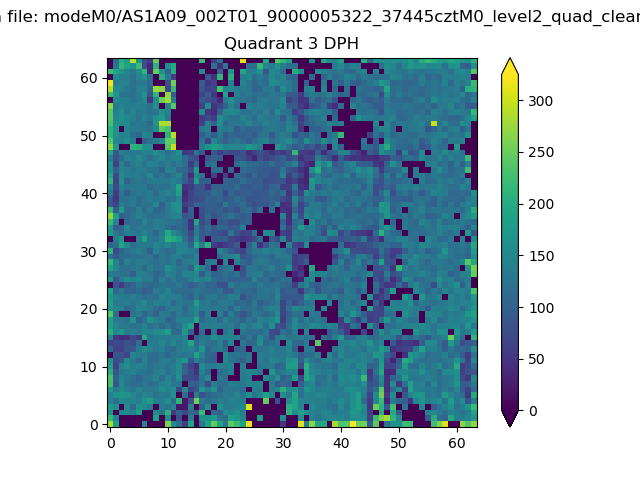 |
 |
Quadrant C |
| Plot type | Count rate plots | Images |
|---|---|---|
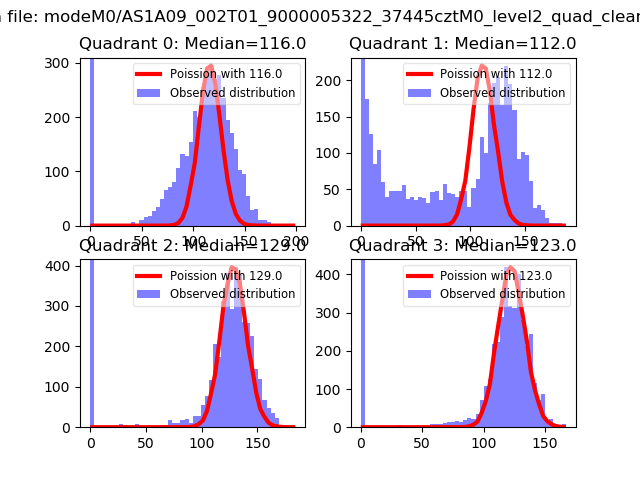
| Comparison with Poisson distribution Blue bars denote a histogram of data divided into 1 sec bins. Red curve is a Poisson curve with rate = median count rate of data. |
 |
 |
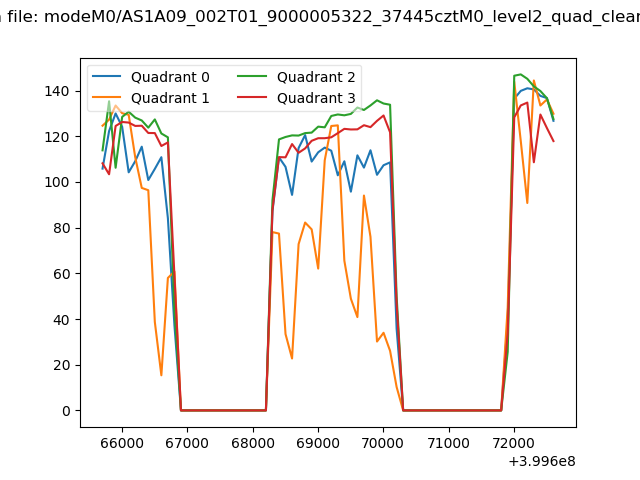
| Quadrant-wise count rates Data is divided into 100 sec bins |
 |
|
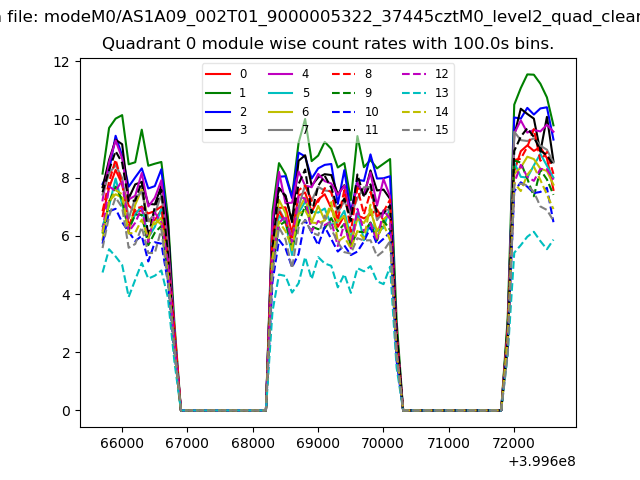
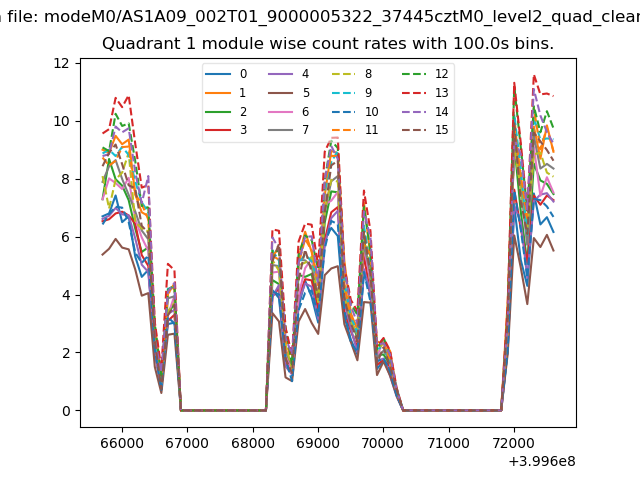
| Module-wise count rates for Quadrant A Data is divided into 100 sec bins |
 |
 |
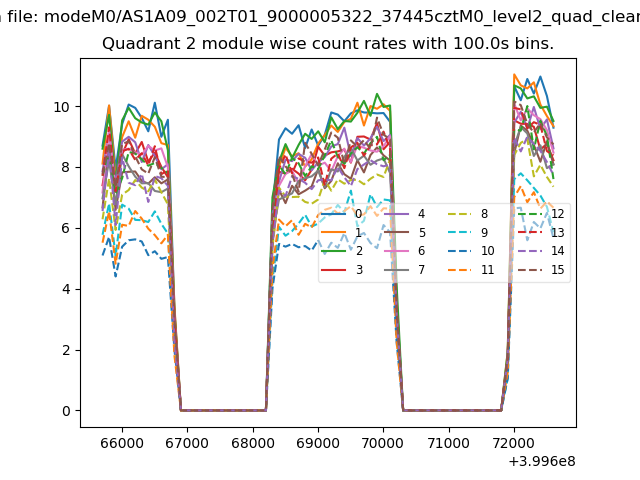
| Module-wise count rates for Quadrant B Data is divided into 100 sec bins |
 |
 |
| Module-wise count rates for Quadrant C Data is divided into 100 sec bins |
 |
 |
| Module-wise count rates for Quadrant D Data is divided into 100 sec bins |
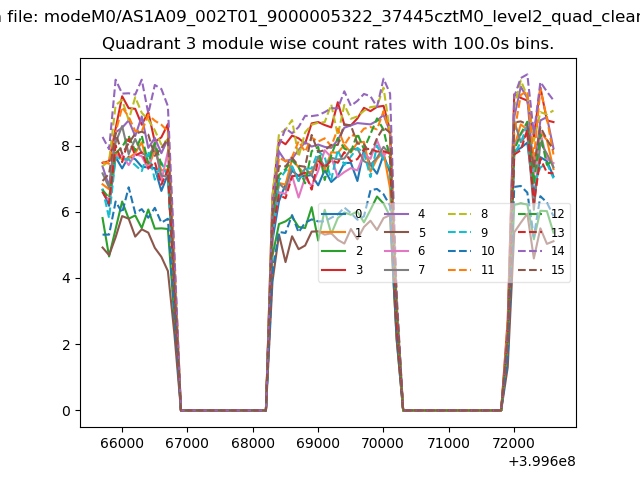 |
 |
| Parameter | Plot |
|---|---|
| CZT HV Monitor | 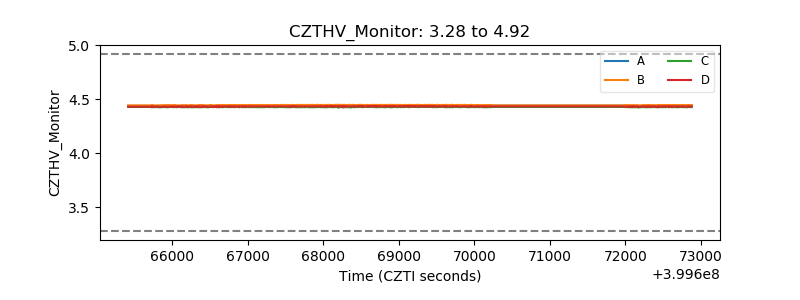 |
| D_VDD | 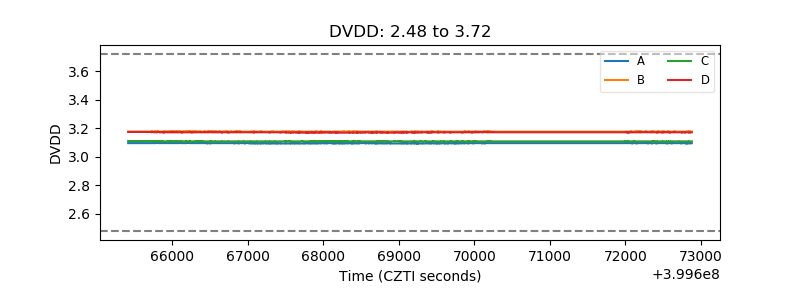 |
| Temperature 1 | 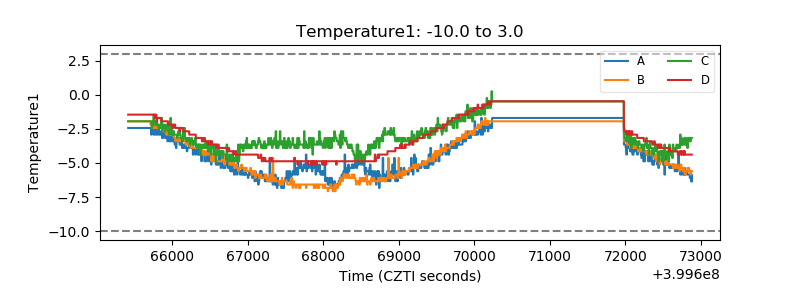 |
| Veto HV Monitor | 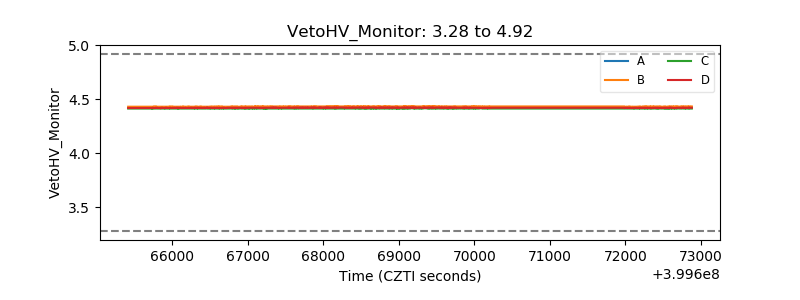 |
| Veto LLD | 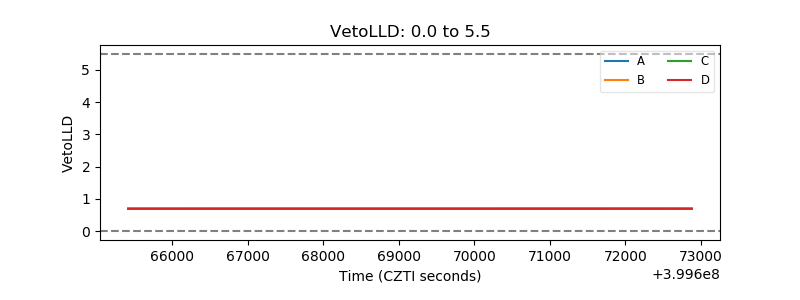 |
| Alpha Counter | 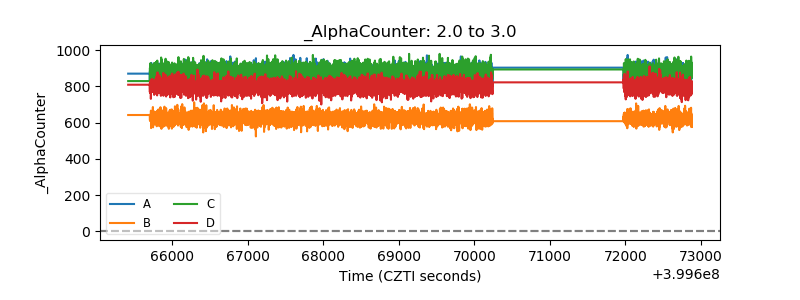 |
| _CPM_Rate | 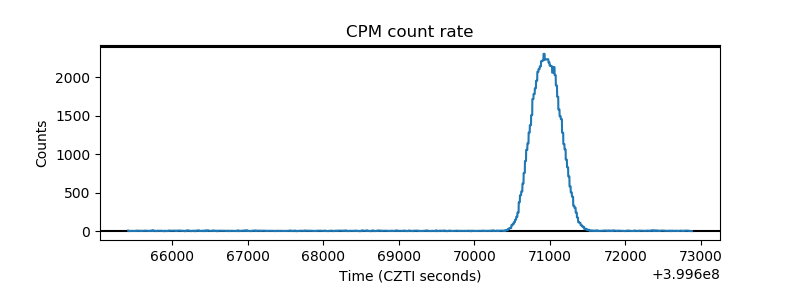 |
| CZT Counter | 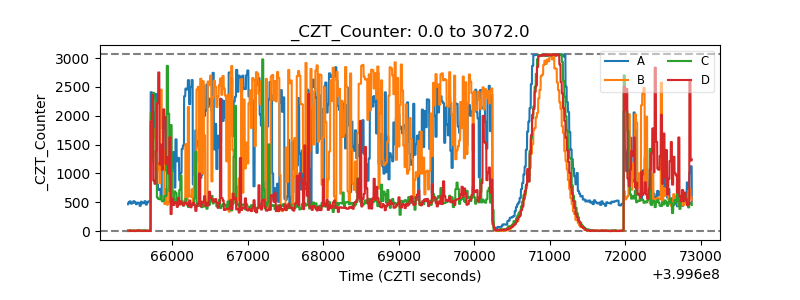 |
| +2.5 Volts monitor | 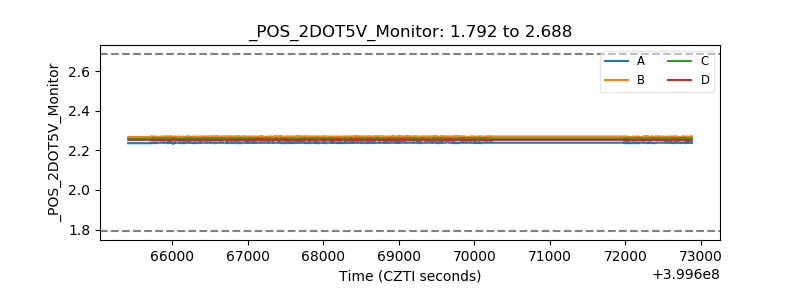 |
| +5 Volts monitor | 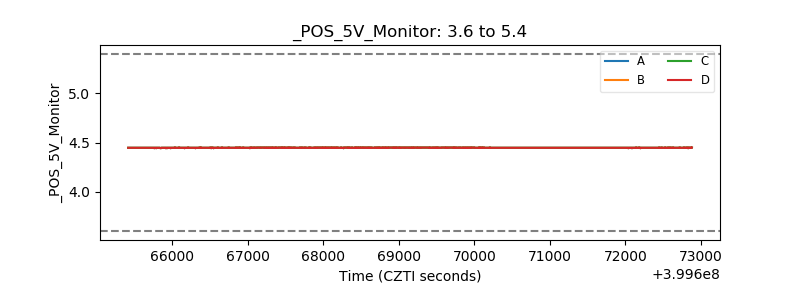 |
| _ROLL_ROT | 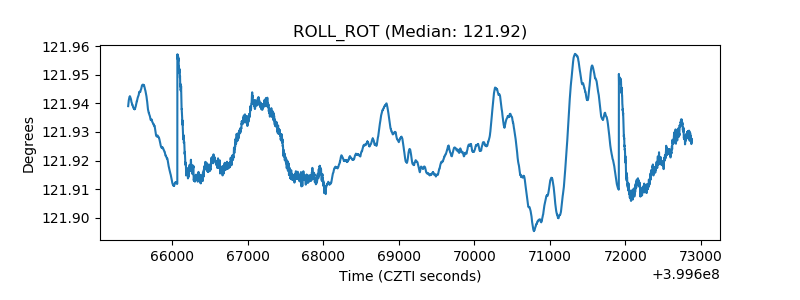 |
| _Roll_DEC | 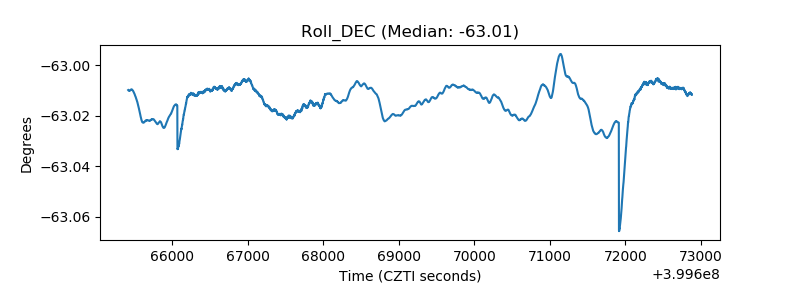 |
| _Roll_RA | 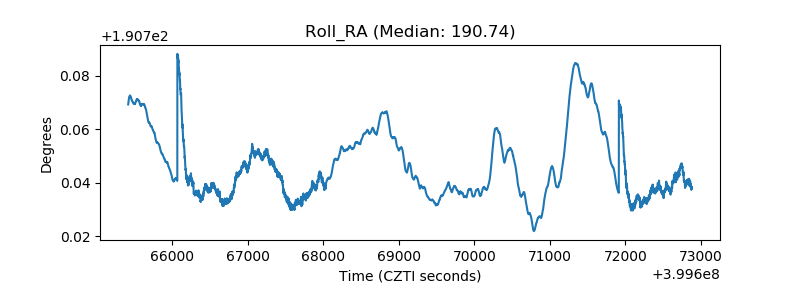 |
| Veto Counter | 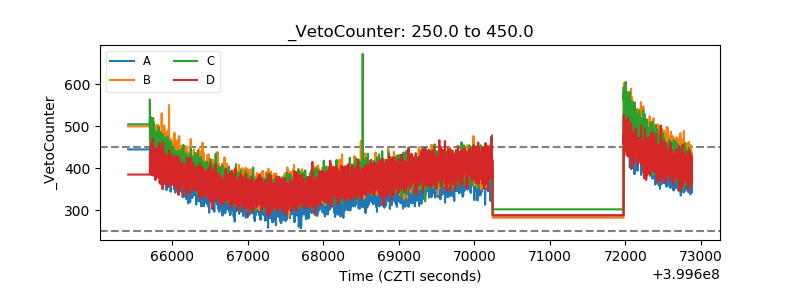 |