| Param | Original file | Final file |
|---|---|---|
| Filename | modeM0/AS1A09_002T01_9000005322_37446cztM0_level2.evt | modeM0/AS1A09_002T01_9000005322_37446cztM0_level2_quad_clean.evt |
| Size (bytes) | 501,989,760 | 67,193,280 |
| Size | 478.7 MB | 64.1 MB |
| Events in quadrant A | 3,699,984 | 428,353 |
| Events in quadrant B | 3,245,473 | 429,636 |
| Events in quadrant C | 4,061,097 | 401,671 |
| Events in quadrant D | 3,841,029 | 407,336 |
| Mode M0 | |||
|---|---|---|---|
| Quadrant | BADHDUFLAG | Total packets | Discarded packets |
| A | 0 | 14487 | 3 |
| B | 0 | 12981 | 2 |
| C | 0 | 15317 | 2 |
| D | 0 | 14911 | 2 |
| Mode M9 | |||
|---|---|---|---|
| Quadrant | BADHDUFLAG | Total packets | Discarded packets |
| A | 0 | 25 | 0 |
| B | 0 | 25 | 0 |
| C | 0 | 25 | 0 |
| D | 0 | 26 | 0 |
| Mode SS | |||
|---|---|---|---|
| Quadrant | BADHDUFLAG | Total packets | Discarded packets |
| A | 0 | 106 | 0 |
| B | 0 | 106 | 0 |
| C | 0 | 106 | 0 |
| D | 0 | 106 | 0 |
| Quadrant | Total seconds | Saturated seconds | Saturation percentage |
|---|---|---|---|
| A | 5245 | 73 | 1.391802% |
| B | 5245 | 206 | 3.927550% |
| C | 5245 | 536 | 10.219256% |
| D | 5245 | 138 | 2.631077% |
Noise dominated data is calculated using 1-second bins in cleaned event files. If a bin has >2000 counts, and if more than 50% of those come from <1% of pixels, then it is considered to be noise-dominated and hence unusable.
| Quadrant | # 1 sec bins | Bins with >0 counts | Bins with >2000 counts | High rate bins dominated by noise | Noise dominated (total time) | Noise dominated (detector-on time) | Marked lightcurve |
|---|---|---|---|---|---|---|---|
| A | 7098 | 5246 | 43 | 43 | 0.61% | 0.82% | 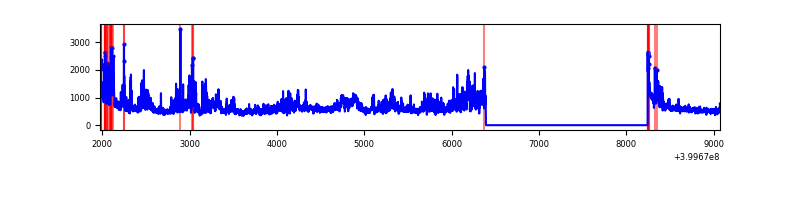 |
| B | 7098 | 5246 | 149 | 149 | 2.10% | 2.84% | 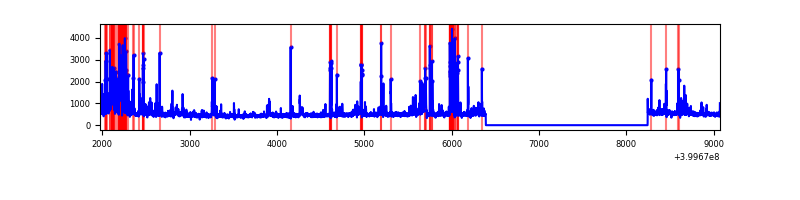 |
| C | 7098 | 5246 | 479 | 479 | 6.75% | 9.13% | 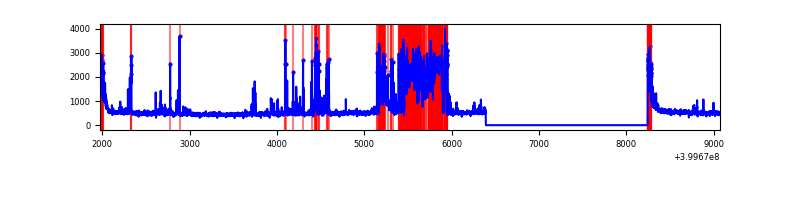 |
| D | 7098 | 5246 | 144 | 144 | 2.03% | 2.74% | 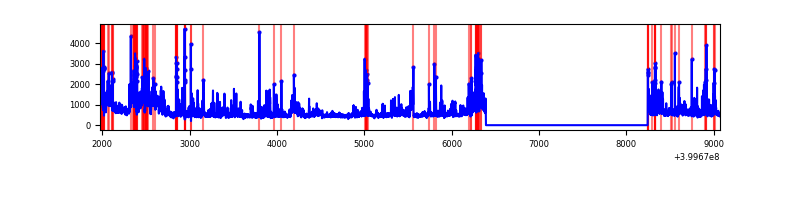 |
Top three noisy pixels from each quadrant. If the there are fewer than three noisy pixels in the level2.evt file, extra rows are filled as -1
| Pixel properties | Quadrant properties | ||||||
|---|---|---|---|---|---|---|---|
| Quadrant | DetID | PixID | Counts | Sigma | Mean | Median | Sigma |
| A | 15 | 222 | 986636 | 8088.74 | 610 | 599 | 121.9 |
| A | 10 | 83 | 271868 | 2225.3 | 610 | 599 | 121.9 |
| A | 9 | 143 | 24599 | 196.88 | 610 | 599 | 121.9 |
| B | 15 | 35 | 511158 | 4512.72 | 600 | 585 | 113.1 |
| B | 0 | 189 | 73475 | 644.24 | 600 | 585 | 113.1 |
| B | 5 | 172 | 73262 | 642.36 | 600 | 585 | 113.1 |
| C | 14 | 254 | 1385806 | 10595.39 | 569 | 574 | 130.7 |
| C | 15 | 214 | 230465 | 1758.39 | 569 | 574 | 130.7 |
| C | 0 | 10 | 208160 | 1587.79 | 569 | 574 | 130.7 |
| D | 12 | 235 | 664576 | 4692.13 | 586 | 570 | 141.5 |
| D | 2 | 249 | 182555 | 1285.98 | 586 | 570 | 141.5 |
| D | 2 | 152 | 157191 | 1106.75 | 586 | 570 | 141.5 |
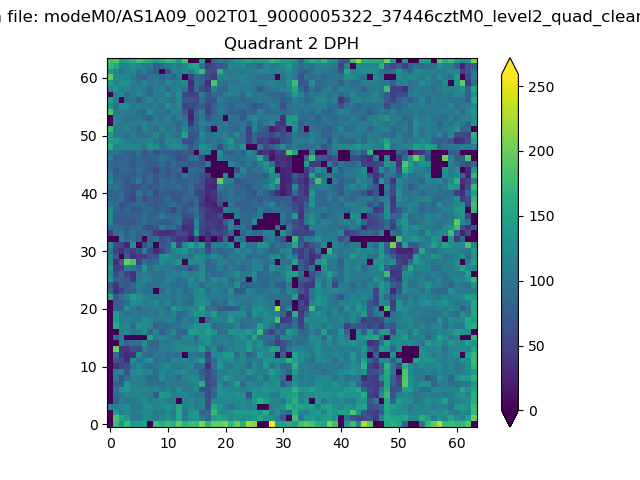
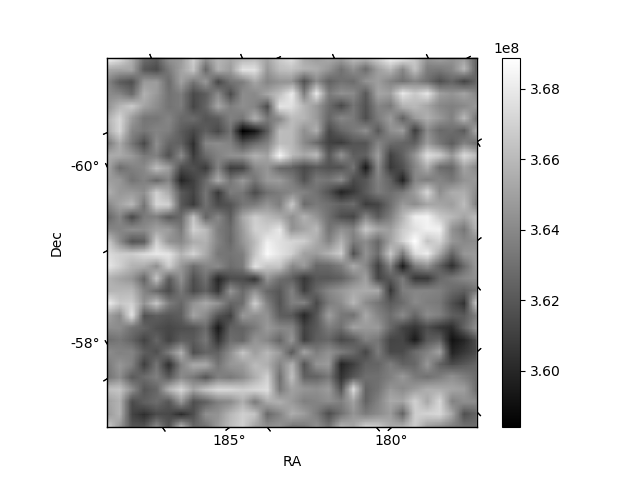
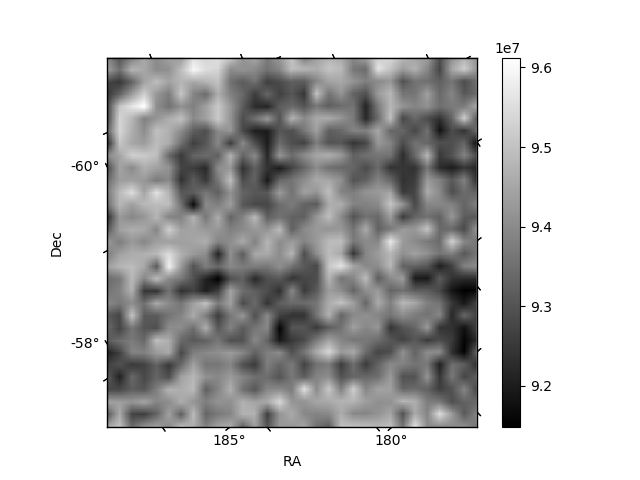
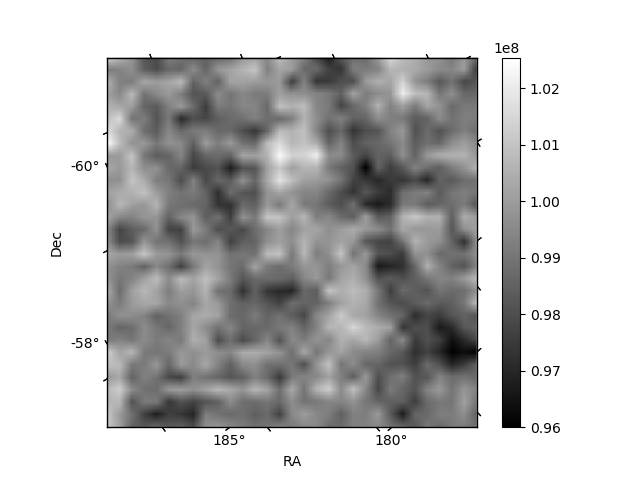
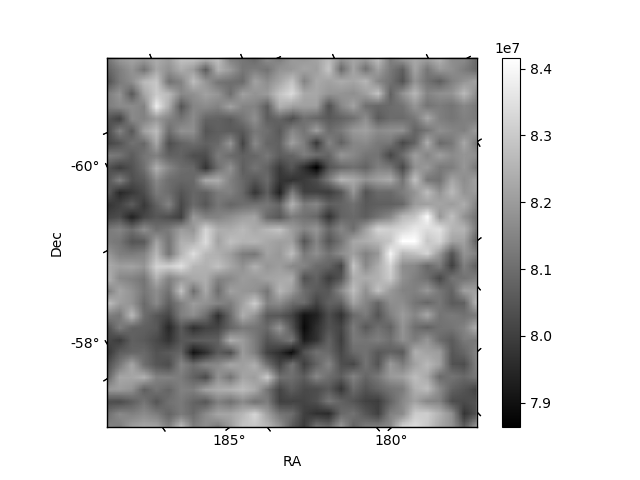
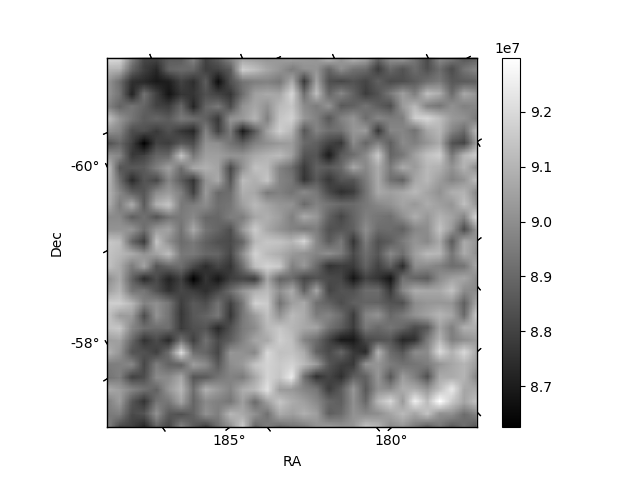
Histogram calculated using DETX and DETY for each event in the final _common_clean file
| Quadrant A | 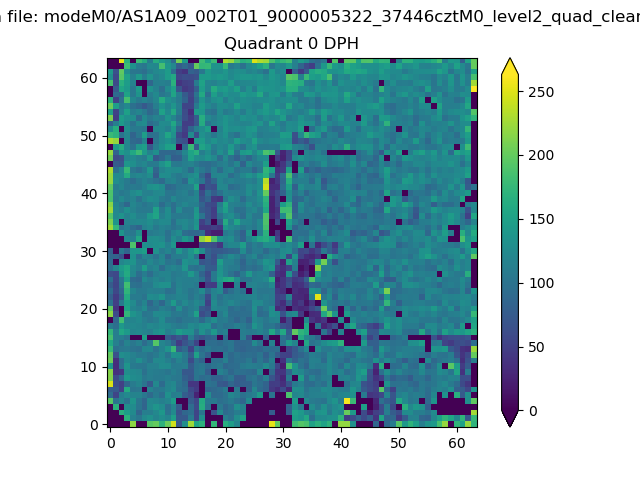 |
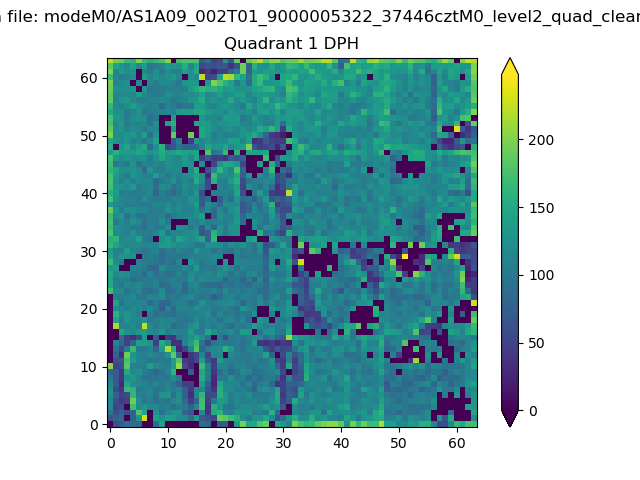 |
Quadrant B |
|---|---|---|---|
| Quadrant D | 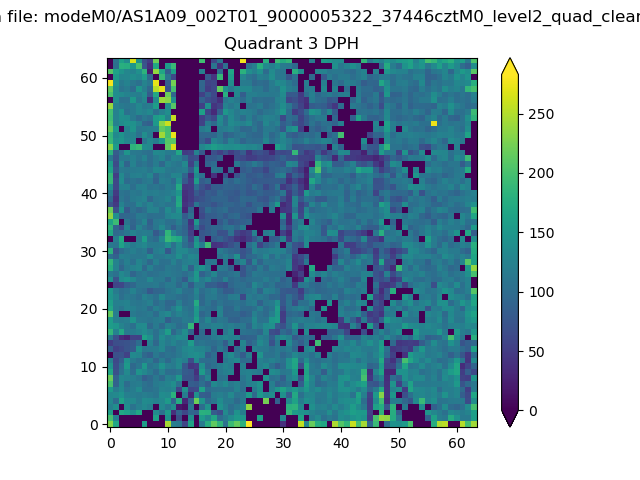 |
 |
Quadrant C |
| Plot type | Count rate plots | Images |
|---|---|---|
| Comparison with Poisson distribution Blue bars denote a histogram of data divided into 1 sec bins. Red curve is a Poisson curve with rate = median count rate of data. |
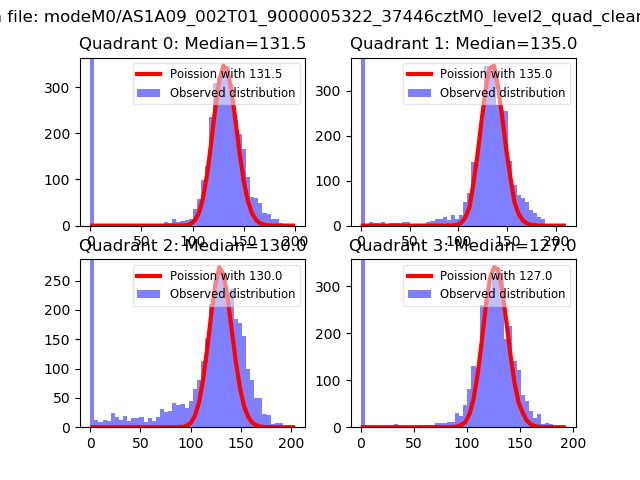 |
 |
| Quadrant-wise count rates Data is divided into 100 sec bins |
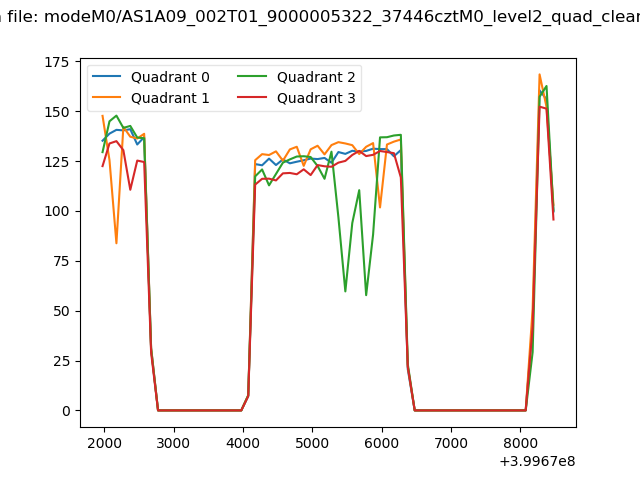 |
|
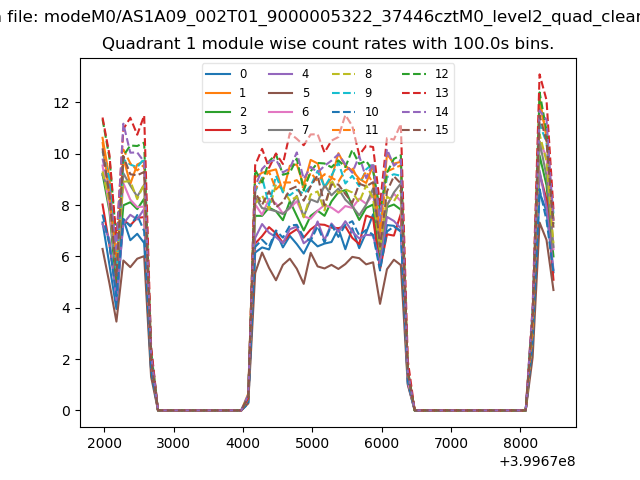
| Module-wise count rates for Quadrant A Data is divided into 100 sec bins |
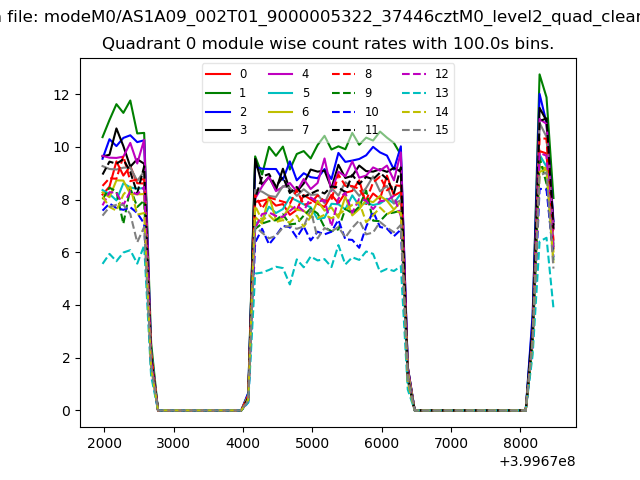 |
 |
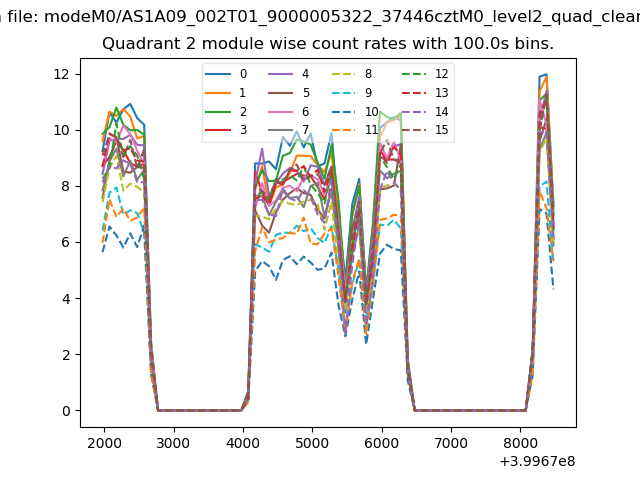
| Module-wise count rates for Quadrant B Data is divided into 100 sec bins |
 |
 |
| Module-wise count rates for Quadrant C Data is divided into 100 sec bins |
 |
 |
| Module-wise count rates for Quadrant D Data is divided into 100 sec bins |
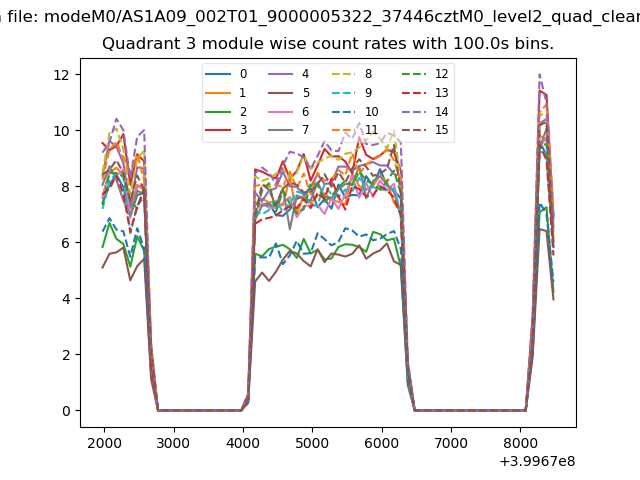 |
 |
| Parameter | Plot |
|---|---|
| CZT HV Monitor |  |
| D_VDD | 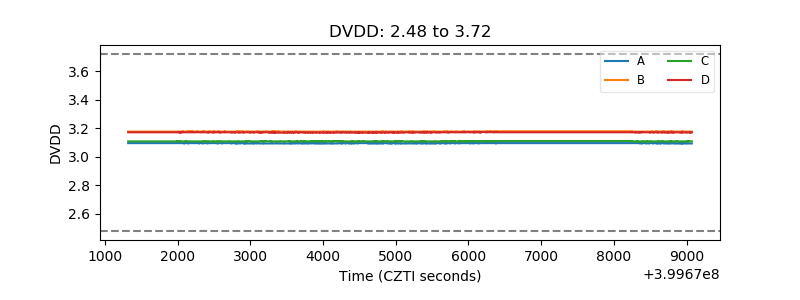 |
| Temperature 1 | 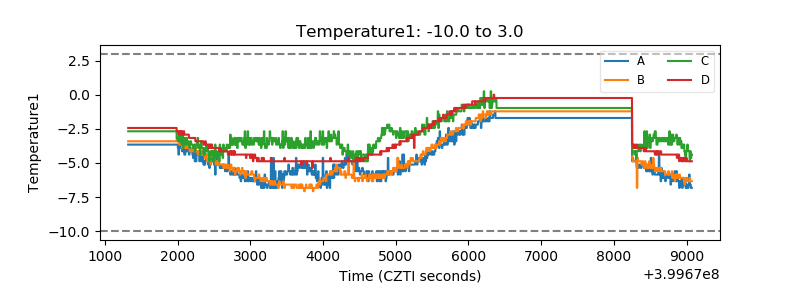 |
| Veto HV Monitor | 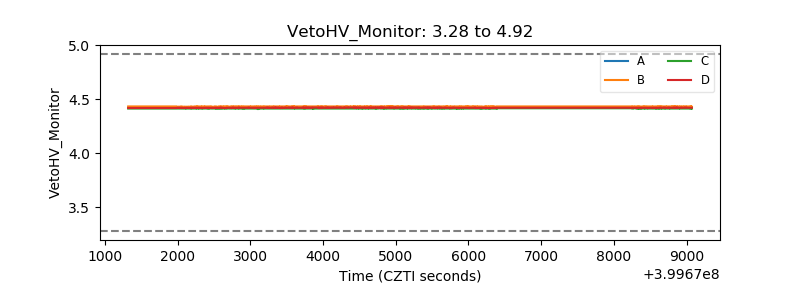 |
| Veto LLD | 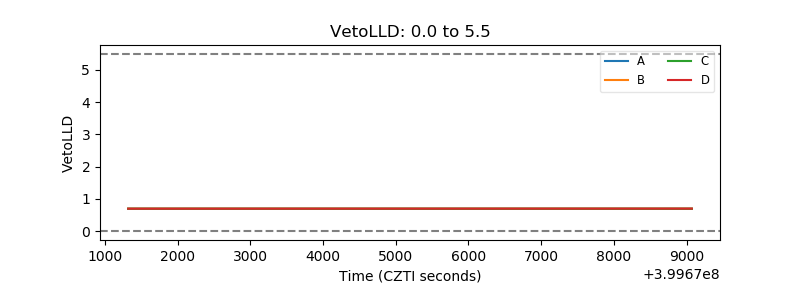 |
| Alpha Counter | 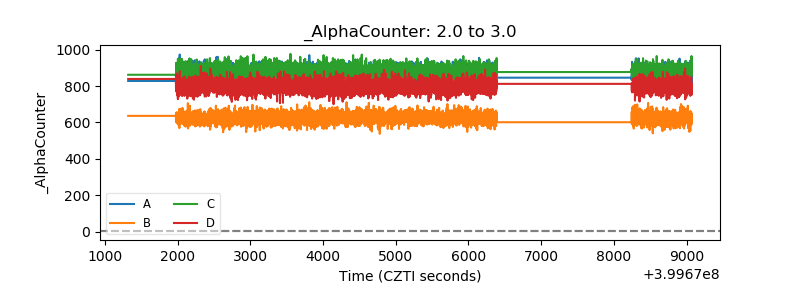 |
| _CPM_Rate | 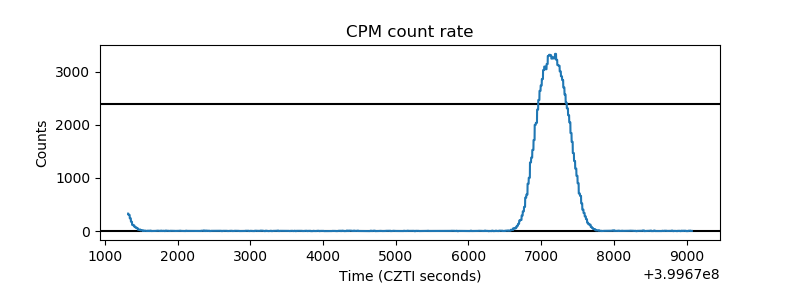 |
| CZT Counter | 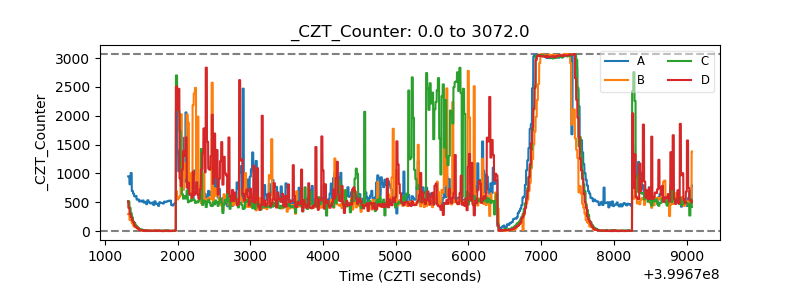 |
| +2.5 Volts monitor | 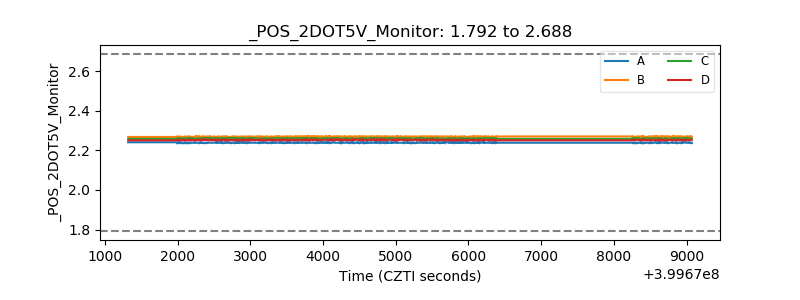 |
| +5 Volts monitor | 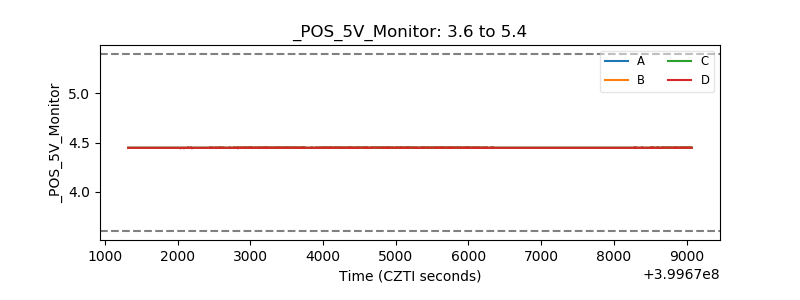 |
| _ROLL_ROT | 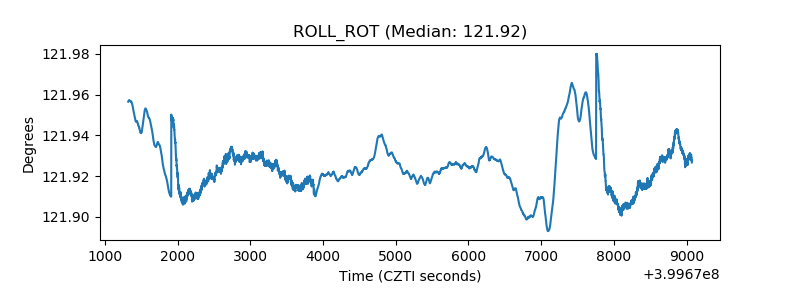 |
| _Roll_DEC | 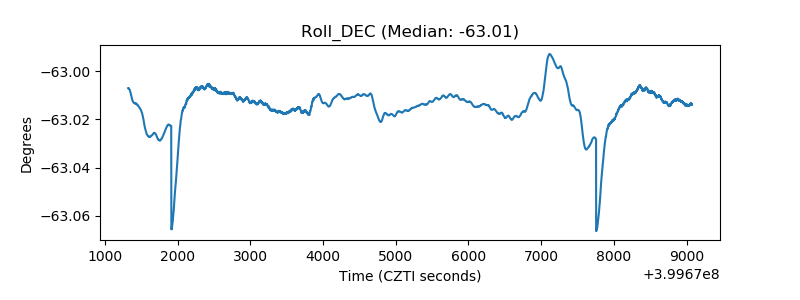 |
| _Roll_RA | 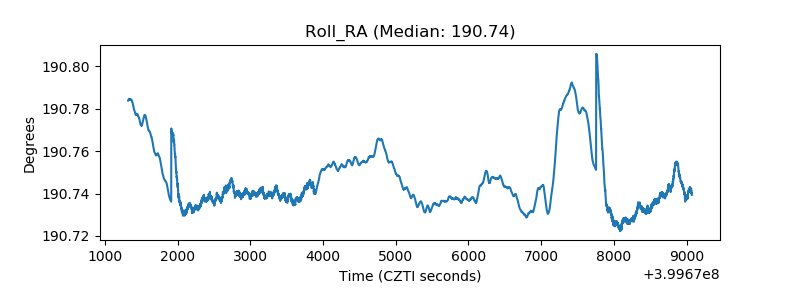 |
| Veto Counter |  |