| Param | Original file | Final file |
|---|---|---|
| Filename | modeM0/AS1A09_002T01_9000005322_37447cztM0_level2.evt | modeM0/AS1A09_002T01_9000005322_37447cztM0_level2_quad_clean.evt |
| Size (bytes) | 432,956,160 | 62,196,480 |
| Size | 412.9 MB | 59.3 MB |
| Events in quadrant A | 3,278,919 | 383,844 |
| Events in quadrant B | 2,715,926 | 396,099 |
| Events in quadrant C | 3,076,809 | 384,603 |
| Events in quadrant D | 3,697,359 | 364,135 |
| Mode M0 | |||
|---|---|---|---|
| Quadrant | BADHDUFLAG | Total packets | Discarded packets |
| A | 0 | 12878 | 3 |
| B | 0 | 11088 | 2 |
| C | 0 | 12020 | 2 |
| D | 0 | 14367 | 2 |
| Mode M9 | |||
|---|---|---|---|
| Quadrant | BADHDUFLAG | Total packets | Discarded packets |
| A | 0 | 31 | 0 |
| B | 0 | 31 | 0 |
| C | 0 | 31 | 0 |
| D | 0 | 32 | 0 |
| Mode SS | |||
|---|---|---|---|
| Quadrant | BADHDUFLAG | Total packets | Discarded packets |
| A | 0 | 104 | 0 |
| B | 0 | 104 | 0 |
| C | 0 | 104 | 0 |
| D | 0 | 104 | 0 |
| Quadrant | Total seconds | Saturated seconds | Saturation percentage |
|---|---|---|---|
| A | 5053 | 48 | 0.949931% |
| B | 5053 | 38 | 0.752028% |
| C | 5053 | 119 | 2.355037% |
| D | 5053 | 180 | 3.562240% |
Noise dominated data is calculated using 1-second bins in cleaned event files. If a bin has >2000 counts, and if more than 50% of those come from <1% of pixels, then it is considered to be noise-dominated and hence unusable.
| Quadrant | # 1 sec bins | Bins with >0 counts | Bins with >2000 counts | High rate bins dominated by noise | Noise dominated (total time) | Noise dominated (detector-on time) | Marked lightcurve |
|---|---|---|---|---|---|---|---|
| A | 7025 | 5054 | 17 | 17 | 0.24% | 0.34% | 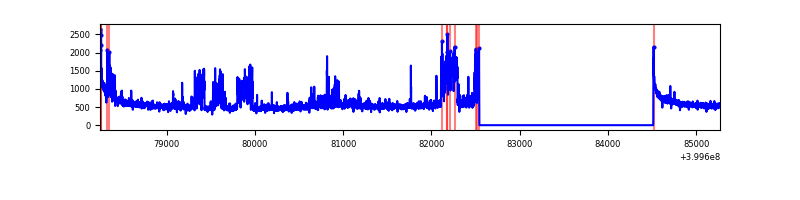 |
| B | 7025 | 5054 | 21 | 21 | 0.30% | 0.42% |  |
| C | 7025 | 5054 | 98 | 98 | 1.40% | 1.94% | 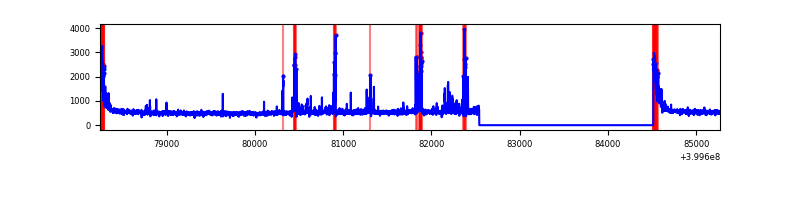 |
| D | 7025 | 5054 | 152 | 152 | 2.16% | 3.01% | 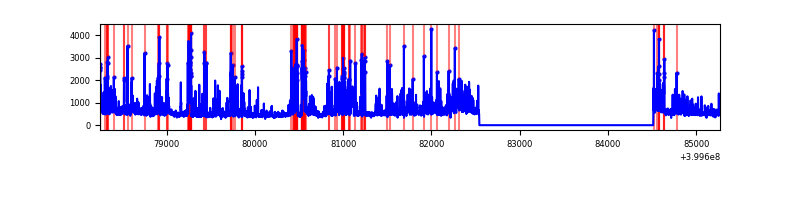 |
Top three noisy pixels from each quadrant. If the there are fewer than three noisy pixels in the level2.evt file, extra rows are filled as -1
| Pixel properties | Quadrant properties | ||||||
|---|---|---|---|---|---|---|---|
| Quadrant | DetID | PixID | Counts | Sigma | Mean | Median | Sigma |
| A | 15 | 222 | 570602 | 4646.22 | 615 | 605 | 122.7 |
| A | 10 | 83 | 262508 | 2134.85 | 615 | 605 | 122.7 |
| A | 12 | 189 | 25892 | 206.12 | 615 | 605 | 122.7 |
| B | 5 | 184 | 60875 | 530.23 | 614 | 601 | 113.7 |
| B | 5 | 172 | 49897 | 433.66 | 614 | 601 | 113.7 |
| B | 4 | 171 | 41785 | 362.3 | 614 | 601 | 113.7 |
| C | 15 | 214 | 230391 | 1674.12 | 599 | 604 | 137.3 |
| C | 14 | 254 | 229138 | 1664.99 | 599 | 604 | 137.3 |
| C | 0 | 10 | 224482 | 1631.07 | 599 | 604 | 137.3 |
| D | 13 | 249 | 565309 | 3981.35 | 592 | 576 | 141.8 |
| D | 1 | 47 | 343671 | 2418.81 | 592 | 576 | 141.8 |
| D | 2 | 152 | 108604 | 761.59 | 592 | 576 | 141.8 |
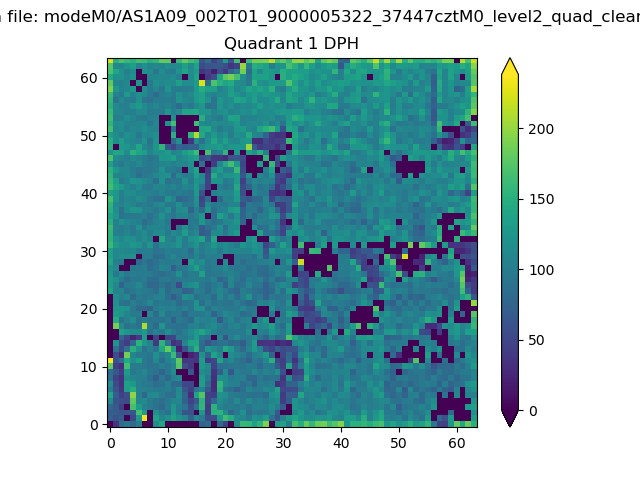
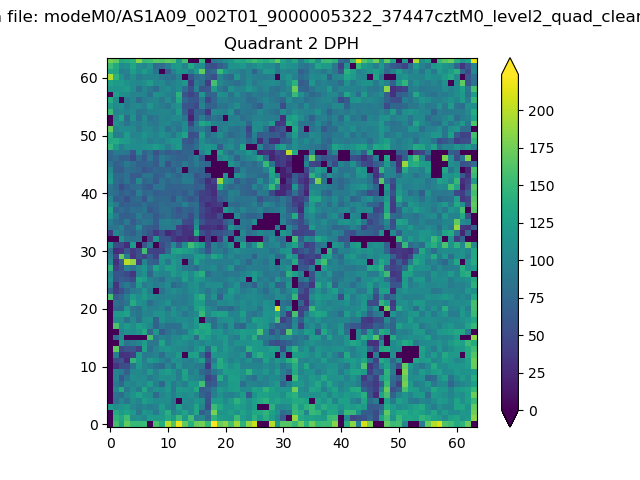
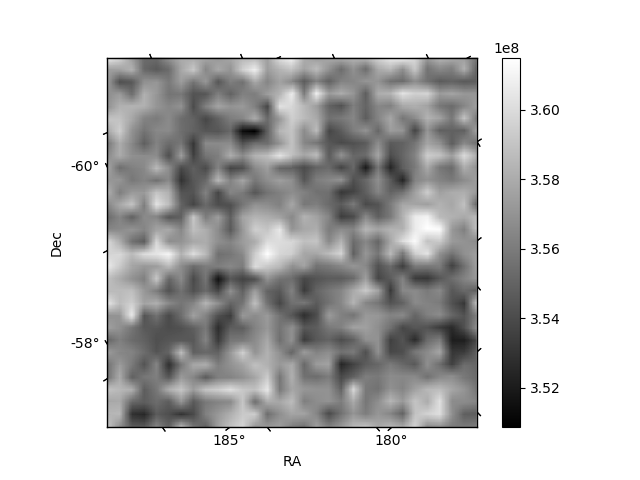
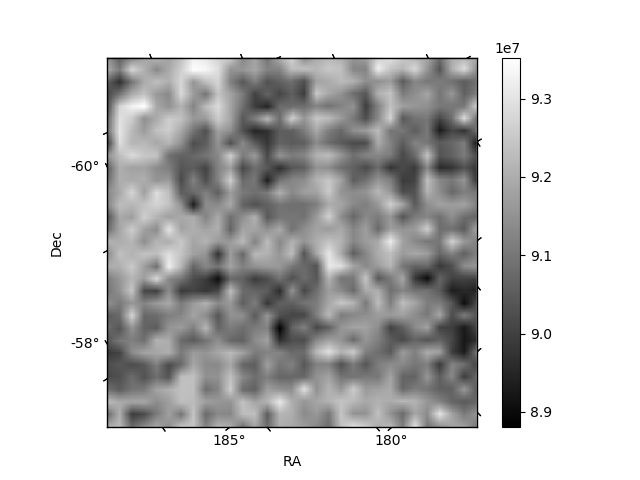
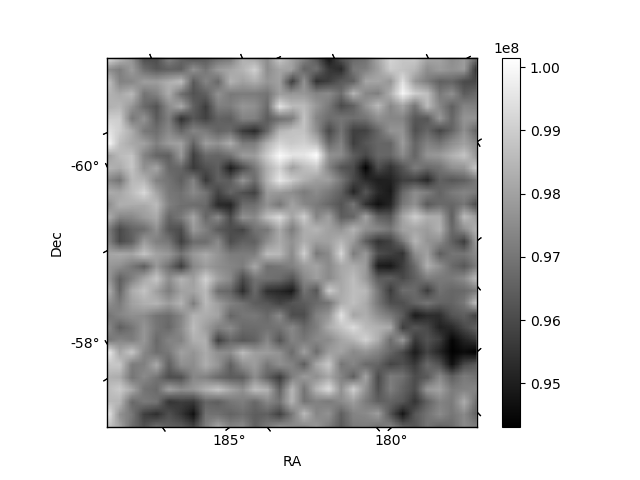
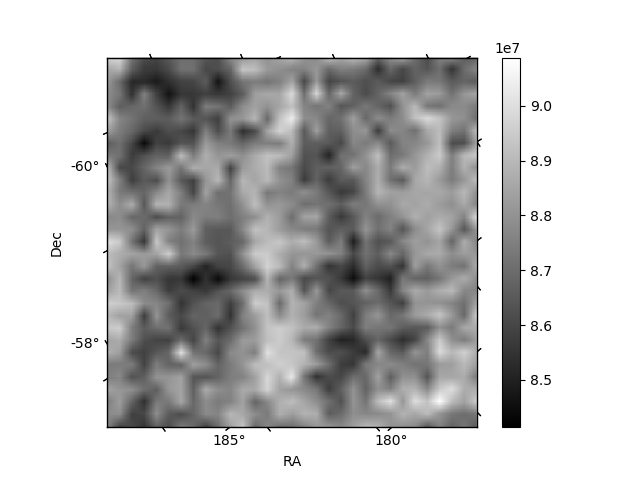
Histogram calculated using DETX and DETY for each event in the final _common_clean file
| Quadrant A | 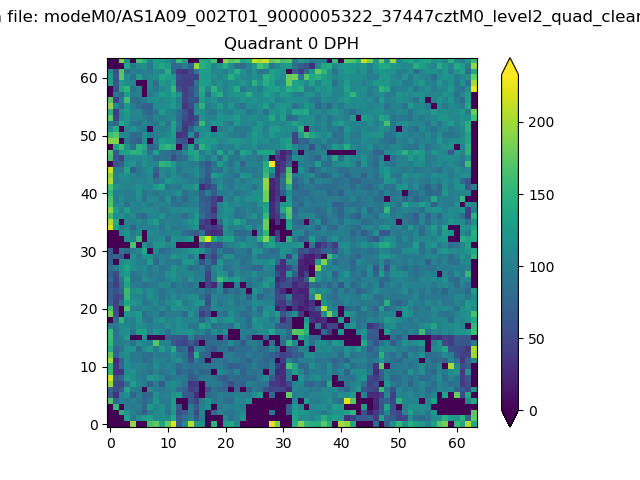 |
 |
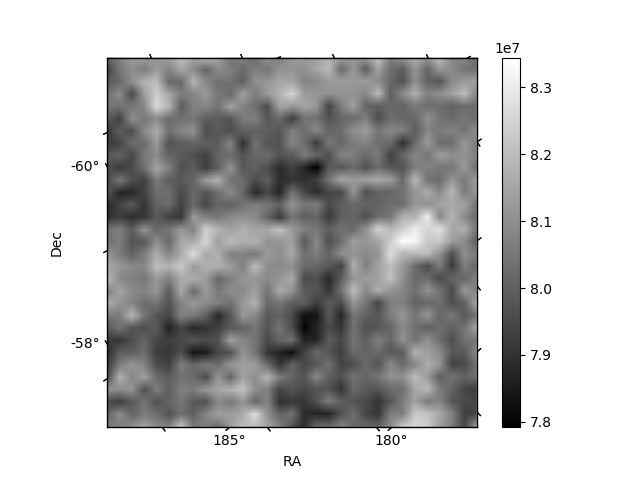
Quadrant B |
|---|---|---|---|
| Quadrant D | 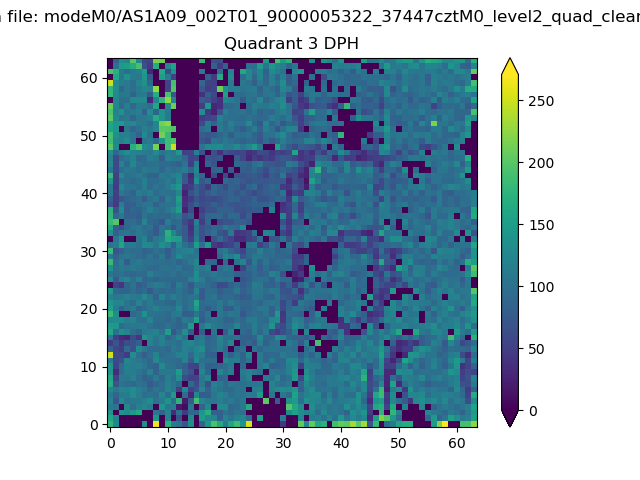 |
 |
Quadrant C |
| Plot type | Count rate plots | Images |
|---|---|---|
| Comparison with Poisson distribution Blue bars denote a histogram of data divided into 1 sec bins. Red curve is a Poisson curve with rate = median count rate of data. |
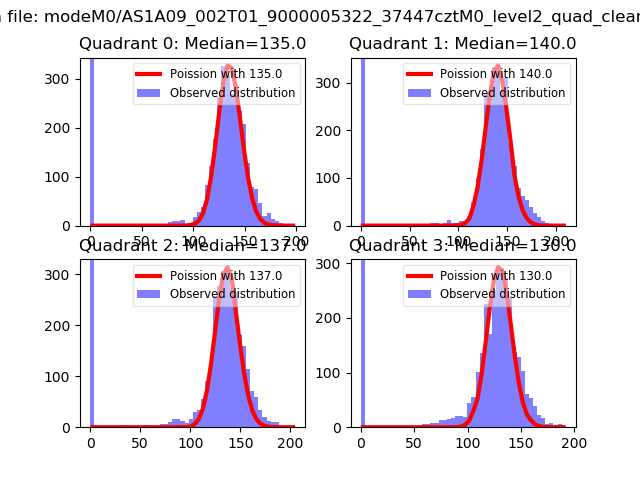 |
 |
| Quadrant-wise count rates Data is divided into 100 sec bins |
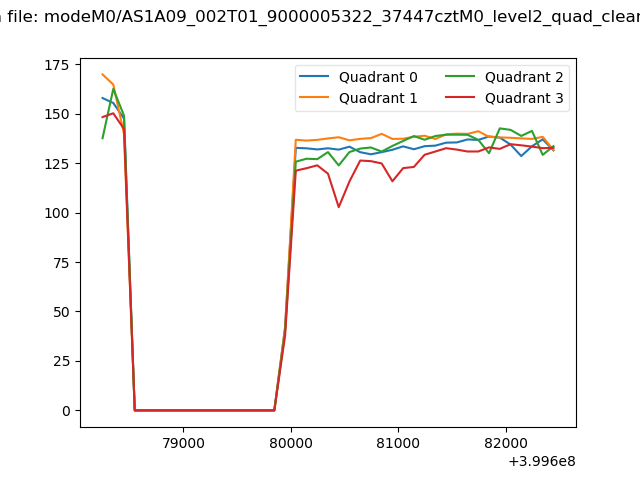 |
|
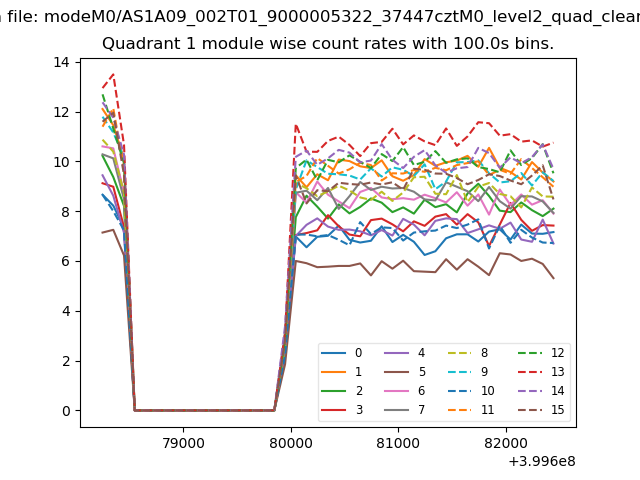
| Module-wise count rates for Quadrant A Data is divided into 100 sec bins |
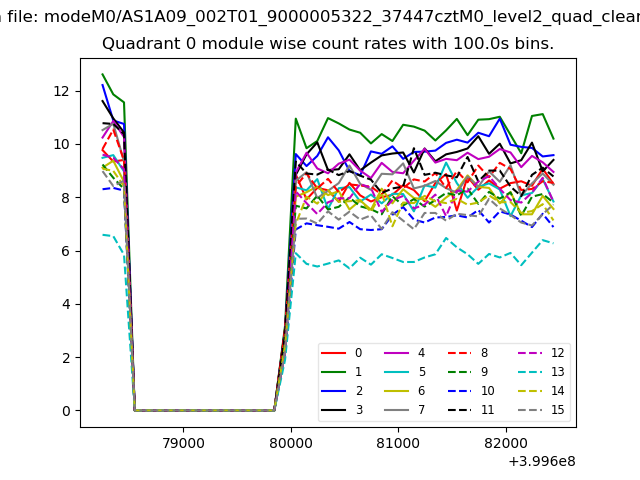 |
 |
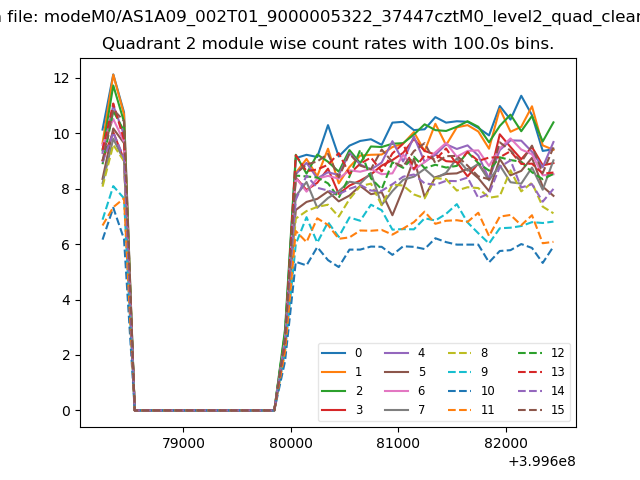
| Module-wise count rates for Quadrant B Data is divided into 100 sec bins |
 |
 |
| Module-wise count rates for Quadrant C Data is divided into 100 sec bins |
 |
 |
| Module-wise count rates for Quadrant D Data is divided into 100 sec bins |
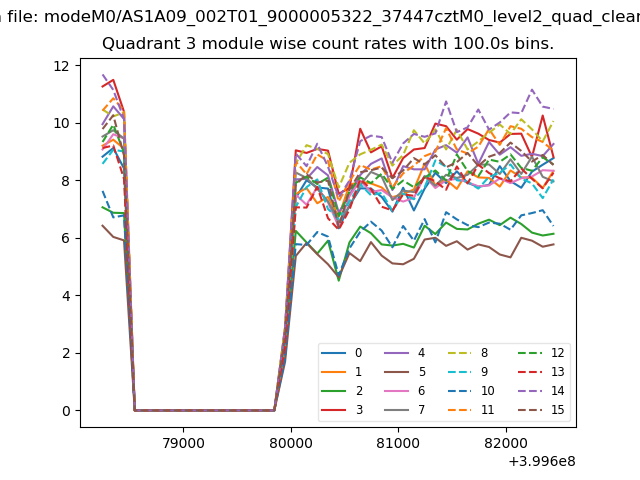 |
 |
| Parameter | Plot |
|---|---|
| CZT HV Monitor | 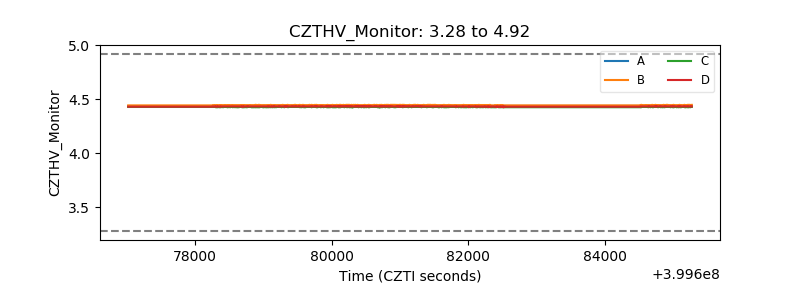 |
| D_VDD | 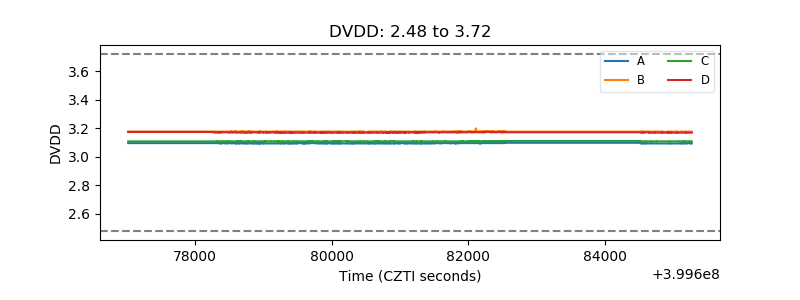 |
| Temperature 1 | 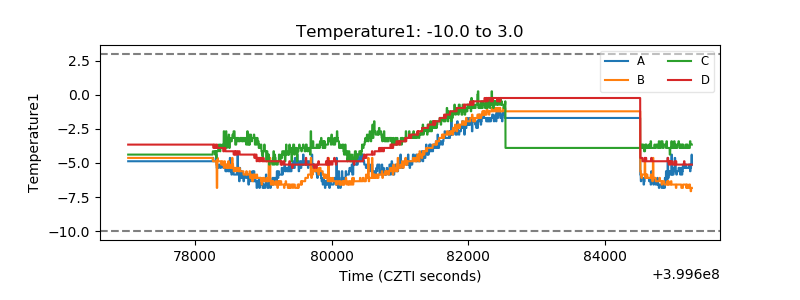 |
| Veto HV Monitor | 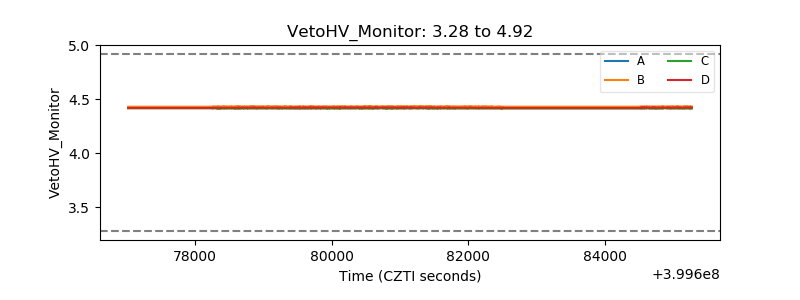 |
| Veto LLD | 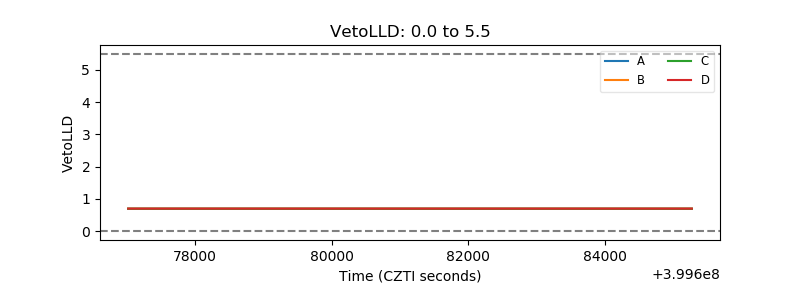 |
| Alpha Counter | 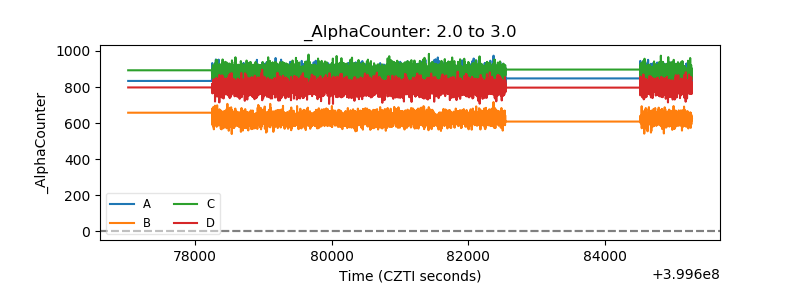 |
| _CPM_Rate | 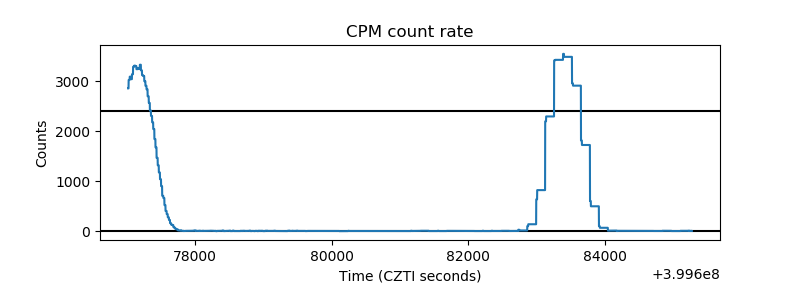 |
| CZT Counter | 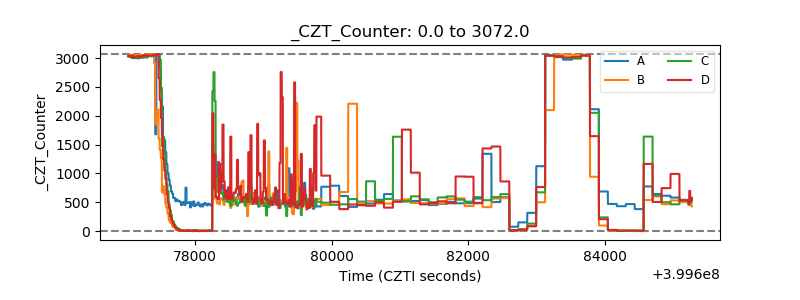 |
| +2.5 Volts monitor | 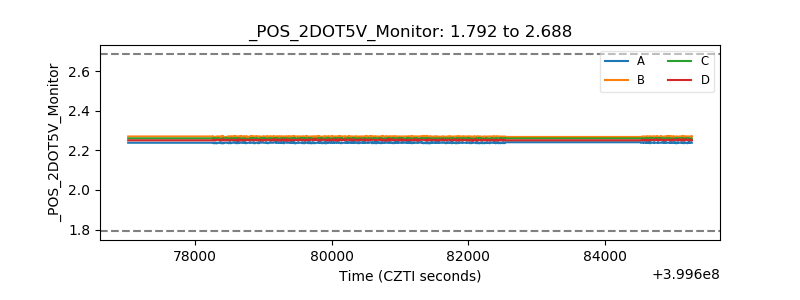 |
| +5 Volts monitor | 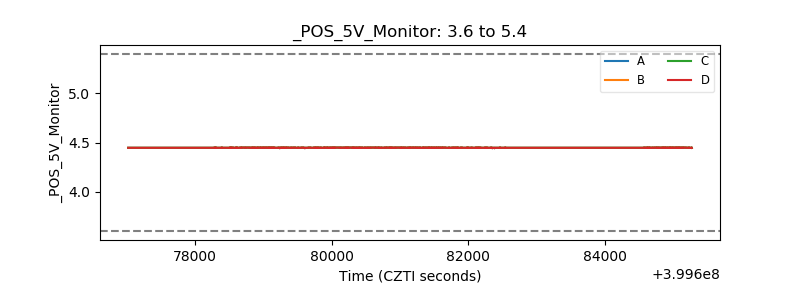 |
| _ROLL_ROT | 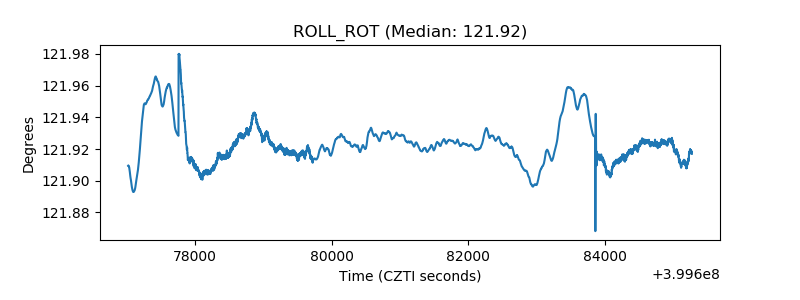 |
| _Roll_DEC | 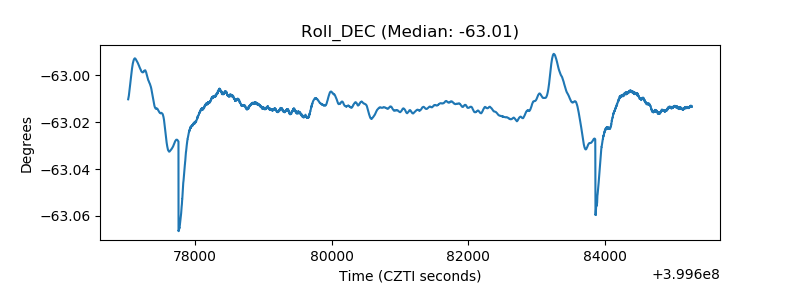 |
| _Roll_RA | 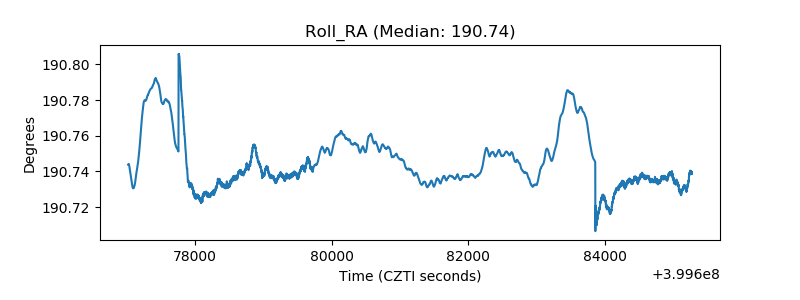 |
| Veto Counter | 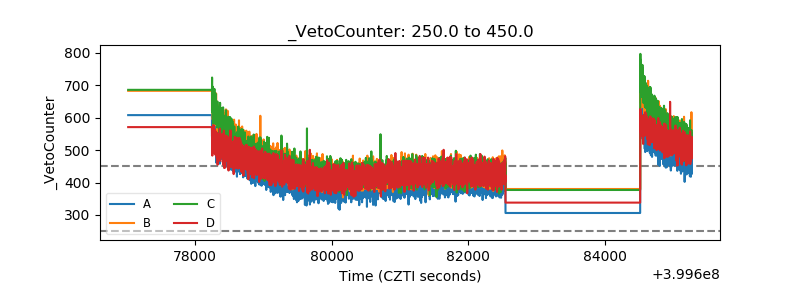 |