| Param | Original file | Final file |
|---|---|---|
| Filename | modeM0/AS1A09_002T01_9000005322_37448cztM0_level2.evt | modeM0/AS1A09_002T01_9000005322_37448cztM0_level2_quad_clean.evt |
| Size (bytes) | 474,647,040 | 62,962,560 |
| Size | 452.7 MB | 60.0 MB |
| Events in quadrant A | 2,975,526 | 393,920 |
| Events in quadrant B | 3,506,098 | 396,058 |
| Events in quadrant C | 3,729,660 | 402,604 |
| Events in quadrant D | 3,828,183 | 366,717 |
| Mode M0 | |||
|---|---|---|---|
| Quadrant | BADHDUFLAG | Total packets | Discarded packets |
| A | 0 | 11718 | 3 |
| B | 0 | 13418 | 2 |
| C | 0 | 13917 | 2 |
| D | 0 | 14641 | 2 |
| Mode M9 | |||
|---|---|---|---|
| Quadrant | BADHDUFLAG | Total packets | Discarded packets |
| A | 0 | 35 | 0 |
| B | 0 | 35 | 0 |
| C | 0 | 35 | 0 |
| D | 0 | 36 | 0 |
| Mode SS | |||
|---|---|---|---|
| Quadrant | BADHDUFLAG | Total packets | Discarded packets |
| A | 0 | 102 | 0 |
| B | 0 | 102 | 0 |
| C | 0 | 102 | 0 |
| D | 0 | 102 | 0 |
| Quadrant | Total seconds | Saturated seconds | Saturation percentage |
|---|---|---|---|
| A | 4942 | 40 | 0.809389% |
| B | 4942 | 260 | 5.261028% |
| C | 4942 | 352 | 7.122622% |
| D | 4942 | 255 | 5.159854% |
Noise dominated data is calculated using 1-second bins in cleaned event files. If a bin has >2000 counts, and if more than 50% of those come from <1% of pixels, then it is considered to be noise-dominated and hence unusable.
| Quadrant | # 1 sec bins | Bins with >0 counts | Bins with >2000 counts | High rate bins dominated by noise | Noise dominated (total time) | Noise dominated (detector-on time) | Marked lightcurve |
|---|---|---|---|---|---|---|---|
| A | 7034 | 4943 | 35 | 35 | 0.50% | 0.71% | 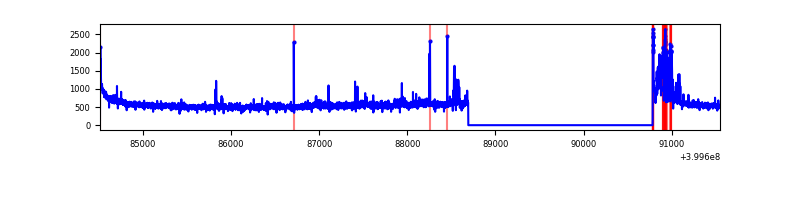 |
| B | 7034 | 4943 | 143 | 143 | 2.03% | 2.89% | 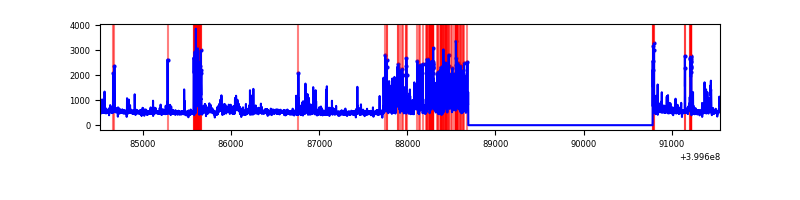 |
| C | 7034 | 4943 | 329 | 329 | 4.68% | 6.66% | 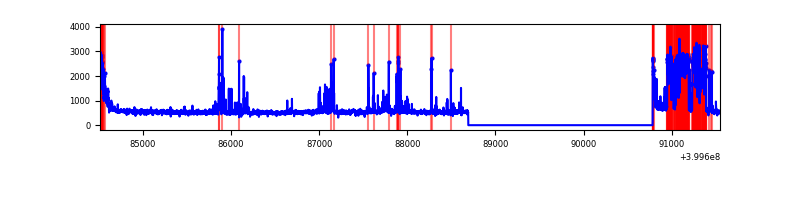 |
| D | 7034 | 4943 | 225 | 225 | 3.20% | 4.55% | 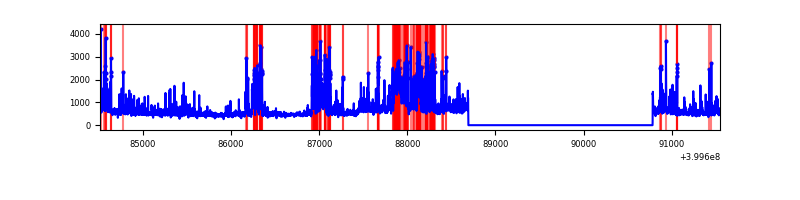 |
Top three noisy pixels from each quadrant. If the there are fewer than three noisy pixels in the level2.evt file, extra rows are filled as -1
| Pixel properties | Quadrant properties | ||||||
|---|---|---|---|---|---|---|---|
| Quadrant | DetID | PixID | Counts | Sigma | Mean | Median | Sigma |
| A | 15 | 222 | 272290 | 2238.38 | 615 | 605 | 121.4 |
| A | 10 | 83 | 262427 | 2157.12 | 615 | 605 | 121.4 |
| A | 6 | 10 | 27894 | 224.83 | 615 | 605 | 121.4 |
| B | 4 | 171 | 733595 | 6500.85 | 607 | 594 | 112.8 |
| B | 0 | 189 | 127111 | 1122.06 | 607 | 594 | 112.8 |
| B | 15 | 35 | 97203 | 856.81 | 607 | 594 | 112.8 |
| C | 14 | 254 | 933068 | 6954.02 | 591 | 598 | 134.1 |
| C | 15 | 214 | 219962 | 1635.94 | 591 | 598 | 134.1 |
| C | 0 | 10 | 163012 | 1211.22 | 591 | 598 | 134.1 |
| D | 2 | 249 | 538827 | 3811.26 | 594 | 580 | 141.2 |
| D | 13 | 249 | 516309 | 3651.81 | 594 | 580 | 141.2 |
| D | 12 | 235 | 81377 | 572.11 | 594 | 580 | 141.2 |
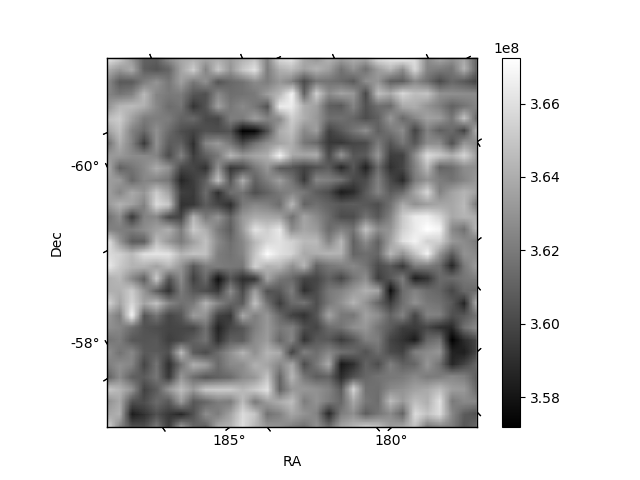
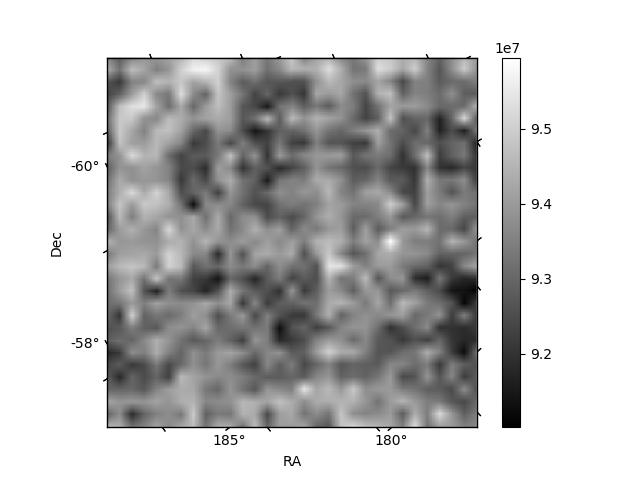
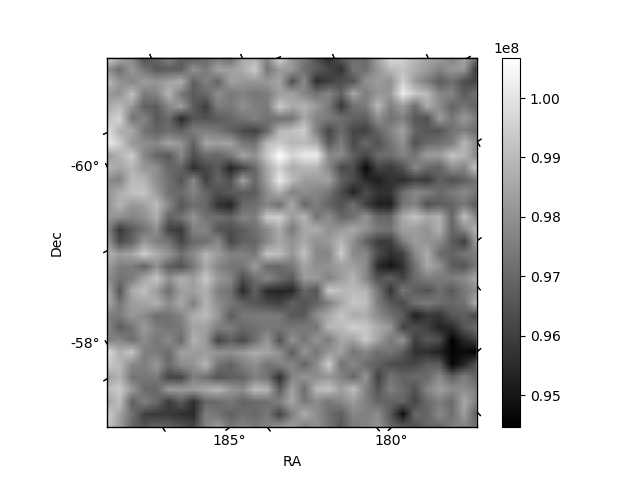
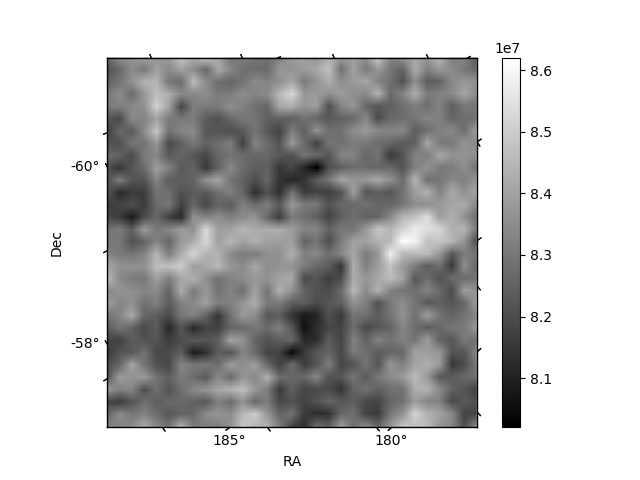
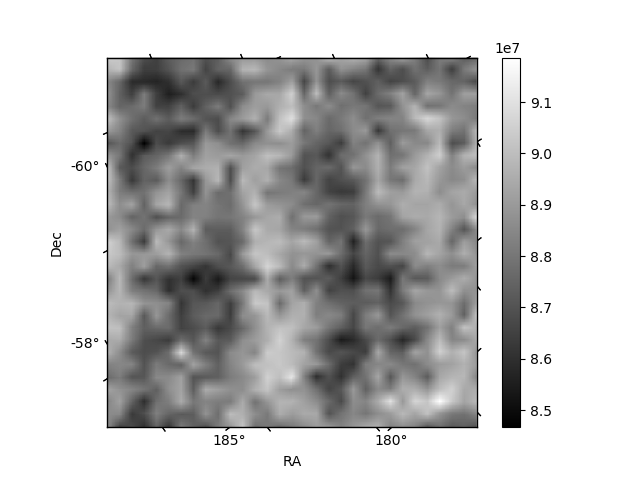
Histogram calculated using DETX and DETY for each event in the final _common_clean file
| Quadrant A | 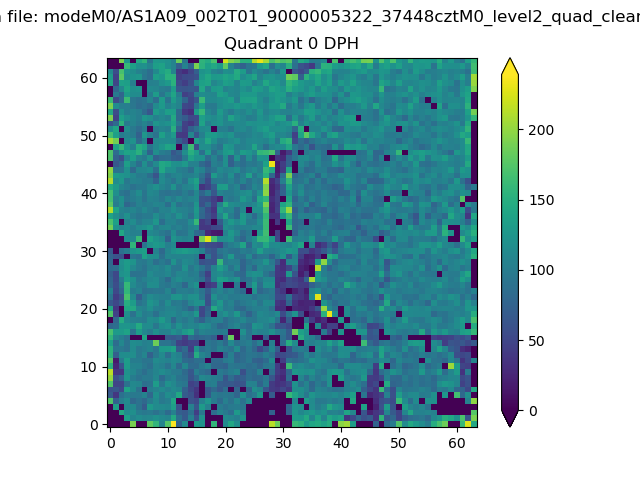 |
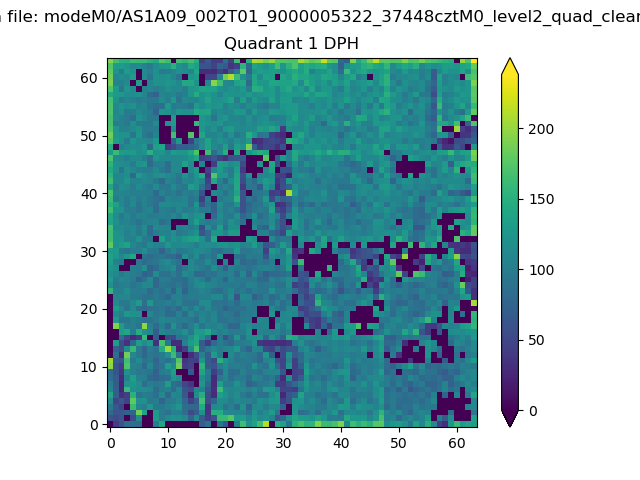 |
Quadrant B |
|---|---|---|---|
| Quadrant D | 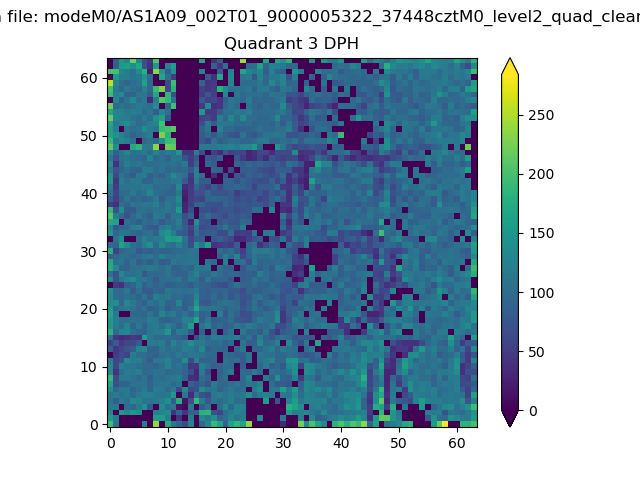 |
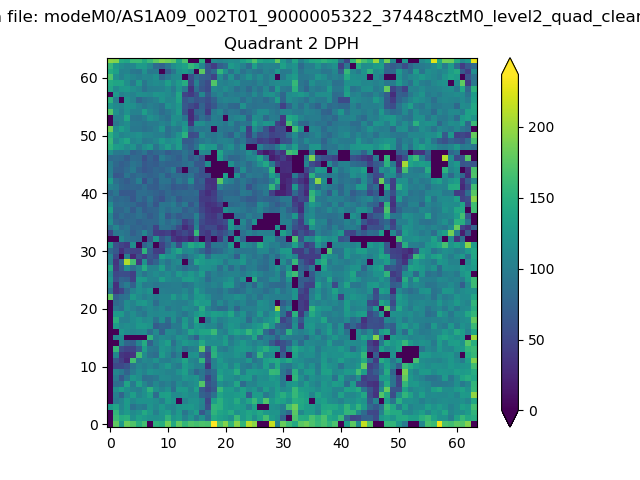 |
Quadrant C |
| Plot type | Count rate plots | Images |
|---|---|---|
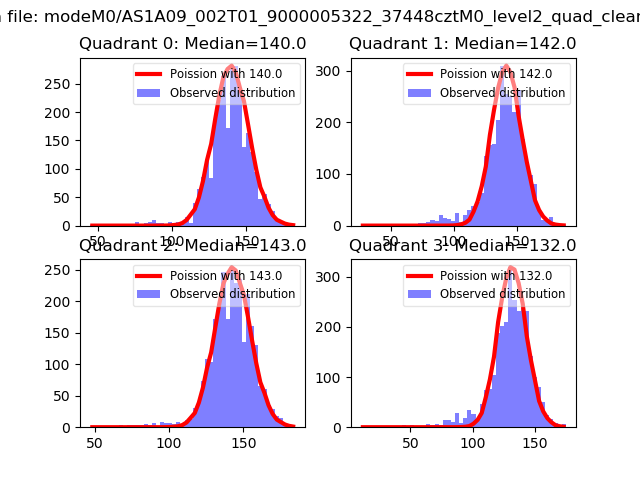
| Comparison with Poisson distribution Blue bars denote a histogram of data divided into 1 sec bins. Red curve is a Poisson curve with rate = median count rate of data. |
 |
 |
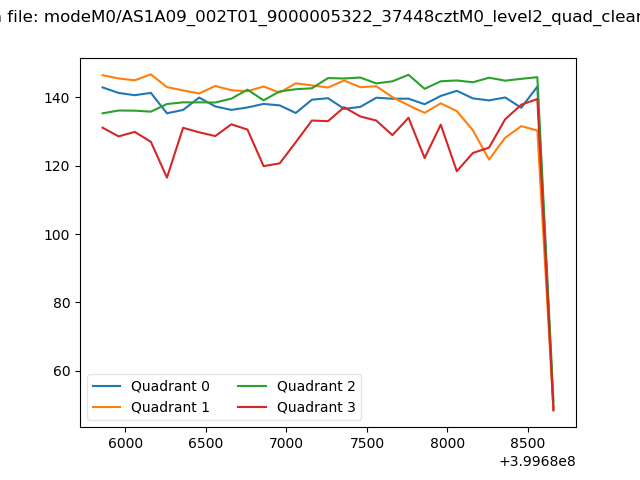
| Quadrant-wise count rates Data is divided into 100 sec bins |
 |
|
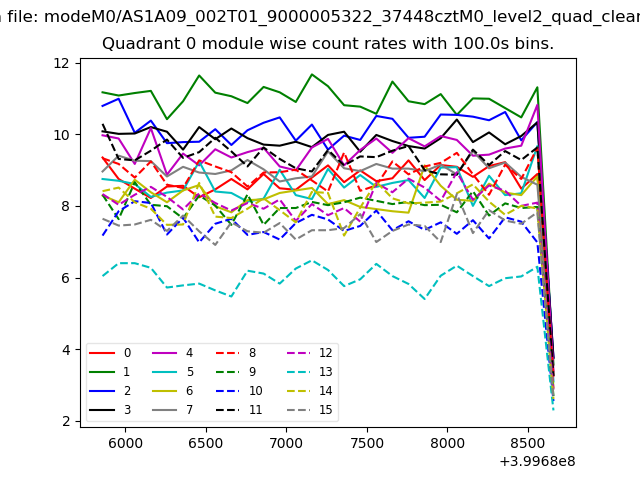
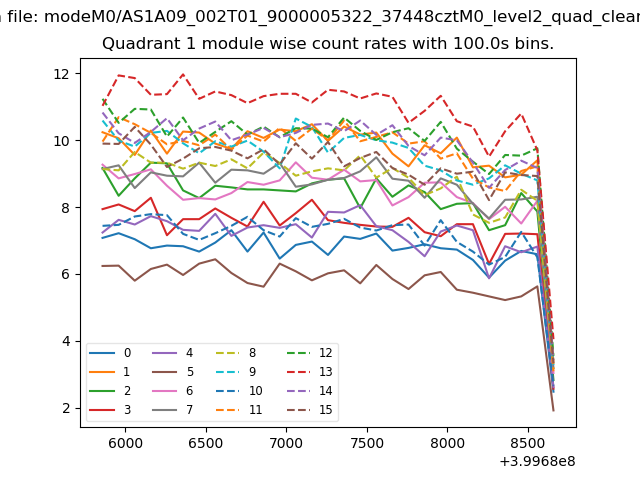
| Module-wise count rates for Quadrant A Data is divided into 100 sec bins |
 |
 |
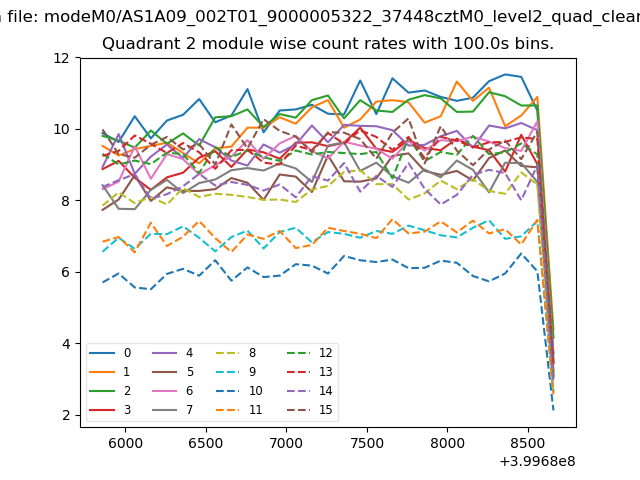
| Module-wise count rates for Quadrant B Data is divided into 100 sec bins |
 |
 |
| Module-wise count rates for Quadrant C Data is divided into 100 sec bins |
 |
 |
| Module-wise count rates for Quadrant D Data is divided into 100 sec bins |
 |
 |
| Parameter | Plot |
|---|---|
| CZT HV Monitor | 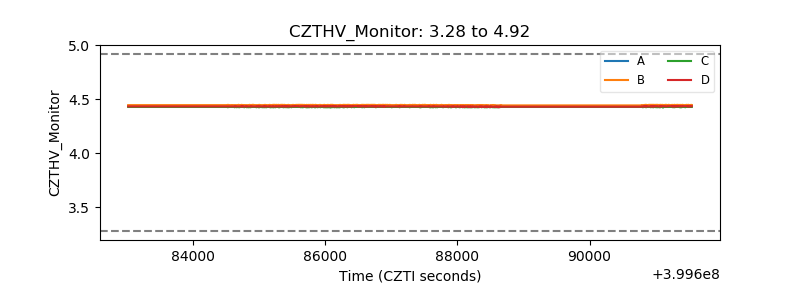 |
| D_VDD | 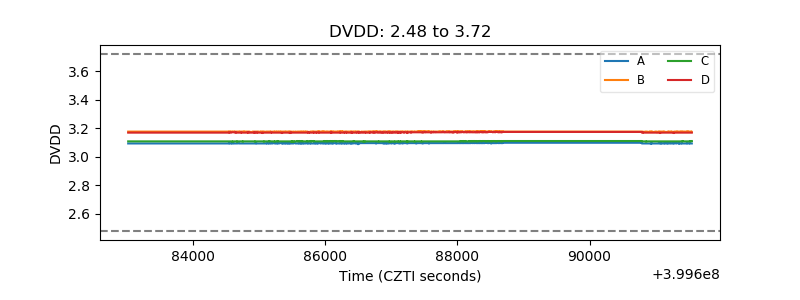 |
| Temperature 1 | 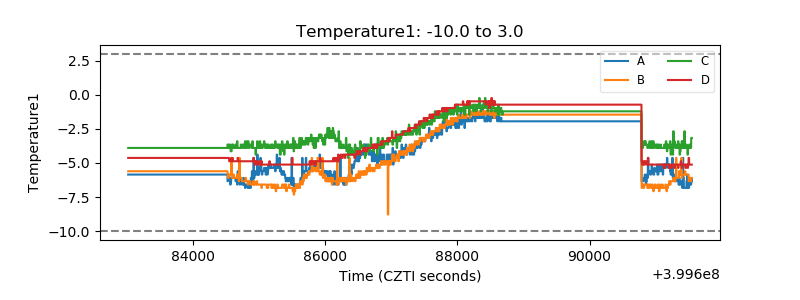 |
| Veto HV Monitor | 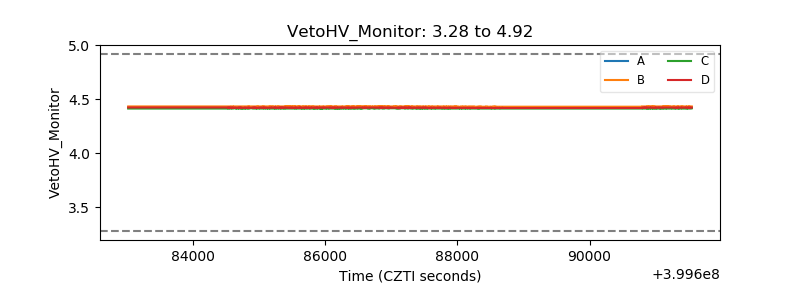 |
| Veto LLD | 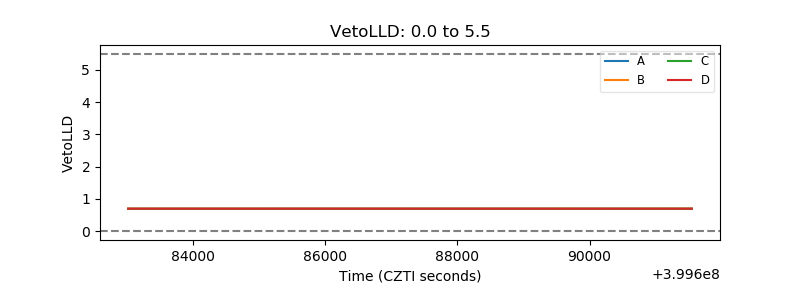 |
| Alpha Counter | 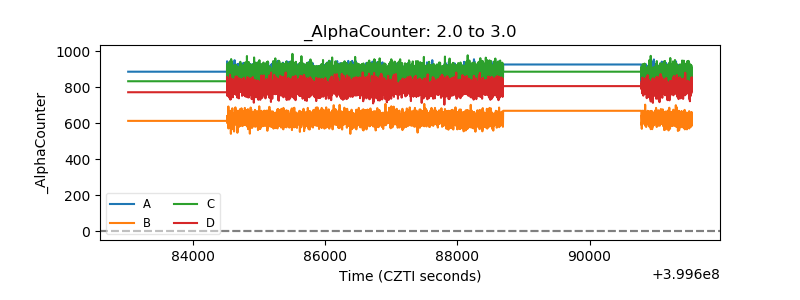 |
| _CPM_Rate | 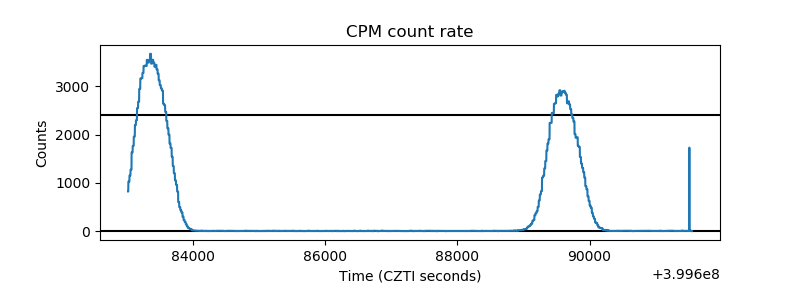 |
| CZT Counter | 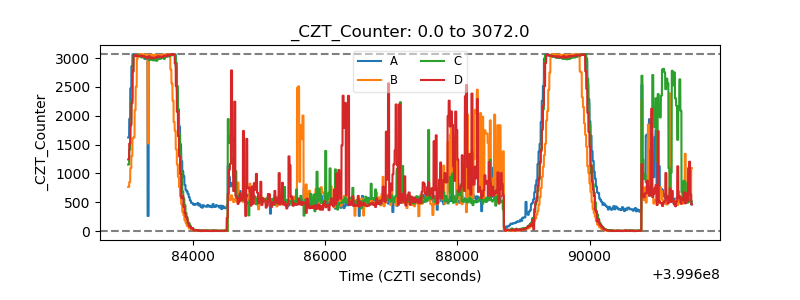 |
| +2.5 Volts monitor | 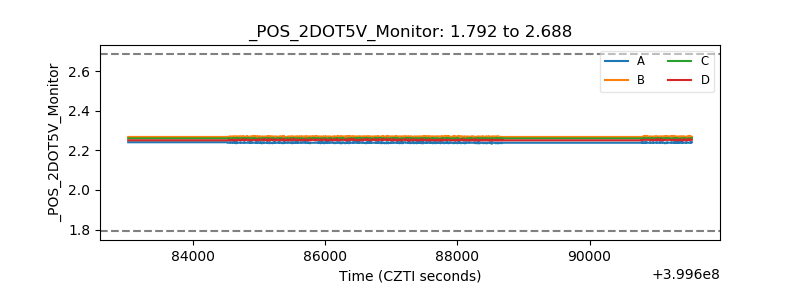 |
| +5 Volts monitor | 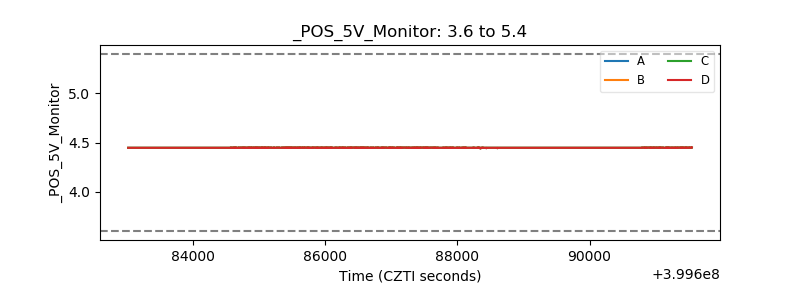 |
| _ROLL_ROT |  |
| _Roll_DEC | 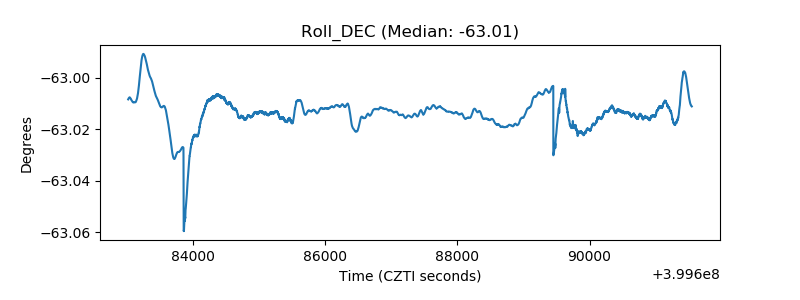 |
| _Roll_RA | 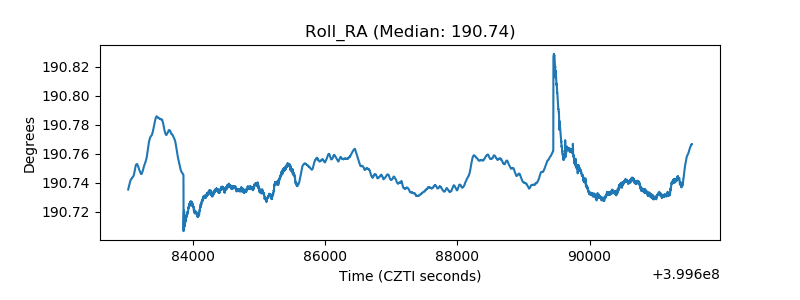 |
| Veto Counter | 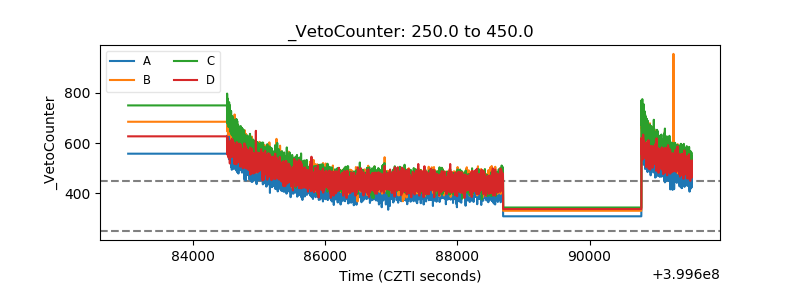 |