| Param | Original file | Final file |
|---|---|---|
| Filename | modeM0/AS1A09_002T01_9000005322_37449cztM0_level2.evt | modeM0/AS1A09_002T01_9000005322_37449cztM0_level2_quad_clean.evt |
| Size (bytes) | 476,928,000 | 76,432,320 |
| Size | 454.8 MB | 72.9 MB |
| Events in quadrant A | 2,956,537 | 501,653 |
| Events in quadrant B | 3,660,960 | 487,240 |
| Events in quadrant C | 3,995,482 | 506,867 |
| Events in quadrant D | 3,493,512 | 469,909 |
| Mode M0 | |||
|---|---|---|---|
| Quadrant | BADHDUFLAG | Total packets | Discarded packets |
| A | 0 | 11615 | 3 |
| B | 0 | 13965 | 2 |
| C | 0 | 14860 | 2 |
| D | 0 | 13449 | 2 |
| Mode M9 | |||
|---|---|---|---|
| Quadrant | BADHDUFLAG | Total packets | Discarded packets |
| A | 0 | 31 | 0 |
| B | 0 | 31 | 0 |
| C | 0 | 31 | 0 |
| D | 0 | 32 | 0 |
| Mode SS | |||
|---|---|---|---|
| Quadrant | BADHDUFLAG | Total packets | Discarded packets |
| A | 0 | 102 | 0 |
| B | 0 | 102 | 0 |
| C | 0 | 102 | 0 |
| D | 0 | 102 | 0 |
| Quadrant | Total seconds | Saturated seconds | Saturation percentage |
|---|---|---|---|
| A | 4970 | 37 | 0.744467% |
| B | 4970 | 365 | 7.344064% |
| C | 4970 | 426 | 8.571429% |
| D | 4970 | 343 | 6.901408% |
Noise dominated data is calculated using 1-second bins in cleaned event files. If a bin has >2000 counts, and if more than 50% of those come from <1% of pixels, then it is considered to be noise-dominated and hence unusable.
| Quadrant | # 1 sec bins | Bins with >0 counts | Bins with >2000 counts | High rate bins dominated by noise | Noise dominated (total time) | Noise dominated (detector-on time) | Marked lightcurve |
|---|---|---|---|---|---|---|---|
| A | 7092 | 4971 | 32 | 32 | 0.45% | 0.64% | 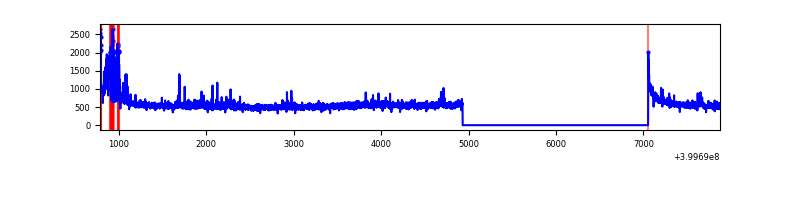 |
| B | 7091 | 4970 | 284 | 284 | 4.01% | 5.71% | 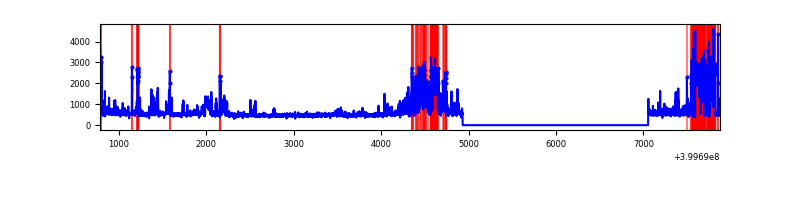 |
| C | 7091 | 4970 | 379 | 379 | 5.34% | 7.63% | 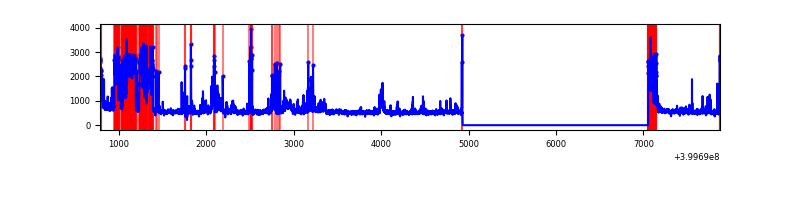 |
| D | 7092 | 4971 | 282 | 282 | 3.98% | 5.67% | 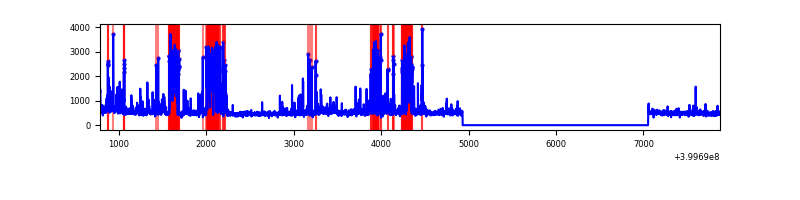 |
Top three noisy pixels from each quadrant. If the there are fewer than three noisy pixels in the level2.evt file, extra rows are filled as -1
| Pixel properties | Quadrant properties | ||||||
|---|---|---|---|---|---|---|---|
| Quadrant | DetID | PixID | Counts | Sigma | Mean | Median | Sigma |
| A | 15 | 222 | 265458 | 2169.67 | 616 | 605 | 122.1 |
| A | 10 | 83 | 257474 | 2104.26 | 616 | 605 | 122.1 |
| A | 6 | 10 | 19131 | 151.76 | 616 | 605 | 122.1 |
| B | 15 | 35 | 698777 | 6287.45 | 594 | 581 | 111.0 |
| B | 5 | 172 | 321965 | 2894.15 | 594 | 581 | 111.0 |
| B | 4 | 171 | 194882 | 1749.73 | 594 | 581 | 111.0 |
| C | 14 | 254 | 1249460 | 9271.69 | 589 | 595 | 134.7 |
| C | 0 | 10 | 220198 | 1630.35 | 589 | 595 | 134.7 |
| C | 15 | 214 | 220013 | 1628.98 | 589 | 595 | 134.7 |
| D | 13 | 249 | 716598 | 5054.32 | 590 | 575 | 141.7 |
| D | 2 | 249 | 311720 | 2196.34 | 590 | 575 | 141.7 |
| D | 2 | 250 | 82055 | 575.16 | 590 | 575 | 141.7 |
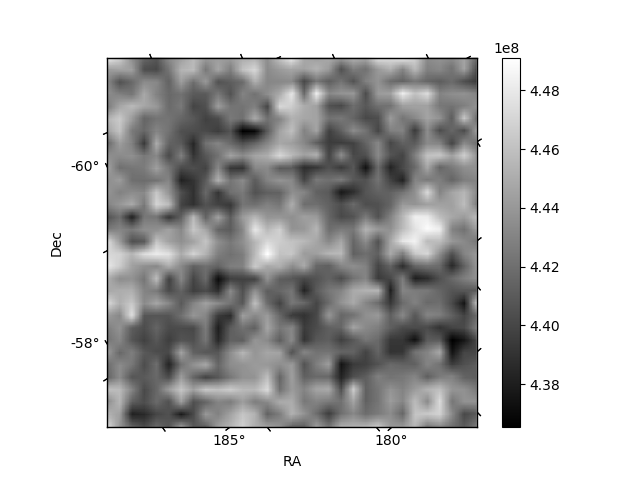
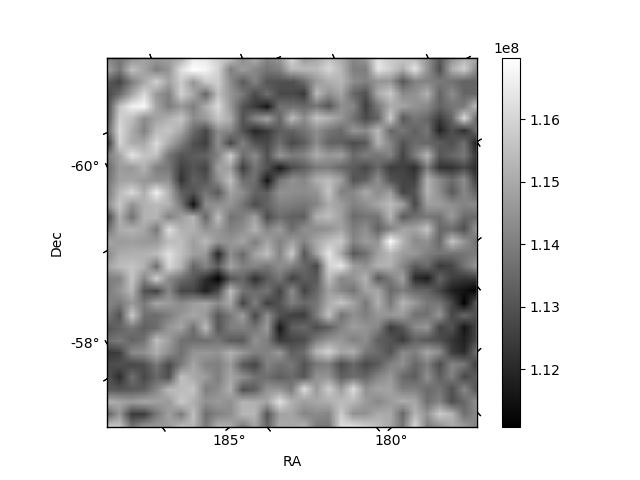
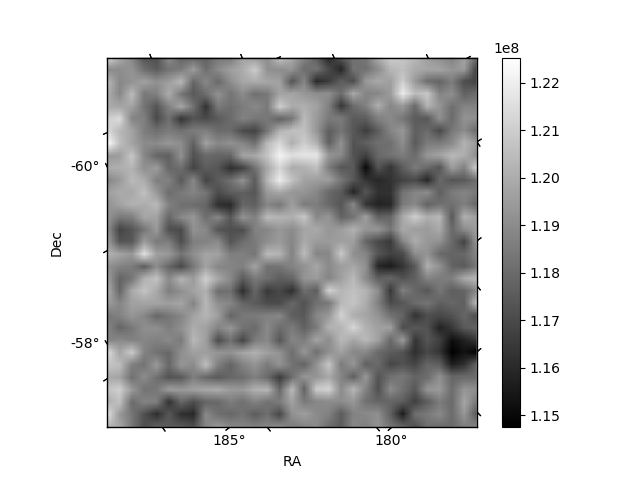
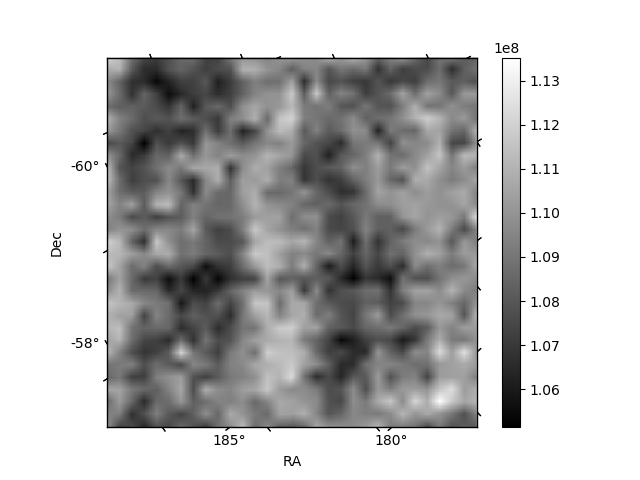
Histogram calculated using DETX and DETY for each event in the final _common_clean file
| Quadrant A | 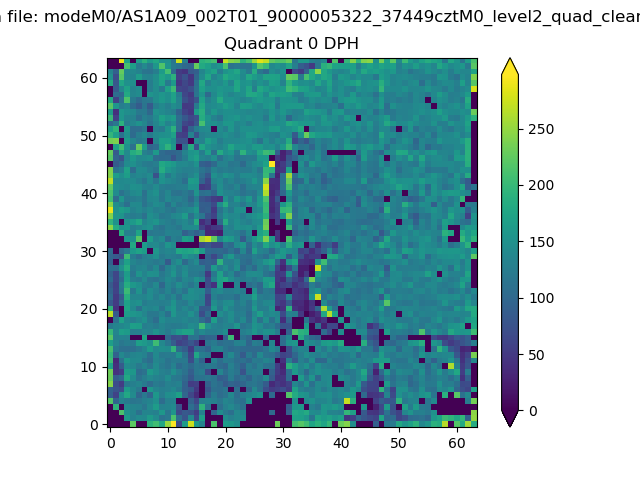 |
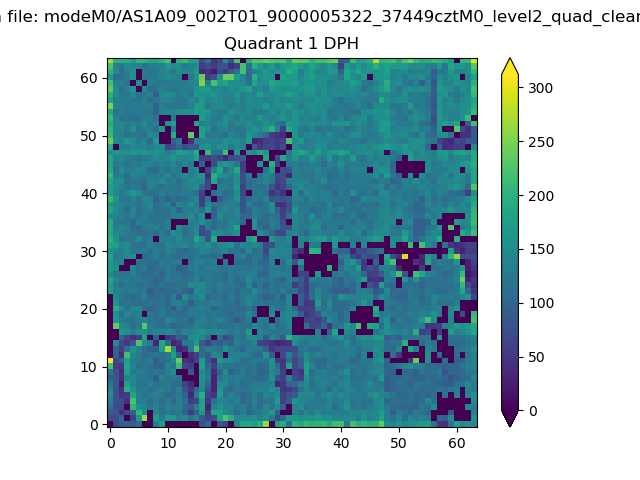 |
Quadrant B |
|---|---|---|---|
| Quadrant D | 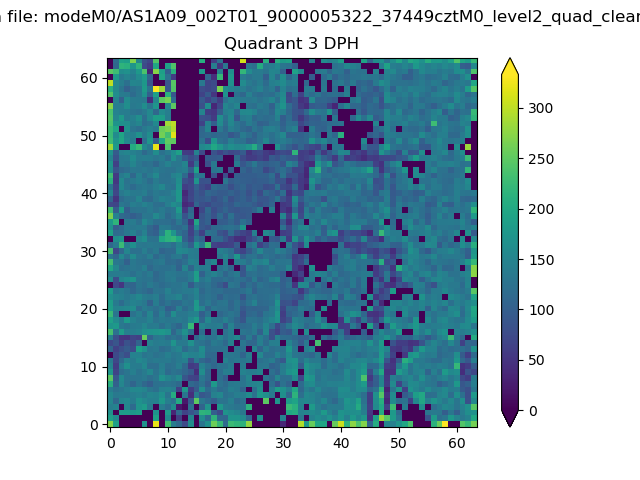 |
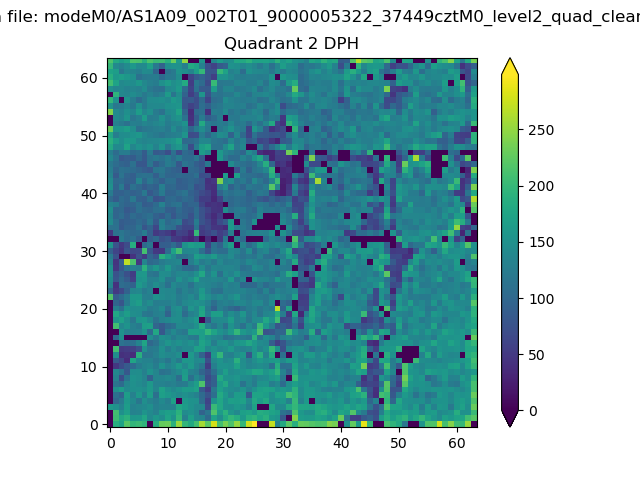 |
Quadrant C |
| Plot type | Count rate plots | Images |
|---|---|---|
| Comparison with Poisson distribution Blue bars denote a histogram of data divided into 1 sec bins. Red curve is a Poisson curve with rate = median count rate of data. |
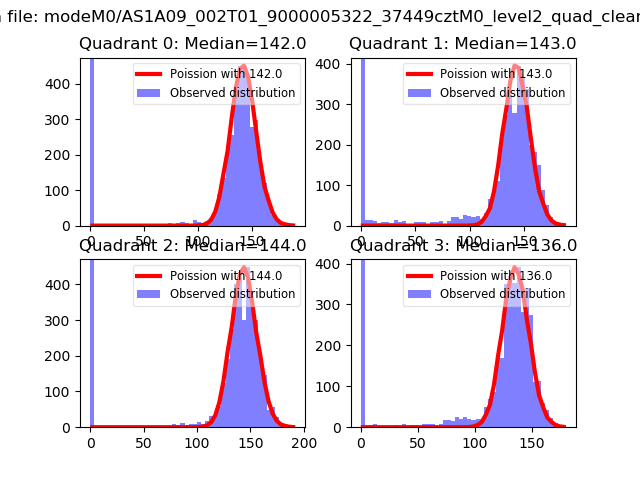 |
 |
| Quadrant-wise count rates Data is divided into 100 sec bins |
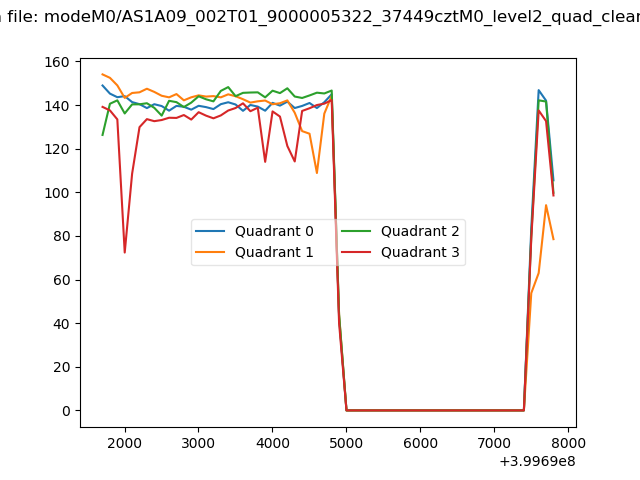 |
|
| Module-wise count rates for Quadrant A Data is divided into 100 sec bins |
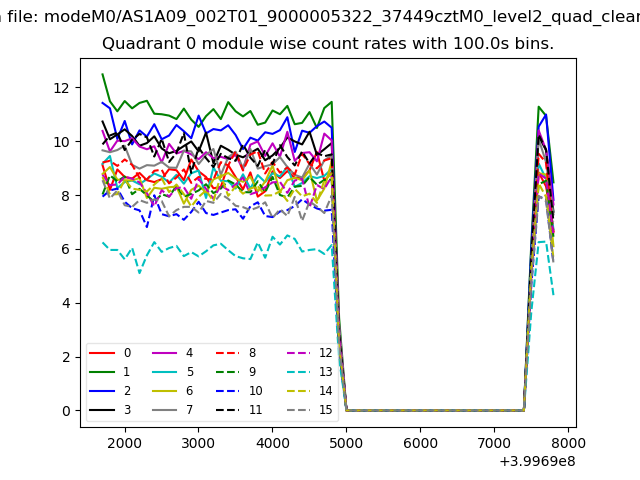 |
 |
| Module-wise count rates for Quadrant B Data is divided into 100 sec bins |
 |
 |
| Module-wise count rates for Quadrant C Data is divided into 100 sec bins |
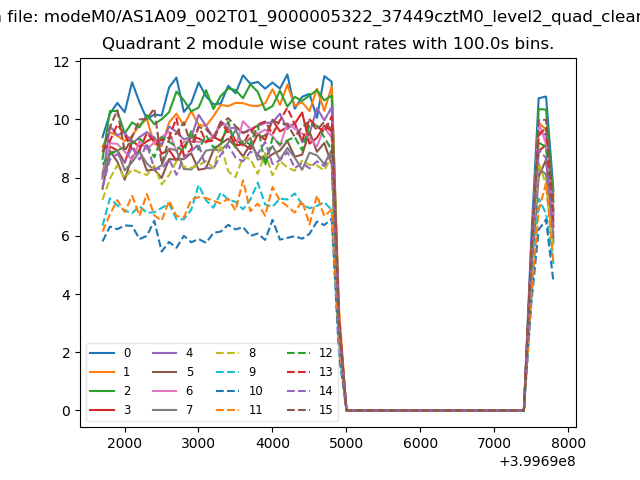 |
 |
| Module-wise count rates for Quadrant D Data is divided into 100 sec bins |
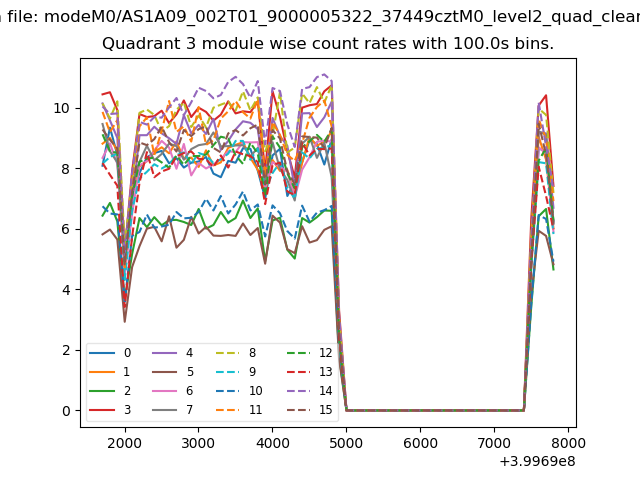 |
 |
| Parameter | Plot |
|---|---|
| CZT HV Monitor | 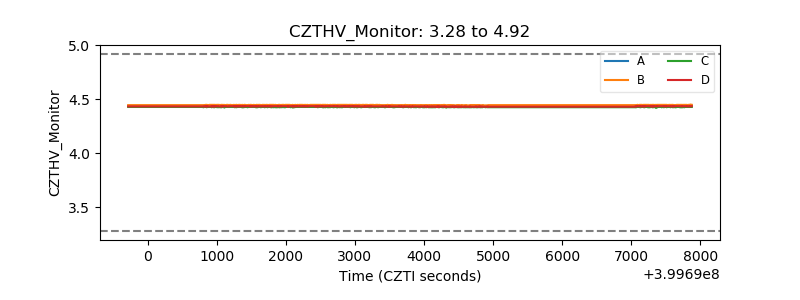 |
| D_VDD | 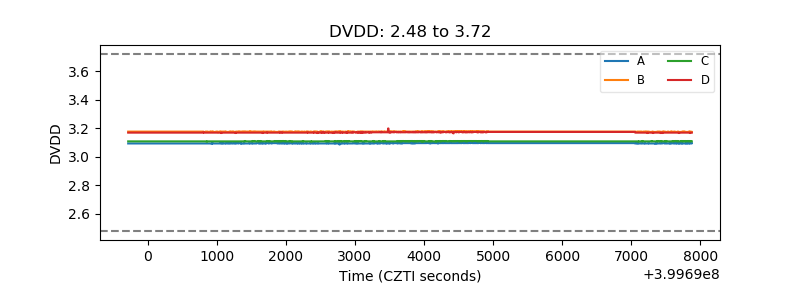 |
| Temperature 1 | 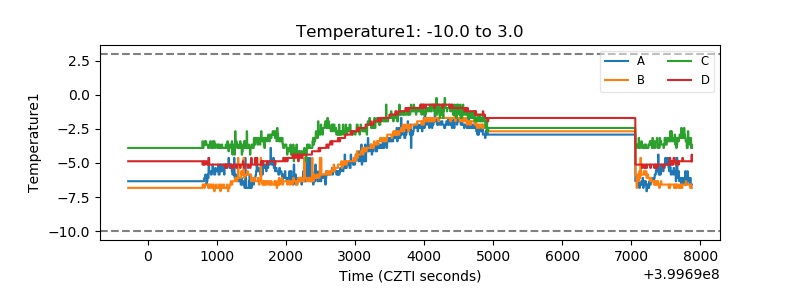 |
| Veto HV Monitor | 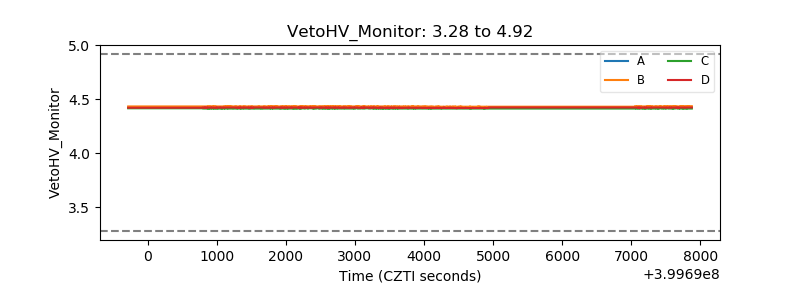 |
| Veto LLD | 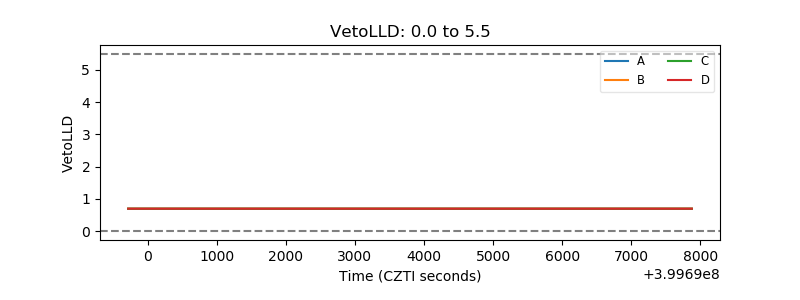 |
| Alpha Counter | 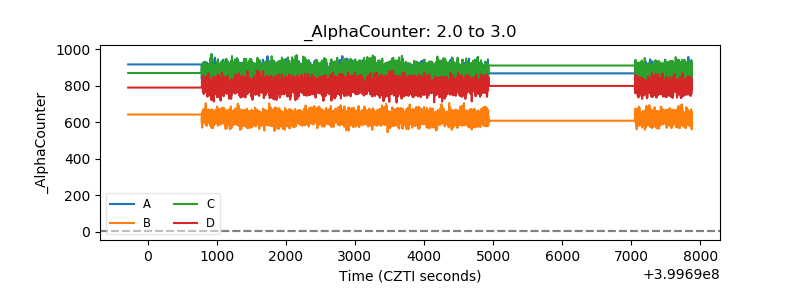 |
| _CPM_Rate | 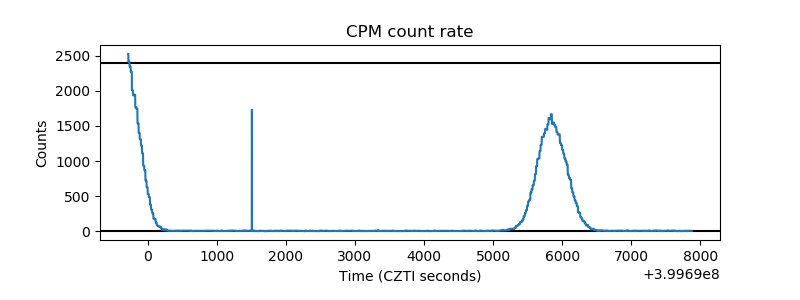 |
| CZT Counter | 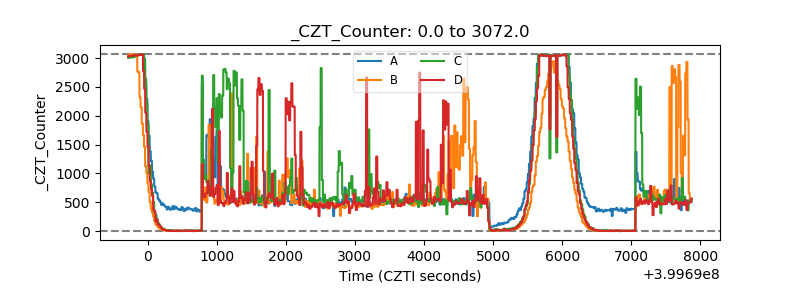 |
| +2.5 Volts monitor | 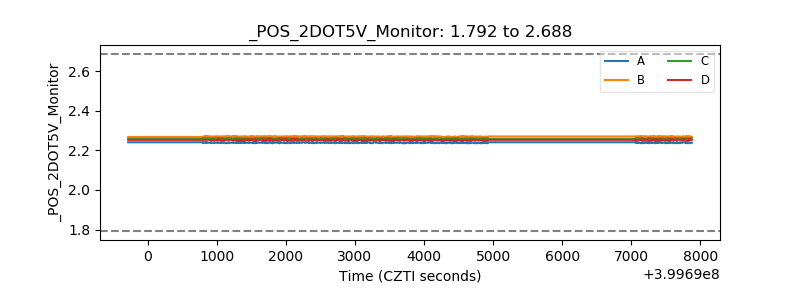 |
| +5 Volts monitor | 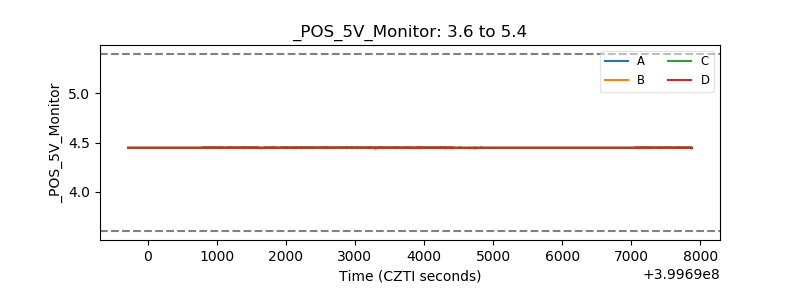 |
| _ROLL_ROT | 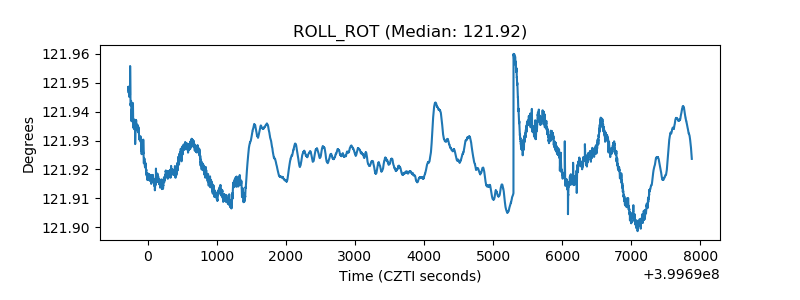 |
| _Roll_DEC | 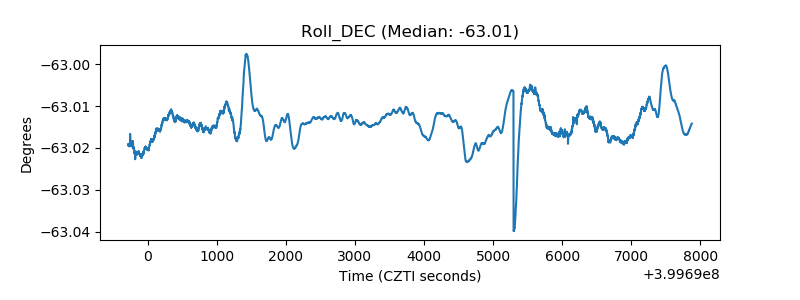 |
| _Roll_RA | 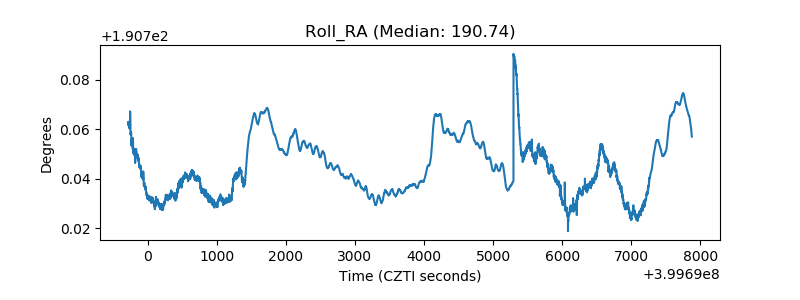 |
| Veto Counter | 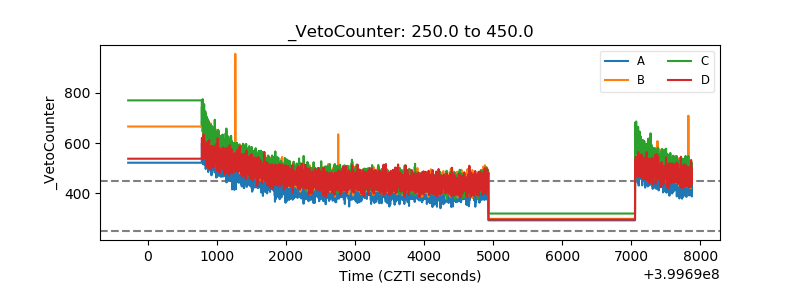 |