| Param | Original file | Final file |
|---|---|---|
| Filename | modeM0/AS1A09_002T01_9000005322_37450cztM0_level2.evt | modeM0/AS1A09_002T01_9000005322_37450cztM0_level2_quad_clean.evt |
| Size (bytes) | 478,696,320 | 91,560,960 |
| Size | 456.5 MB | 87.3 MB |
| Events in quadrant A | 3,162,143 | 616,264 |
| Events in quadrant B | 4,110,965 | 584,949 |
| Events in quadrant C | 3,336,029 | 625,493 |
| Events in quadrant D | 3,540,504 | 586,663 |
| Mode M0 | |||
|---|---|---|---|
| Quadrant | BADHDUFLAG | Total packets | Discarded packets |
| A | 0 | 12357 | 3 |
| B | 0 | 15467 | 2 |
| C | 0 | 12797 | 2 |
| D | 0 | 13829 | 2 |
| Mode M9 | |||
|---|---|---|---|
| Quadrant | BADHDUFLAG | Total packets | Discarded packets |
| A | 0 | 22 | 0 |
| B | 0 | 22 | 0 |
| C | 0 | 22 | 0 |
| D | 0 | 23 | 0 |
| Mode SS | |||
|---|---|---|---|
| Quadrant | BADHDUFLAG | Total packets | Discarded packets |
| A | 0 | 104 | 0 |
| B | 0 | 104 | 0 |
| C | 0 | 104 | 0 |
| D | 0 | 104 | 0 |
| Quadrant | Total seconds | Saturated seconds | Saturation percentage |
|---|---|---|---|
| A | 5126 | 78 | 1.521654% |
| B | 5126 | 577 | 11.256340% |
| C | 5126 | 213 | 4.155287% |
| D | 5126 | 225 | 4.389387% |
Noise dominated data is calculated using 1-second bins in cleaned event files. If a bin has >2000 counts, and if more than 50% of those come from <1% of pixels, then it is considered to be noise-dominated and hence unusable.
| Quadrant | # 1 sec bins | Bins with >0 counts | Bins with >2000 counts | High rate bins dominated by noise | Noise dominated (total time) | Noise dominated (detector-on time) | Marked lightcurve |
|---|---|---|---|---|---|---|---|
| A | 7220 | 5127 | 57 | 57 | 0.79% | 1.11% | 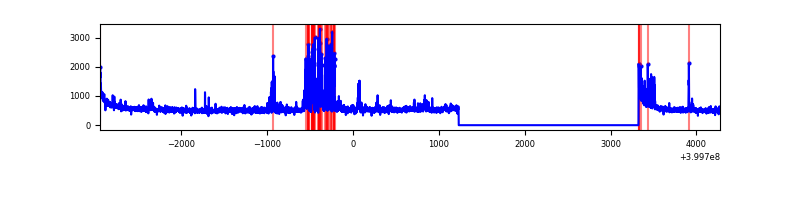 |
| B | 7220 | 5127 | 505 | 505 | 6.99% | 9.85% | 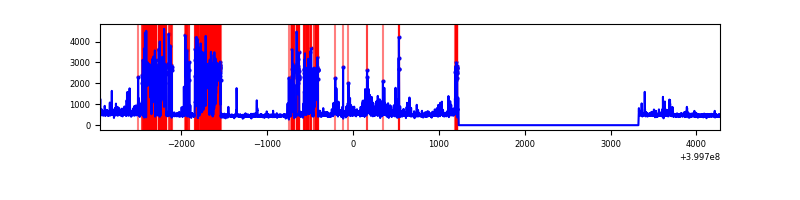 |
| C | 7220 | 5126 | 192 | 192 | 2.66% | 3.75% | 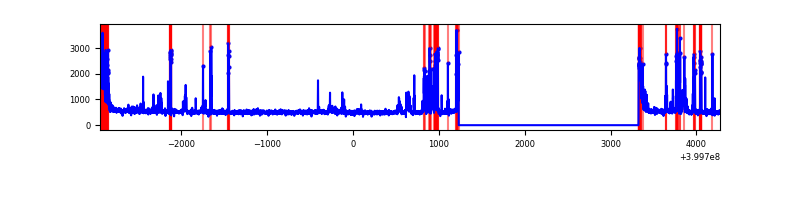 |
| D | 7220 | 5126 | 196 | 196 | 2.71% | 3.82% | 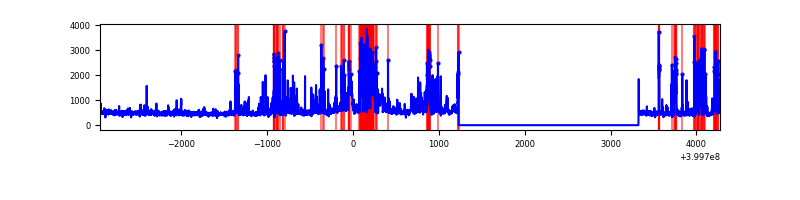 |
Top three noisy pixels from each quadrant. If the there are fewer than three noisy pixels in the level2.evt file, extra rows are filled as -1
| Pixel properties | Quadrant properties | ||||||
|---|---|---|---|---|---|---|---|
| Quadrant | DetID | PixID | Counts | Sigma | Mean | Median | Sigma |
| A | 13 | 248 | 377344 | 3104.15 | 613 | 603 | 121.4 |
| A | 10 | 83 | 276730 | 2275.14 | 613 | 603 | 121.4 |
| A | 15 | 222 | 77120 | 630.46 | 613 | 603 | 121.4 |
| B | 15 | 35 | 1524475 | 14122.12 | 574 | 561 | 107.9 |
| B | 4 | 171 | 186115 | 1719.53 | 574 | 561 | 107.9 |
| B | 5 | 172 | 34942 | 318.61 | 574 | 561 | 107.9 |
| C | 14 | 254 | 503047 | 3712.66 | 595 | 600 | 135.3 |
| C | 0 | 10 | 266170 | 1962.34 | 595 | 600 | 135.3 |
| C | 15 | 214 | 232575 | 1714.1 | 595 | 600 | 135.3 |
| D | 13 | 249 | 549433 | 3819.41 | 598 | 584 | 143.7 |
| D | 2 | 249 | 247374 | 1717.4 | 598 | 584 | 143.7 |
| D | 12 | 233 | 97740 | 676.1 | 598 | 584 | 143.7 |
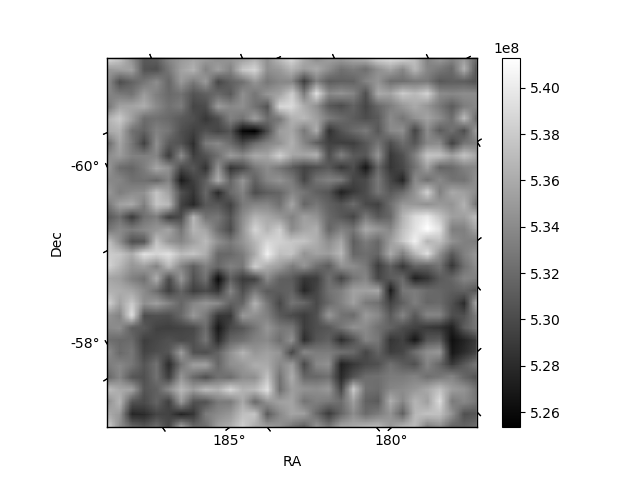
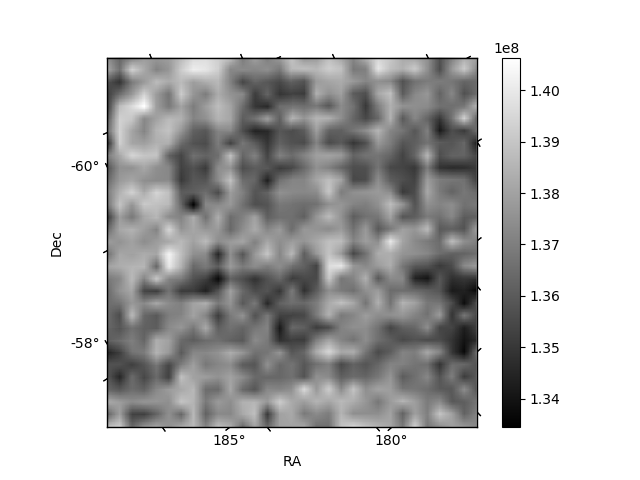
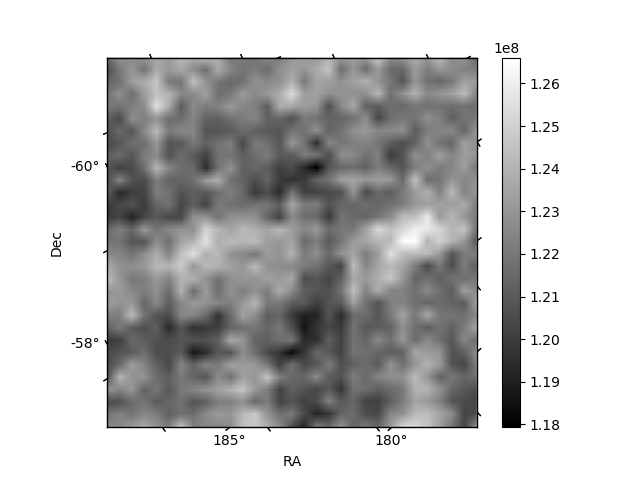
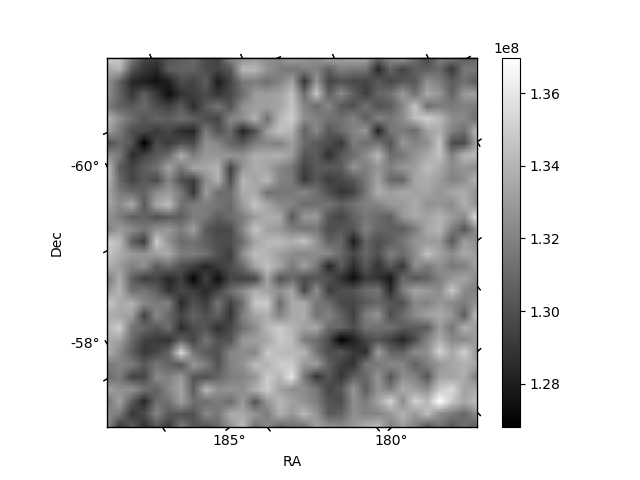
Histogram calculated using DETX and DETY for each event in the final _common_clean file
| Quadrant A | 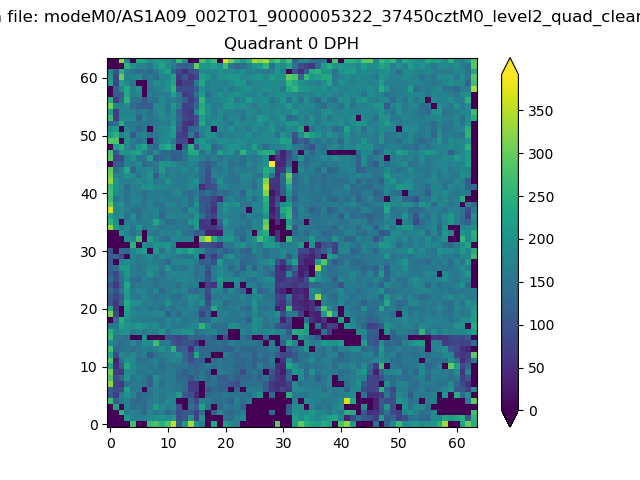 |
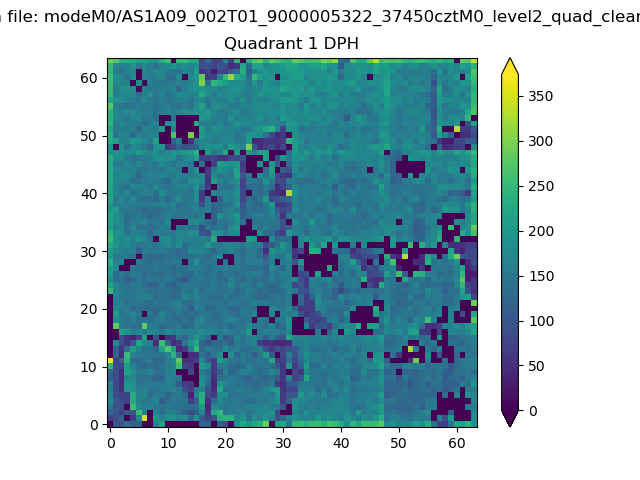 |
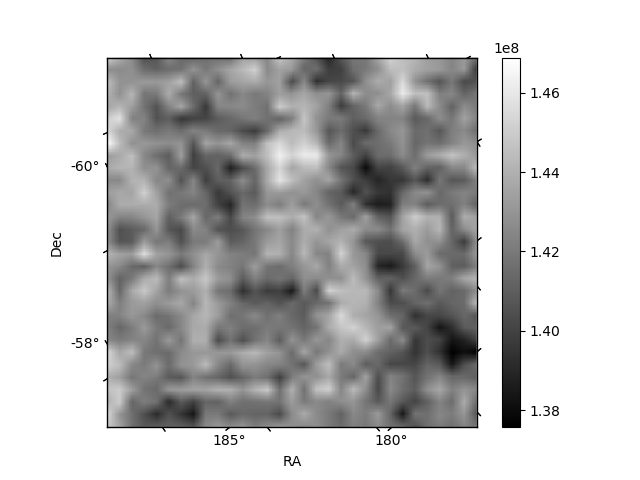
Quadrant B |
|---|---|---|---|
| Quadrant D | 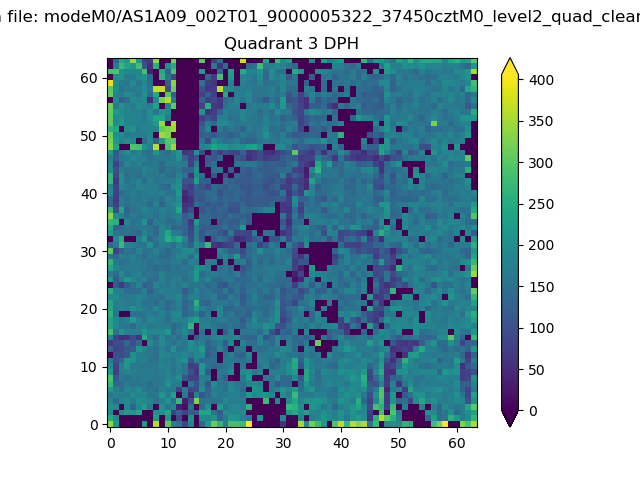 |
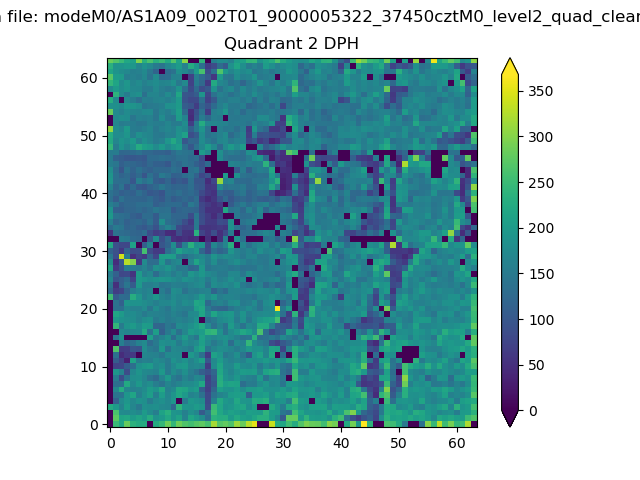 |
Quadrant C |
| Plot type | Count rate plots | Images |
|---|---|---|
| Comparison with Poisson distribution Blue bars denote a histogram of data divided into 1 sec bins. Red curve is a Poisson curve with rate = median count rate of data. |
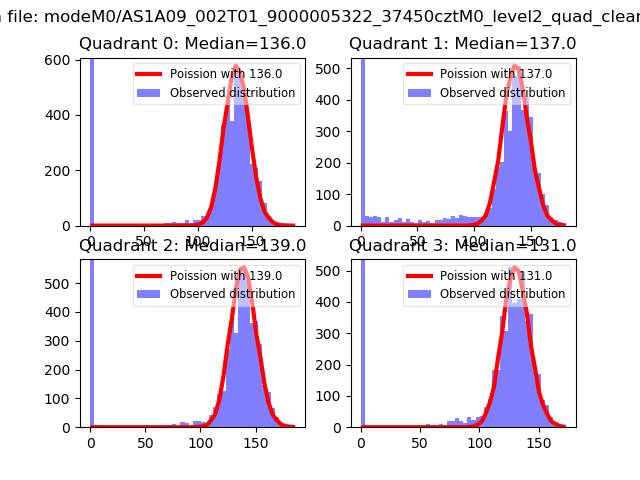 |
 |
| Quadrant-wise count rates Data is divided into 100 sec bins |
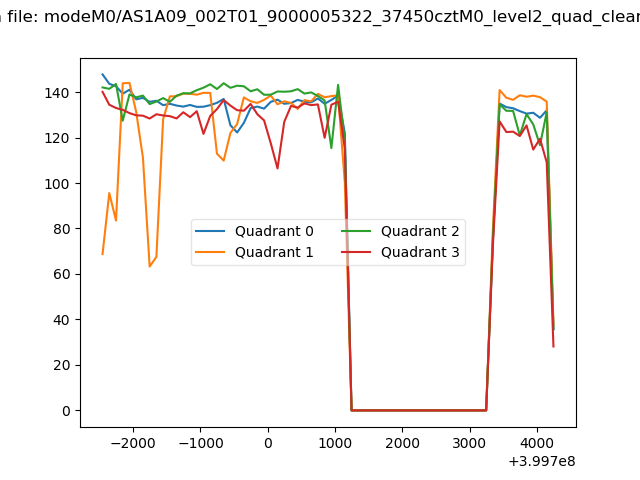 |
|
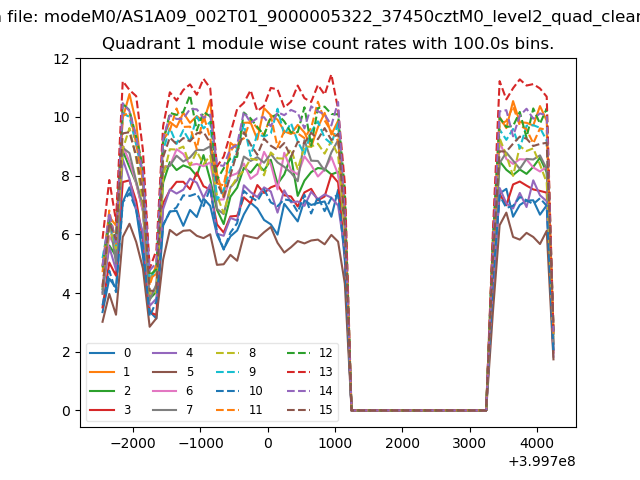
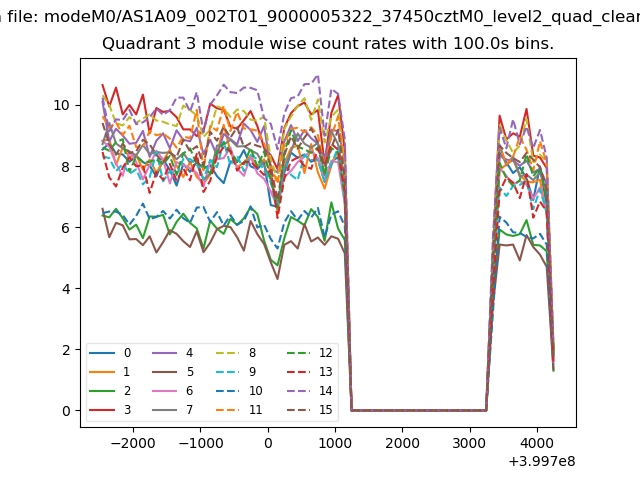
| Module-wise count rates for Quadrant A Data is divided into 100 sec bins |
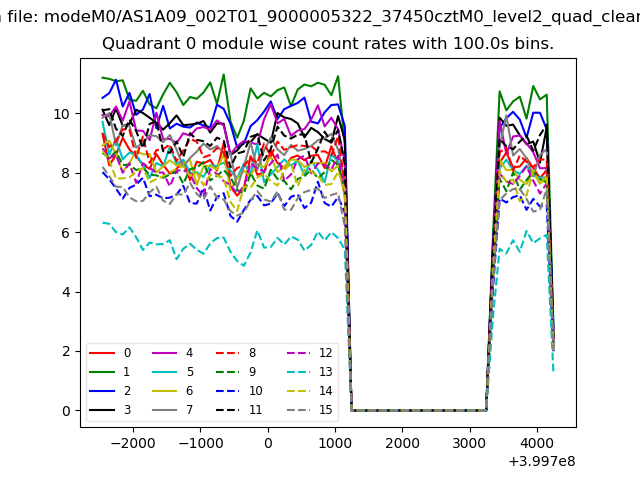 |
 |
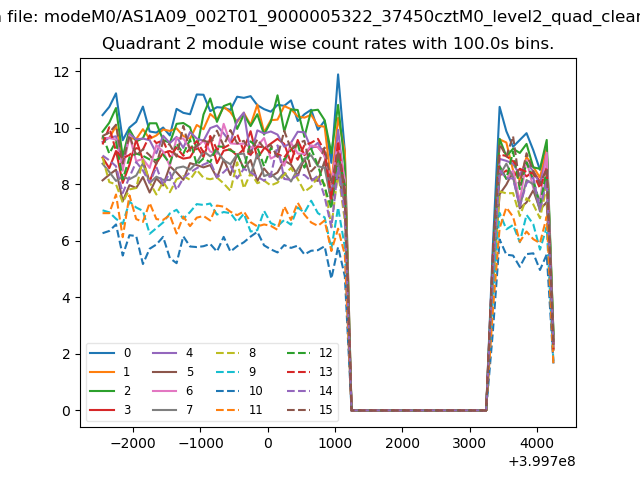
| Module-wise count rates for Quadrant B Data is divided into 100 sec bins |
 |
 |
| Module-wise count rates for Quadrant C Data is divided into 100 sec bins |
 |
 |
| Module-wise count rates for Quadrant D Data is divided into 100 sec bins |
 |
 |
| Parameter | Plot |
|---|---|
| CZT HV Monitor |  |
| D_VDD | 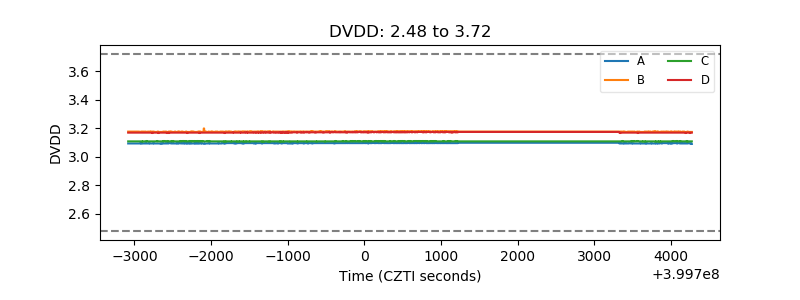 |
| Temperature 1 | 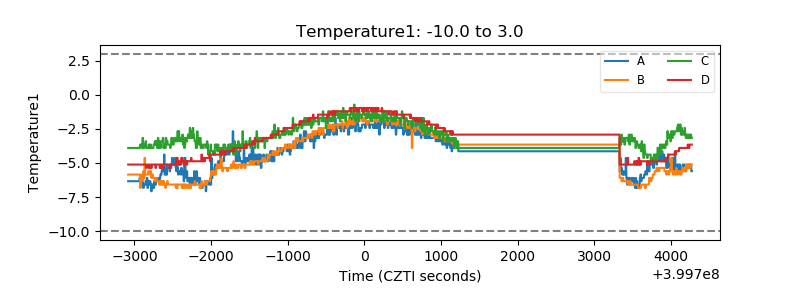 |
| Veto HV Monitor | 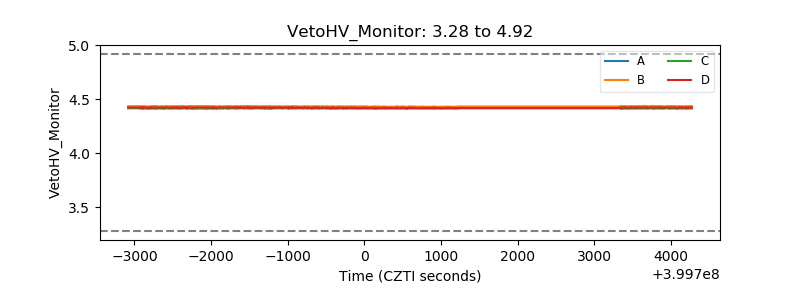 |
| Veto LLD | 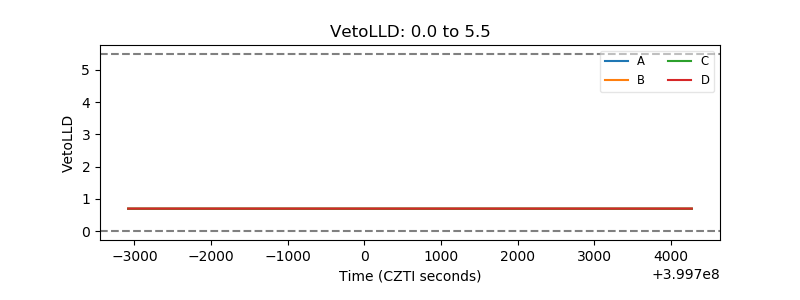 |
| Alpha Counter | 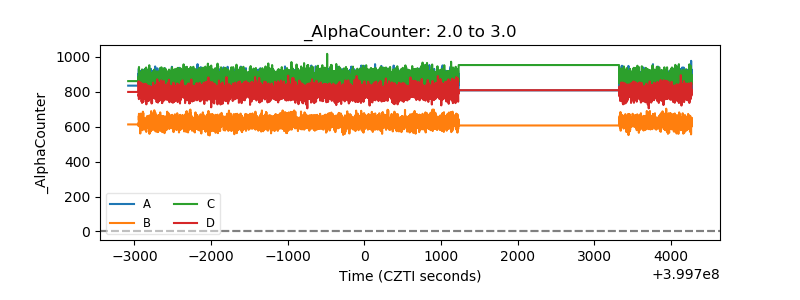 |
| _CPM_Rate | 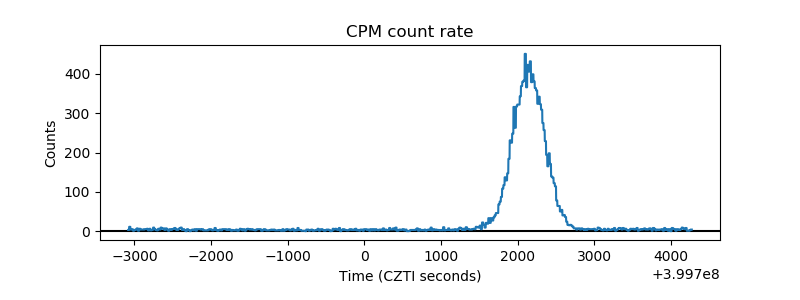 |
| CZT Counter | 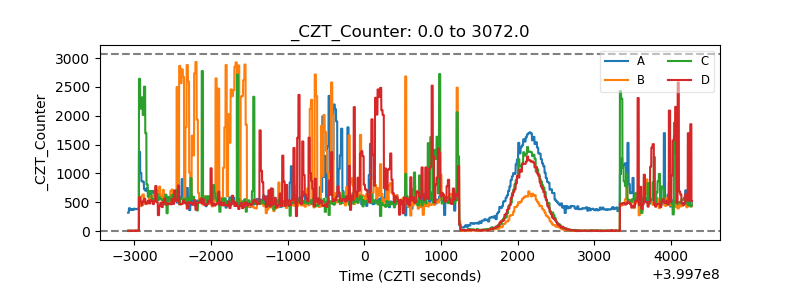 |
| +2.5 Volts monitor | 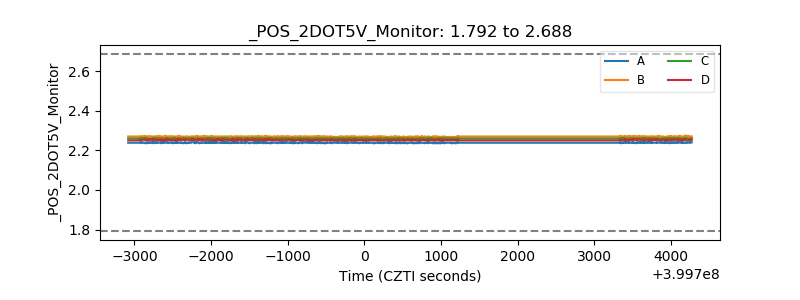 |
| +5 Volts monitor |  |
| _ROLL_ROT | 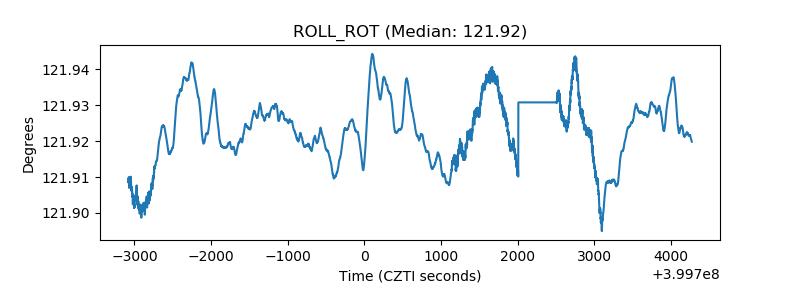 |
| _Roll_DEC | 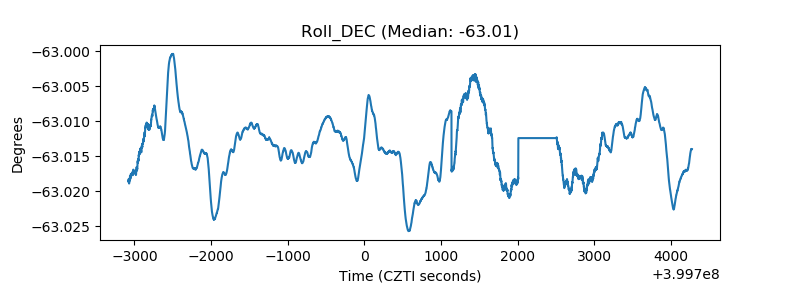 |
| _Roll_RA | 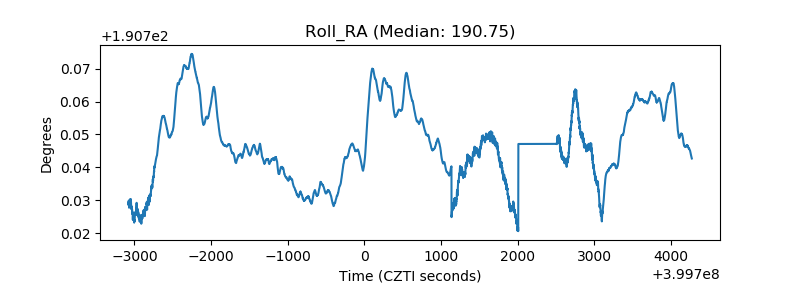 |
| Veto Counter | 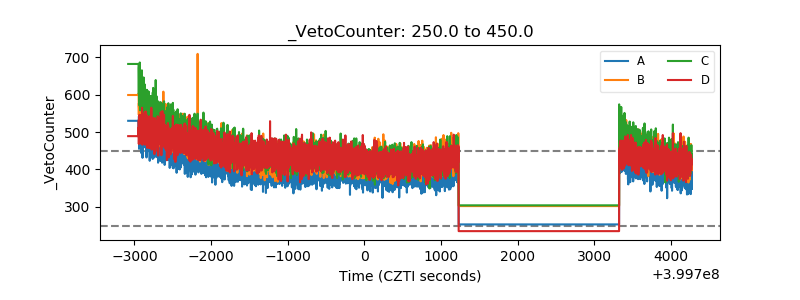 |